result
A
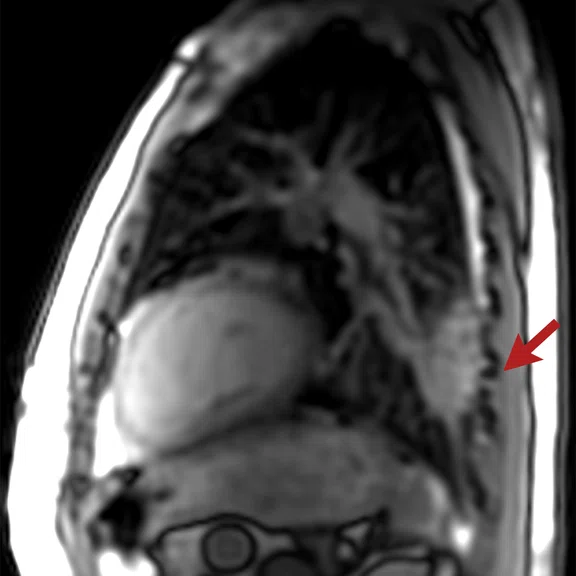
Figure 1.
Localizer series, showing lung consolidation (red arrows). (A) Axial FIESTA, 2.0 x 2.0 x 8.0 mm, 7 sec. and (B) sagittal FIESTA, 2.0 x 2.0 x 8.0 mm, 4 sec.
B
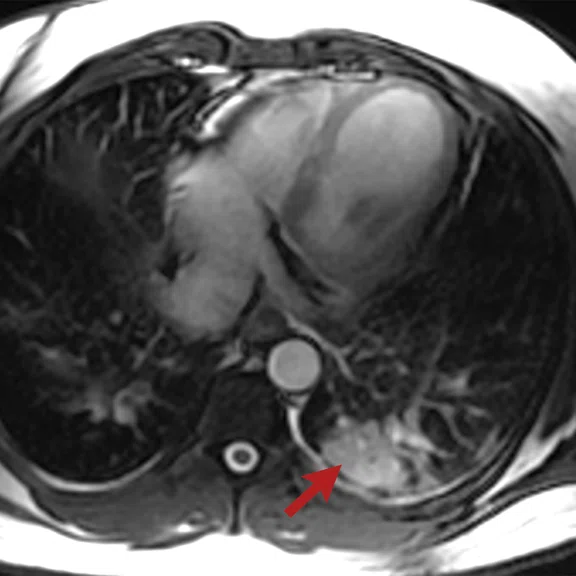
Figure 1.
Localizer series, showing lung consolidation (red arrows). (A) Axial FIESTA, 2.0 x 2.0 x 8.0 mm, 7 sec. and (B) sagittal FIESTA, 2.0 x 2.0 x 8.0 mm, 4 sec.
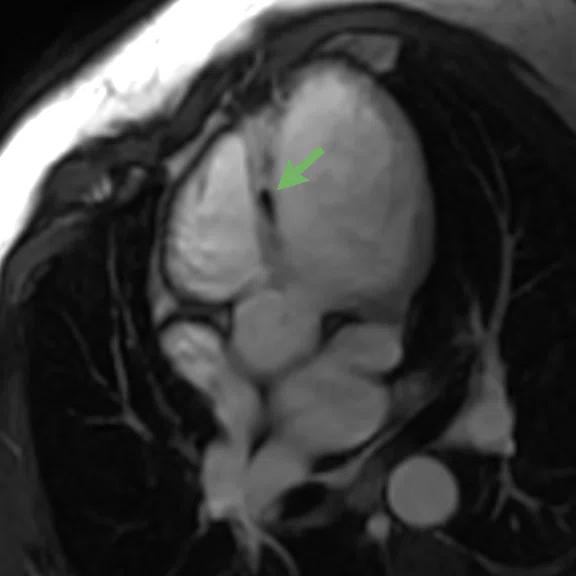
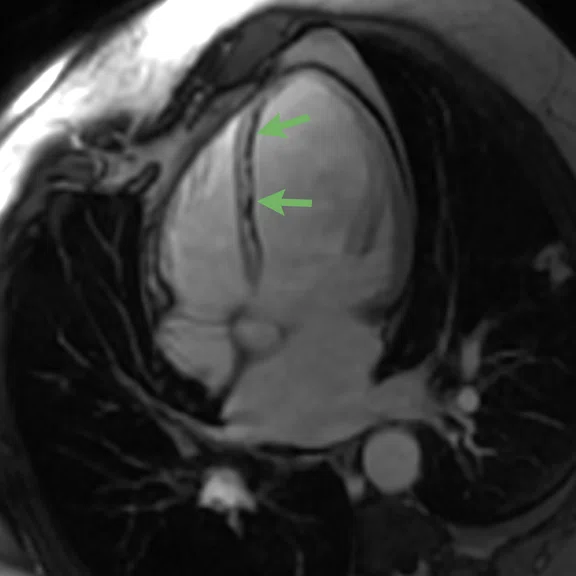
A
Figure 2.
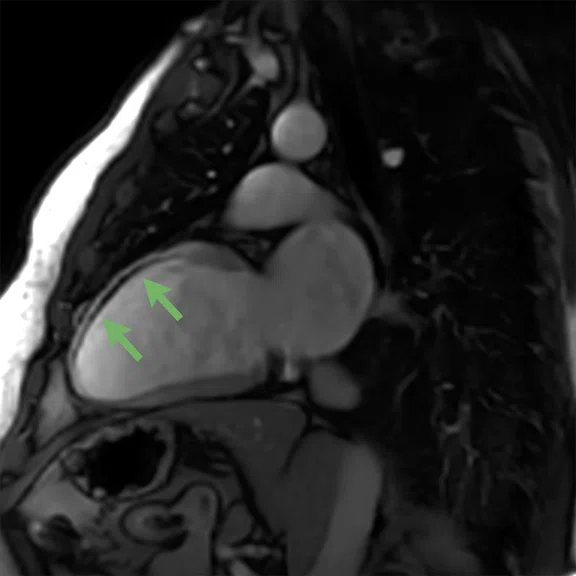
Early gadolinium enhancement with AIR™ Recon DL demonstrating microvascular obstruction (green arrows). (A-C) 2- and 4-chamber early Single-Shot PS MDE, 1.6 x 2.3 x 8 mm, 3rd minute.
B
Figure 2.
Early gadolinium enhancement with AIR™ Recon DL demonstrating microvascular obstruction (green arrows). (A-C) 2- and 4-chamber early Single-Shot PS MDE, 1.6 x 2.3 x 8 mm, 3rd minute.
C
Figure 2.
Early gadolinium enhancement with AIR™ Recon DL demonstrating microvascular obstruction (green arrows). (A-C) 2- and 4-chamber early Single-Shot PS MDE, 1.6 x 2.3 x 8 mm, 3rd minute.
A
Figure 5.
Delayed gadolinium enhancement with AIR™ Recon DL demonstrating myocardial obstruction (green arrow) and delayed myocardial enhancement (red arrows). (A) Short axis PS MDE, 1.7 x 2.0 x 8.0 mm, (B-D) with conventional reconstruction, and (E-G) with AIR™ Recon DL.
B
Figure 5.
Delayed gadolinium enhancement with AIR™ Recon DL demonstrating myocardial obstruction (green arrow) and delayed myocardial enhancement (red arrows). (A) Short axis PS MDE, 1.7 x 2.0 x 8.0 mm, (B-D) with conventional reconstruction, and (E-G) with AIR™ Recon DL.
C
Figure 5.
Delayed gadolinium enhancement with AIR™ Recon DL demonstrating myocardial obstruction (green arrow) and delayed myocardial enhancement (red arrows). (A) Short axis PS MDE, 1.7 x 2.0 x 8.0 mm, (B-D) with conventional reconstruction, and (E-G) with AIR™ Recon DL.
D
Figure 5.
Delayed gadolinium enhancement with AIR™ Recon DL demonstrating myocardial obstruction (green arrow) and delayed myocardial enhancement (red arrows). (A) Short axis PS MDE, 1.7 x 2.0 x 8.0 mm, (B-D) with conventional reconstruction, and (E-G) with AIR™ Recon DL.
E
Figure 5.
Delayed gadolinium enhancement with AIR™ Recon DL demonstrating myocardial obstruction (green arrow) and delayed myocardial enhancement (red arrows). (A) Short axis PS MDE, 1.7 x 2.0 x 8.0 mm, (B-D) with conventional reconstruction, and (E-G) with AIR™ Recon DL.
F
Figure 5.
Delayed gadolinium enhancement with AIR™ Recon DL demonstrating myocardial obstruction (green arrow) and delayed myocardial enhancement (red arrows). (A) Short axis PS MDE, 1.7 x 2.0 x 8.0 mm, (B-D) with conventional reconstruction, and (E-G) with AIR™ Recon DL.
G
Figure 5.
Delayed gadolinium enhancement with AIR™ Recon DL demonstrating myocardial obstruction (green arrow) and delayed myocardial enhancement (red arrows). (A) Short axis PS MDE, 1.7 x 2.0 x 8.0 mm, (B-D) with conventional reconstruction, and (E-G) with AIR™ Recon DL.
A
Figure 6.
(A) Myocardial strain analysis (tissue tracking), (B) function results from cmr42-DL and (C, D) myocardial mapping results with T1 MOLLI, calculating the ECV map on cmr42.
B
Figure 6.
(A) Myocardial strain analysis (tissue tracking), (B) function results from cmr42-DL and (C, D) myocardial mapping results with T1 MOLLI, calculating the ECV map on cmr42.
C-1
Figure 6.
(A) Myocardial strain analysis (tissue tracking), (B) function results from cmr42-DL and (C, D) myocardial mapping results with T1 MOLLI, calculating the ECV map on cmr42.
C-4
Figure 6.
(A) Myocardial strain analysis (tissue tracking), (B) function results from cmr42-DL and (C, D) myocardial mapping results with T1 MOLLI, calculating the ECV map on cmr42.
D-1
Figure 6.
(A) Myocardial strain analysis (tissue tracking), (B) function results from cmr42-DL and (C, D) myocardial mapping results with T1 MOLLI, calculating the ECV map on cmr42.
D-4
Figure 6.
(A) Myocardial strain analysis (tissue tracking), (B) function results from cmr42-DL and (C, D) myocardial mapping results with T1 MOLLI, calculating the ECV map on cmr42.
C-2
Figure 6.
(A) Myocardial strain analysis (tissue tracking), (B) function results from cmr42-DL and (C, D) myocardial mapping results with T1 MOLLI, calculating the ECV map on cmr42.
D-2
Figure 6.
(A) Myocardial strain analysis (tissue tracking), (B) function results from cmr42-DL and (C, D) myocardial mapping results with T1 MOLLI, calculating the ECV map on cmr42.
C-3
Figure 6.
(A) Myocardial strain analysis (tissue tracking), (B) function results from cmr42-DL and (C, D) myocardial mapping results with T1 MOLLI, calculating the ECV map on cmr42.
D-3
Figure 6.
(A) Myocardial strain analysis (tissue tracking), (B) function results from cmr42-DL and (C, D) myocardial mapping results with T1 MOLLI, calculating the ECV map on cmr42.
1. Madjid M, Safavi-Naeini P, Solomon SD, Vardeny O. Potential Effects of Coronaviruses on the Cardiovascular System: A Review. JAMA Cardiol. 2020;5(7):831–840. doi:10.1001/jamacardio.2020.1286
2. Matsushita K, Ding N, Kou M, et al. The Relationship of COVID-19 Severity with Cardiovascular Disease and Its Traditional Risk Factors: A Systematic Review and Meta-Analysis. Glob Heart. 2020;15(1):64. Published 2020 Sep 22. doi:10.5334/gh.814
3. Sabatino J, De Rosa S, Di Salvo G, Indolfi C. Impact of cardiovascular risk profile on COVID-19 outcome. A meta-analysis [published correction appears in PLoS One. 2020 Dec 3;15(12):e0243471]. PLoS One. 2020;15(8):e0237131. Published 2020 Aug 14. doi:10.1371/journal.pone.0237131
A
Figure 4.
Delayed gadolinium enhancement with AIR™ Recon DL demonstrating myocardial obstruction (green arrows) and delayed myocardial enhancement (red arrows). (A) 4-chamber PS MDE, 1.7 x 2.0 x 8.0 mm, (B-D) with conventional reconstruction, and (E-G) with AIR™ Recon DL.
B
Figure 4.
Delayed gadolinium enhancement with AIR™ Recon DL demonstrating myocardial obstruction (green arrows) and delayed myocardial enhancement (red arrows). (A) 4-chamber PS MDE, 1.7 x 2.0 x 8.0 mm, (B-D) with conventional reconstruction, and (E-G) with AIR™ Recon DL.
C
Figure 4.
Delayed gadolinium enhancement with AIR™ Recon DL demonstrating myocardial obstruction (green arrows) and delayed myocardial enhancement (red arrows). (A) 4-chamber PS MDE, 1.7 x 2.0 x 8.0 mm, (B-D) with conventional reconstruction, and (E-G) with AIR™ Recon DL.
D
Figure 4.
Delayed gadolinium enhancement with AIR™ Recon DL demonstrating myocardial obstruction (green arrows) and delayed myocardial enhancement (red arrows). (A) 4-chamber PS MDE, 1.7 x 2.0 x 8.0 mm, (B-D) with conventional reconstruction, and (E-G) with AIR™ Recon DL.
E
Figure 4.
Delayed gadolinium enhancement with AIR™ Recon DL demonstrating myocardial obstruction (green arrows) and delayed myocardial enhancement (red arrows). (A) 4-chamber PS MDE, 1.7 x 2.0 x 8.0 mm, (B-D) with conventional reconstruction, and (E-G) with AIR™ Recon DL.
F
Figure 4.
Delayed gadolinium enhancement with AIR™ Recon DL demonstrating myocardial obstruction (green arrows) and delayed myocardial enhancement (red arrows). (A) 4-chamber PS MDE, 1.7 x 2.0 x 8.0 mm, (B-D) with conventional reconstruction, and (E-G) with AIR™ Recon DL.
G
Figure 4.
Delayed gadolinium enhancement with AIR™ Recon DL demonstrating myocardial obstruction (green arrows) and delayed myocardial enhancement (red arrows). (A) 4-chamber PS MDE, 1.7 x 2.0 x 8.0 mm, (B-D) with conventional reconstruction, and (E-G) with AIR™ Recon DL.
A
Figure 3.
Delayed gadolinium enhancement with AIR™ Recon DL demonstrating myocardial obstruction (green arrow) and delayed myocardial enhancement (red arrows). (A) 2-chamber PS MDE, 1.7 x 2.0 x 8.0 mm, (B, C) with conventional reconstruction, and (D, E) with AIR™ Recon DL.
B
Figure 3.
Delayed gadolinium enhancement with AIR™ Recon DL demonstrating myocardial obstruction (green arrow) and delayed myocardial enhancement (red arrows). (A) 2-chamber PS MDE, 1.7 x 2.0 x 8.0 mm, (B, C) with conventional reconstruction, and (D, E) with AIR™ Recon DL.
C
Figure 3.
Delayed gadolinium enhancement with AIR™ Recon DL demonstrating myocardial obstruction (green arrow) and delayed myocardial enhancement (red arrows). (A) 2-chamber PS MDE, 1.7 x 2.0 x 8.0 mm, (B, C) with conventional reconstruction, and (D, E) with AIR™ Recon DL.
D
Figure 3.
Delayed gadolinium enhancement with AIR™ Recon DL demonstrating myocardial obstruction (green arrow) and delayed myocardial enhancement (red arrows). (A) 2-chamber PS MDE, 1.7 x 2.0 x 8.0 mm, (B, C) with conventional reconstruction, and (D, E) with AIR™ Recon DL.
E
Figure 3.
Delayed gadolinium enhancement with AIR™ Recon DL demonstrating myocardial obstruction (green arrow) and delayed myocardial enhancement (red arrows). (A) 2-chamber PS MDE, 1.7 x 2.0 x 8.0 mm, (B, C) with conventional reconstruction, and (D, E) with AIR™ Recon DL.


PREVIOUS
${prev-page}
NEXT
${next-page}
Subscribe Now
Manage Subscription
FOLLOW US
Contact Us • Cookie Preferences • Privacy Policy • California Privacy PolicyDo Not Sell or Share My Personal Information • Terms & Conditions • Security
© 2024 GE HealthCare. GE is a trademark of General Electric Company. Used under trademark license.
COVID-19
Cardiac MR for differentiating cardiac disease in COVID-19 patients
Cardiac MR for differentiating cardiac disease in COVID-19 patients
by Donya Al Hassan, MD, Head of Cardiothoracic Imaging Unit, King Fahad Military Medical Complex, Dhahran, Saudi Arabia
As one of the largest and most advanced hospitals in the Kingdom of Saudi Arabia, King Fahad Medical Military Complex (KFMMC) prepared to receive a surge of critically ill patients infected with SARS-CoV-2, the virus that causes COVID-19, early in the pandemic. The intensive care service department implemented a strategy that addressed the need to increase available services and resources, including additional ICU beds and trained personnel available outside of the conventional ICU department.
This strategy included processes for overflow planning to prevent infection transmission and dealing with limited staff in the event of exposure to the virus and subsequent quarantine. The hospital also ensured the availability of proper supplies and access to diagnostic services, such as MR imaging for COVID-19 patients presenting with cardiac issues.
Patient history
A 49-year-old male presented to the emergency room of another government hospital facility with a sore throat. He tested positive for COVID-19 at that time and was prescribed antibiotics for the secondary infection (sore throat).
Ten days after the positive test, he began to experience progressively worsening paroxysmal retrosternal chest pain. He had no cough and did not report any diarrhea, malaise or myalgia. His past medical history was remarkable for mild obesity, Type II diabetes mellitus and dyslipidemia. No other cardiac history or other chronic illness was reported. Patient was transferred to KFMMC.
In our ER department, the patient’s vital signs were within normal limits and a COVID-19 test was performed, again with a positive result. An ECG demonstrated ST elevation in V1, V2, and V3. A bedside echo revealed a severely reduced LV systolic function with an ejection fraction of 34% and a large size left anterior descending (LAD) artery territory akinesia. Troponin levels obtained in the ER measured 0.099. COVID-19 serum biomarkers were also elevated.
STEMI pathway was activated and the patient was taken immediately for a cardiac catheterization. Acute coronary syndrome was confirmed with proximal LAD total occlusion. Patient underwent percutaneous coronary intervention of the LAD.
Several days after the cardiac catheterization, the patient underwent cardiac MR (CMR).
Results
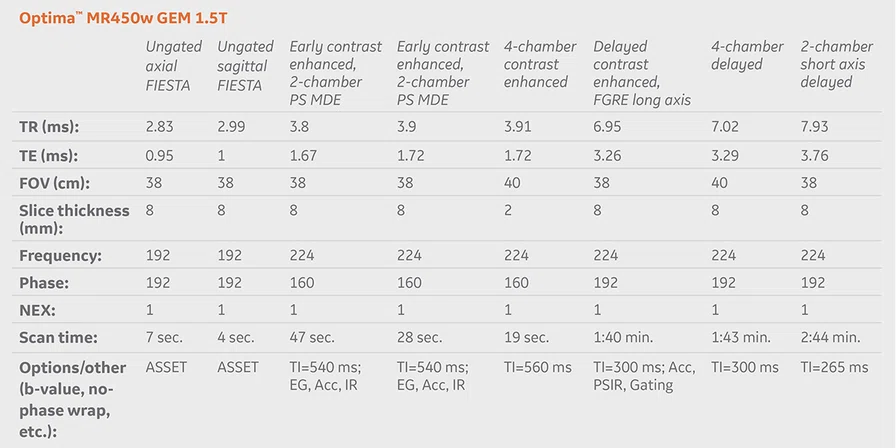
The MR exam demonstrated delayed hyperenhancement of the anteroseptal and apical walls with severe hypokinesis with associated late gadolinium enhancement and microvascular obstruction, consistent with acute infarction (Figures 3-5). Further, on native and post-contrast T1 MOLLI images, there were high T1 values of the lateral and inferior walls, suggesting myocarditis (Figure 6). A small left ventricular thrombus was also identified. Additionally, the localizer images demonstrated bilateral peripheral lung consolidations, which are consistent with COVID-19 pneumonia pattern (Figure 1).
Due to the presence of PCR positive, elevated COVID-19 biomarkers and the MR imaging depiction of myocarditis, COVID-19 treatment protocol was initiated. He was admitted to the cardiac care unit and received pharmacologic treatment for heart failure and COVID-19 infection. Patient was subsequently transferred to the cardiac ward then discharged home where his physical activity is progressively improving.
Discussion
Several studies demonstrate the relationship between COVID-19 infection and cardiovascular disease using cardiac biomarkers, ECG and echocardiography to diagnose acute myocardial injury1-3. As evidenced by the cardiac MR findings in our patient, radiology can play an important role in differentiating various causes of myocardial injury.
This is important because treatment strategies for myocarditis differs from treatments for coronary thrombosis. Therefore, in the setting of COVID-19 infection, which can cause myocarditis, coronary thrombosis or cardiac thrombi, CMR may have a valuable role in determining the clinical pathway of patients presenting with cardiac symptoms and for initiating appropriate therapy.
We expect to perform more CMR exams, due to the high prevalence of COVID-19 cardiac involvement.
In parallel, solutions such as AIR™ Recon DL, a deep-learning-based reconstruction software, are helpful to address challenging CMR exams by delivering high SNR and image resolution.


