A
Figure 1.
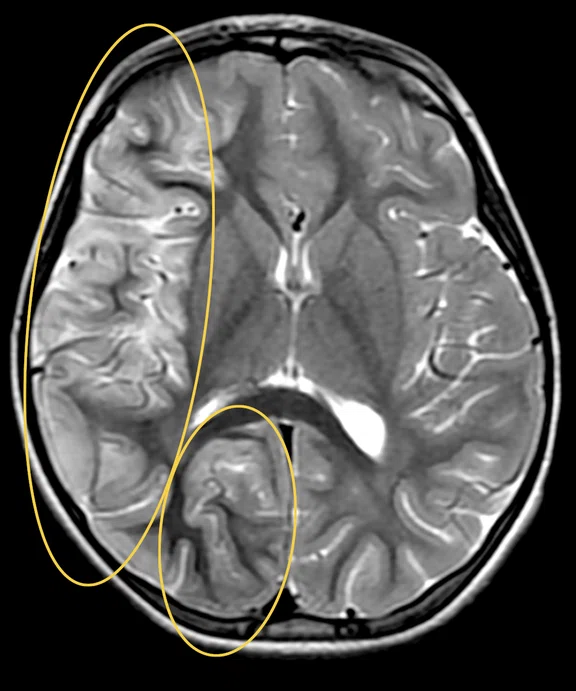
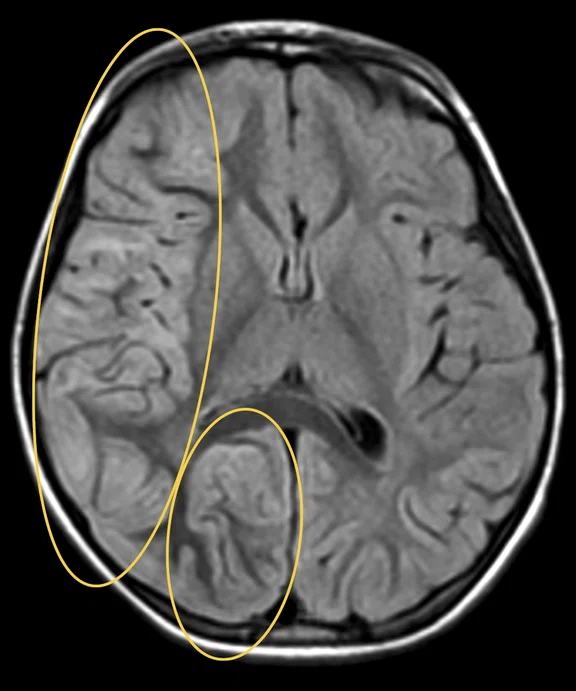
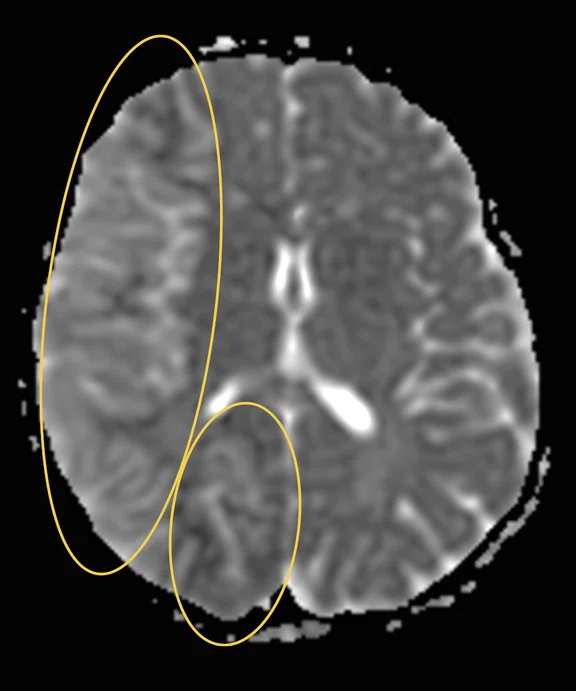
Hyperintense signal on (A) T2 and (B) T2 FLAIR on right hemispheric cerebral cortex predominant on fronto-parieto-insular region with (C) an increased ADC value derived from axial diffusion b1000.
B
Figure 1.
Hyperintense signal on (A) T2 and (B) T2 FLAIR on right hemispheric cerebral cortex predominant on fronto-parieto-insular region with (C) an increased ADC value derived from axial diffusion b1000.
C
Figure 1.
Hyperintense signal on (A) T2 and (B) T2 FLAIR on right hemispheric cerebral cortex predominant on fronto-parieto-insular region with (C) an increased ADC value derived from axial diffusion b1000.
A
Figure 2.
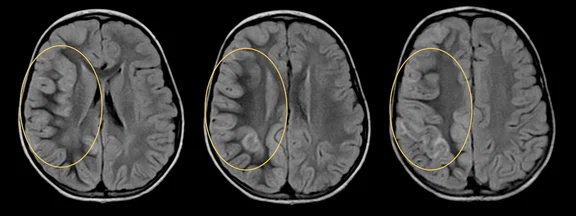
Discrete anomaly of signal of subcortical white matter on parietal region on T2 FLAIR images.
A
Figure 3.
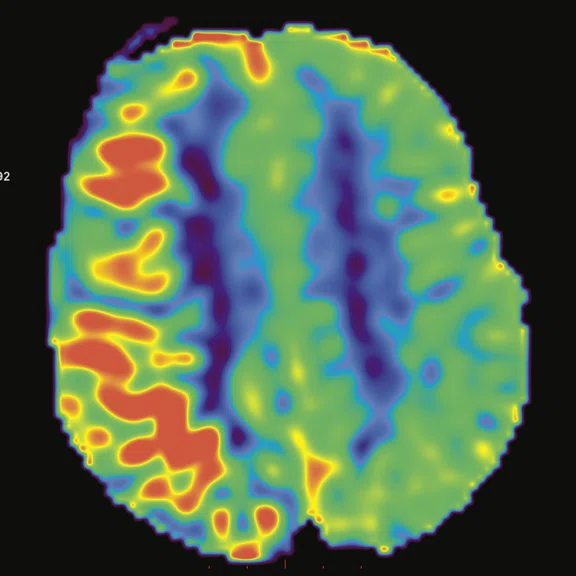
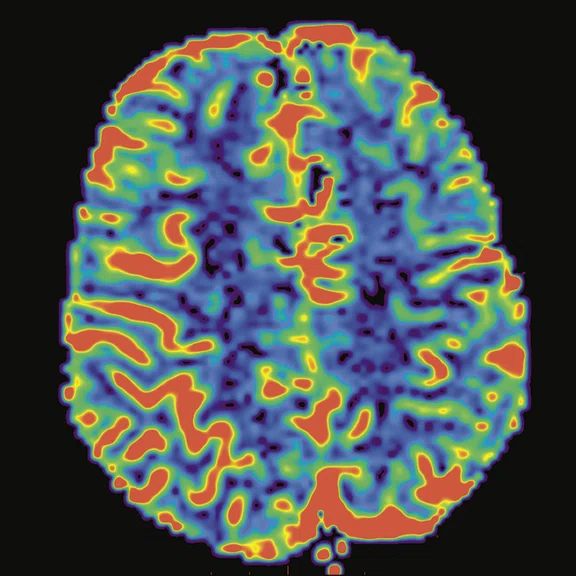
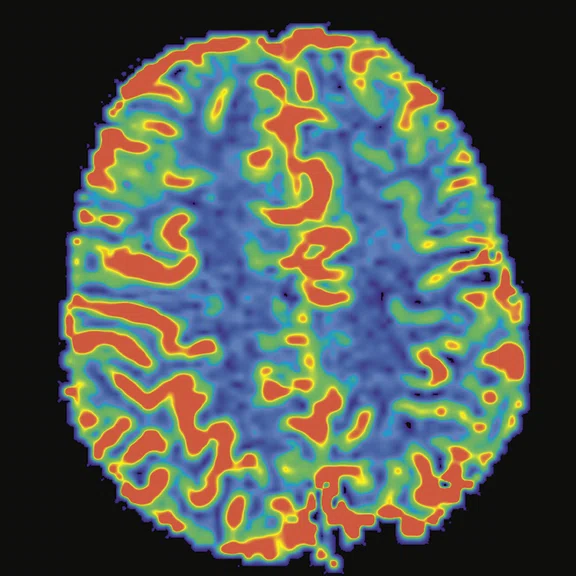
Cortical hyperperfusion on (A) CBF map from 3D ASL with an elevation in CBF within the diseased territories. (B) Non-quantitative axial rCBF map and (C) quantitative axial rCBF map from DSC GRE-EPI, post-processed with (B) BrainStat with gamma variate fitting (GVF) and (C) BrainStat with deconvolution of arterial input function (AIF). Better visualization of the hyperperfused cortical area can be seen in the post-processed (A) 3D ASL compared to (B, C) DSC.
B
Figure 3.
Cortical hyperperfusion on (A) CBF map from 3D ASL with an elevation in CBF within the diseased territories. (B) Non-quantitative axial rCBF map and (C) quantitative axial rCBF map from DSC GRE-EPI, post-processed with (B) BrainStat with gamma variate fitting (GVF) and (C) BrainStat with deconvolution of arterial input function (AIF). Better visualization of the hyperperfused cortical area can be seen in the post-processed (A) 3D ASL compared to (B, C) DSC.
C
Figure 3.
Cortical hyperperfusion on (A) CBF map from 3D ASL with an elevation in CBF within the diseased territories. (B) Non-quantitative axial rCBF map and (C) quantitative axial rCBF map from DSC GRE-EPI, post-processed with (B) BrainStat with gamma variate fitting (GVF) and (C) BrainStat with deconvolution of arterial input function (AIF). Better visualization of the hyperperfused cortical area can be seen in the post-processed (A) 3D ASL compared to (B, C) DSC.
A
Figure 4.
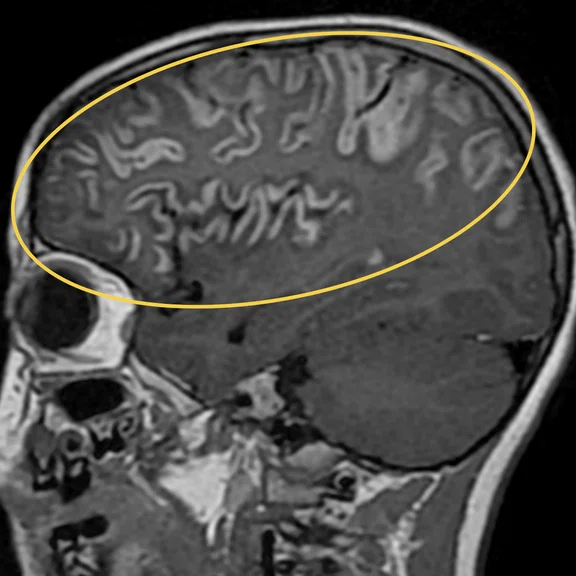
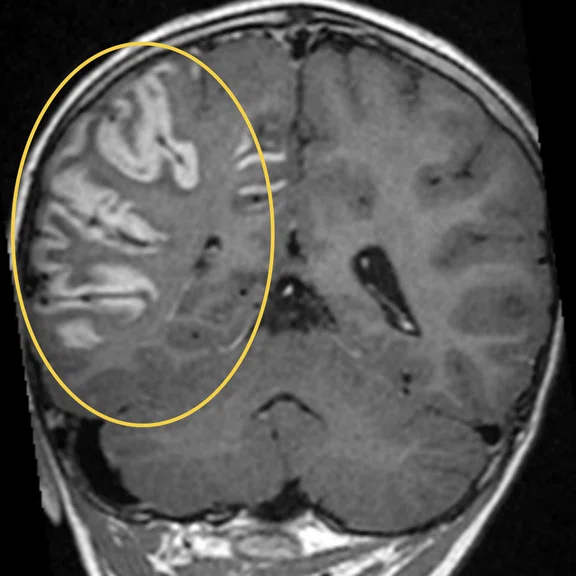
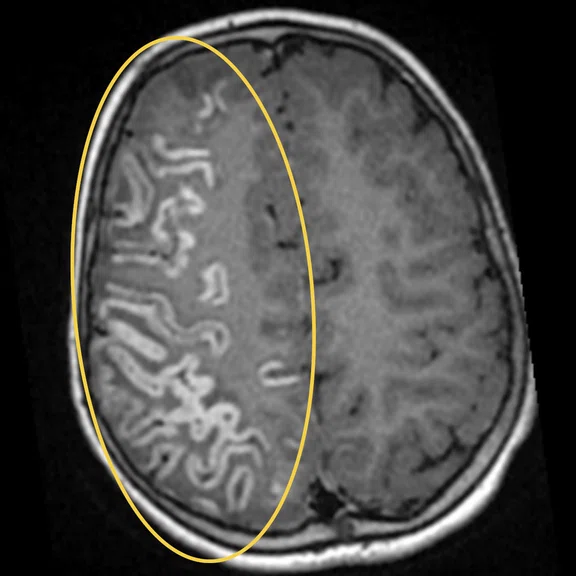
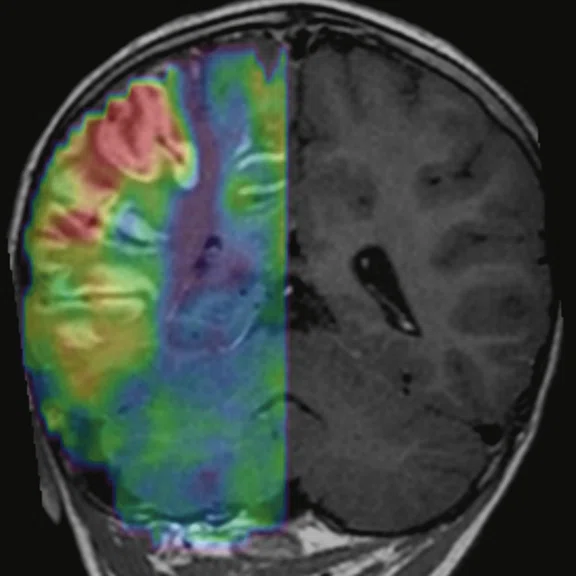
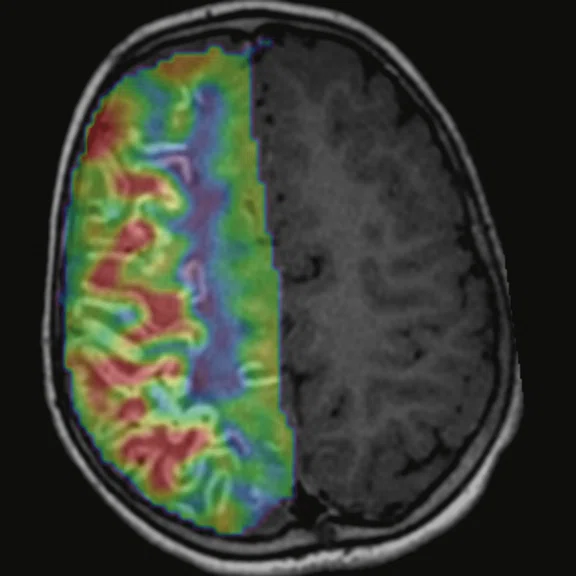
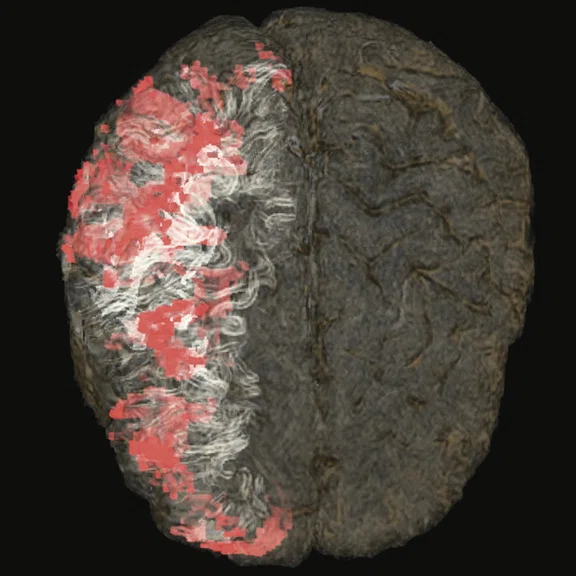
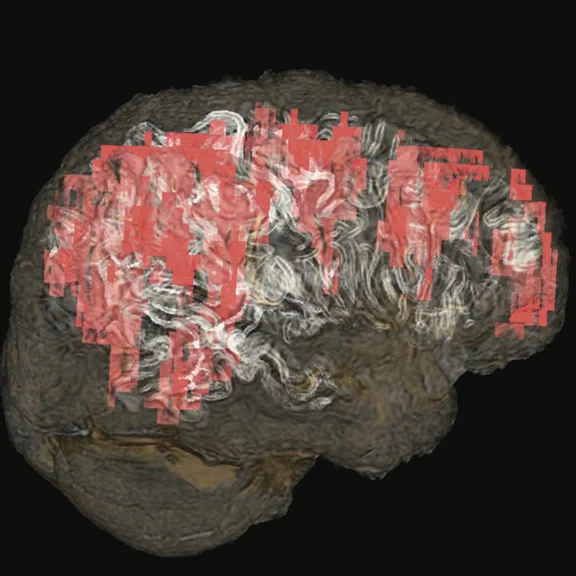
(A-C) Contrast uptake on T1 Cube showing an intense enhancement on right hemispheric cerebral cortex, which is wider than the hyperperfused territory on the CBF map derived from 3D ASL. (D, E) Fused T1 Cube post-contrast with CBF map from 3D ASL. (F, G) Volume- rendered, fused sagittal T1 Cube with CBF map from 3D ASL; contrast uptake shown in white and hyperperfusion in red.
B
Figure 4.
(A-C) Contrast uptake on T1 Cube showing an intense enhancement on right hemispheric cerebral cortex, which is wider than the hyperperfused territory on the CBF map derived from 3D ASL. (D, E) Fused T1 Cube post-contrast with CBF map from 3D ASL. (F, G) Volume- rendered, fused sagittal T1 Cube with CBF map from 3D ASL; contrast uptake shown in white and hyperperfusion in red.
C
Figure 4.
(A-C) Contrast uptake on T1 Cube showing an intense enhancement on right hemispheric cerebral cortex, which is wider than the hyperperfused territory on the CBF map derived from 3D ASL. (D, E) Fused T1 Cube post-contrast with CBF map from 3D ASL. (F, G) Volume- rendered, fused sagittal T1 Cube with CBF map from 3D ASL; contrast uptake shown in white and hyperperfusion in red.
D
Figure 4.
(A-C) Contrast uptake on T1 Cube showing an intense enhancement on right hemispheric cerebral cortex, which is wider than the hyperperfused territory on the CBF map derived from 3D ASL. (D, E) Fused T1 Cube post-contrast with CBF map from 3D ASL. (F, G) Volume- rendered, fused sagittal T1 Cube with CBF map from 3D ASL; contrast uptake shown in white and hyperperfusion in red.
E
Figure 4.
(A-C) Contrast uptake on T1 Cube showing an intense enhancement on right hemispheric cerebral cortex, which is wider than the hyperperfused territory on the CBF map derived from 3D ASL. (D, E) Fused T1 Cube post-contrast with CBF map from 3D ASL. (F, G) Volume- rendered, fused sagittal T1 Cube with CBF map from 3D ASL; contrast uptake shown in white and hyperperfusion in red.
F
Figure 4.
(A-C) Contrast uptake on T1 Cube showing an intense enhancement on right hemispheric cerebral cortex, which is wider than the hyperperfused territory on the CBF map derived from 3D ASL. (D, E) Fused T1 Cube post-contrast with CBF map from 3D ASL. (F, G) Volume- rendered, fused sagittal T1 Cube with CBF map from 3D ASL; contrast uptake shown in white and hyperperfusion in red.
G
Figure 4.
(A-C) Contrast uptake on T1 Cube showing an intense enhancement on right hemispheric cerebral cortex, which is wider than the hyperperfused territory on the CBF map derived from 3D ASL. (D, E) Fused T1 Cube post-contrast with CBF map from 3D ASL. (F, G) Volume- rendered, fused sagittal T1 Cube with CBF map from 3D ASL; contrast uptake shown in white and hyperperfusion in red.
result
PREVIOUS
${prev-page}
NEXT
${next-page}


Subscribe Now
Manage Subscription
FOLLOW US
contact us • privacy policy • terms & conditions
© 2023 GE HealthCare. GE is a trademark of the General Electric Company used under trademark license.


CASE STUDIES
The use of 3D ASL to diagnose Rasmussen’s encephalitis in pediatrics
The use of 3D ASL to diagnose Rasmussen’s encephalitis in pediatrics
by Zouhir Berrou, MD, radiologist, and Anissa Djeghri, RT(R), MR technologist, Centre d’imagerie médicale générale et pédiatrique de Gué de Constantine, Algiers, Algeria
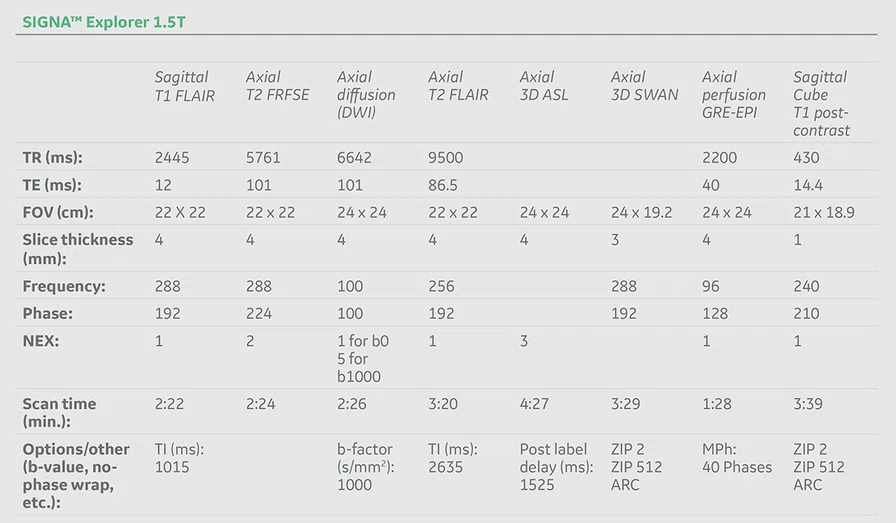
As a national pediatric referral center, our radiology department often receives complex cases, some with rare pathologies. In 2014, our first MR system was installed, a Brivo™ MR355 1.5T system, and it was upgraded in 2020 to a SIGNA™ Explorer 1.5T, which brought new features, sequences and applications to our MR imaging service. This includes functional imaging capabilities with 3D ASL, a non-contrast, needle-free method for quantifying cerebral blood flow (CBF).
Patient history
A four-year-old female with recent partial and acute left-sided epileptic crisis rapidly evolving and associated to a homolateral hemiparesis was referred to our center for an MR exam for brain anomalies. Patient has no history of a pathological condition. The patient had an increased number of crises leading to a status epilepticus, yet no biological or clinical infectious syndromes were found.
Results
- Hyperintense signal on T2 and T2 FLAIR on right hemispheric cerebral cortex predominant on fronto-parieto-insular region with an increased ADC value.
- Discrete anomaly of signal of subcortical white matter on parietal region on T2 FLAIR image.
- Cortical hyperperfusion on CBF map from the 3D ASL acquisition with an elevation of cerebral blood flow on diseased territories.
- Contrast uptake on T1 Cube showing an intense enhancement on the right hemispheric cerebral cortex, which is wider than the hyperperfused territory on the 3D ASL CBF map.
There was no significant loss of cerebral volume, no calcifications (particularly cortical ones) and no cerebral meningeal hemorrhage detected.
The right hemispheric infringement with cortical predominance on fronto-parieto-insular region with an intense contrast uptake enhancement and hyperperfusion (on 3D ASL) suggested several etiological diseases: Pial angioma (Sturge- Weber syndrome), MELAS syndrome, acute Rasmussen’s encephalitis or other autoimmune inflammatory diseases.
Six months later, the patient underwent a follow-up MR exam with the following results:
- Extension of the lesions to the temporal and insular regions
- Apparition of a marked infringement of subcortical white matter
- Progressive evolution into a cerebral atrophy
- No left hemispheric infringement.
These results, in addition to the clinical and electroencephalography criteria, suggested Rasmussen’s encephalitis as a final diagnosis.
Discussion
The endogenous perfusion technique with 3D ASL provides us with important information for pediatric neuroimaging. 3D ASL is easy to implement in comparison to other perfusion techniques in MR (Perfusion T2 or T2* weighted imaging) or even in other modalities. The technique is needle-free, so there is no need for a central venous catheter or contrast media injection. It can be used for patients with degraded renal function. The sequence can be repeated if needed due to motion artifacts, which often happens in pediatric imaging. With 3D ASL, we can obtain very good correlation with perfusion-weighted imaging or dynamic susceptibility contrast (DSC) imaging (Figure 3).
Figure 3.
Cortical hyperperfusion on (A) CBF map from 3D ASL with an elevation in CBF within the diseased territories. (B) Non-quantitative axial rCBF map and (C) quantitative axial rCBF map from DSC GRE-EPI, post-processed with (B) BrainStat with gamma variate fitting (GVF) and (C) BrainStat with deconvolution of arterial input function (AIF). Better visualization of the hyperperfused cortical area can be seen in the post-processed (A) 3D ASL compared to (B, C) DSC.
Figure 4.
(A-C) Contrast uptake on T1 Cube showing an intense enhancement on right hemispheric cerebral cortex, which is wider than the hyperperfused territory on the CBF map derived from 3D ASL. (D, E) Fused T1 Cube post-contrast with CBF map from 3D ASL. (F, G) Volume- rendered, fused sagittal T1 Cube with CBF map from 3D ASL; contrast uptake shown in white and hyperperfusion in red.
In our center, 3D ASL is systematically used and has become a pillar in our neuroimaging protocol for pediatrics, particularly for the following conditions:
- Hypoxic ischemic encephalopathy and vascular pathologies
- Tumoral, inflammatory and autoimmune (encephalitides) pathologies
- Epilepsy, especially when searching for a dysplastic site
- Complicated migraine.


