result
A
Figure 1.
Representative images of MP-RAGE in a normal brain using different HyperSense factors. Scan time reductions can be achieved without noticeable image blurring or decreased SNR, up to HyperSense factor of 1.3, as shown in this example. With HyperSense, (F) MP-RAGE images with an isotropic 0.8 mm voxel size can be acquired in under 5 min. and with a shorter scan time compared to (A) an acquisition with an isotropic 1 mm3 isotropic voxel size without HyperSense. (A) Without HyperSense, 1 mm3, 6:06 min.; (B) HyperSense factor 1.0, 1 mm3, 4:32 min.; (C) HyperSense factor 1.1, 1 mm3, 4:05 min.; (D) HyperSense factor 1.2, 1 mm3, 3:45 min.; (E) HyperSense factor 1.3, 1 mm3, 3:26 min.; (F) HyperSense factor 1.3, 0.8 mm3, 4:58 min.
B
Figure 1.
Representative images of MP-RAGE in a normal brain using different HyperSense factors. Scan time reductions can be achieved without noticeable image blurring or decreased SNR, up to HyperSense factor of 1.3, as shown in this example. With HyperSense, (F) MP-RAGE images with an isotropic 0.8 mm voxel size can be acquired in under 5 min. and with a shorter scan time compared to (A) an acquisition with an isotropic 1 mm3 isotropic voxel size without HyperSense. (A) Without HyperSense, 1 mm3, 6:06 min.; (B) HyperSense factor 1.0, 1 mm3, 4:32 min.; (C) HyperSense factor 1.1, 1 mm3, 4:05 min.; (D) HyperSense factor 1.2, 1 mm3, 3:45 min.; (E) HyperSense factor 1.3, 1 mm3, 3:26 min.; (F) HyperSense factor 1.3, 0.8 mm3, 4:58 min.
C
Figure 1.
Representative images of MP-RAGE in a normal brain using different HyperSense factors. Scan time reductions can be achieved without noticeable image blurring or decreased SNR, up to HyperSense factor of 1.3, as shown in this example. With HyperSense, (F) MP-RAGE images with an isotropic 0.8 mm voxel size can be acquired in under 5 min. and with a shorter scan time compared to (A) an acquisition with an isotropic 1 mm3 isotropic voxel size without HyperSense. (A) Without HyperSense, 1 mm3, 6:06 min.; (B) HyperSense factor 1.0, 1 mm3, 4:32 min.; (C) HyperSense factor 1.1, 1 mm3, 4:05 min.; (D) HyperSense factor 1.2, 1 mm3, 3:45 min.; (E) HyperSense factor 1.3, 1 mm3, 3:26 min.; (F) HyperSense factor 1.3, 0.8 mm3, 4:58 min.
D
Figure 1.
Representative images of MP-RAGE in a normal brain using different HyperSense factors. Scan time reductions can be achieved without noticeable image blurring or decreased SNR, up to HyperSense factor of 1.3, as shown in this example. With HyperSense, (F) MP-RAGE images with an isotropic 0.8 mm voxel size can be acquired in under 5 min. and with a shorter scan time compared to (A) an acquisition with an isotropic 1 mm3 isotropic voxel size without HyperSense. (A) Without HyperSense, 1 mm3, 6:06 min.; (B) HyperSense factor 1.0, 1 mm3, 4:32 min.; (C) HyperSense factor 1.1, 1 mm3, 4:05 min.; (D) HyperSense factor 1.2, 1 mm3, 3:45 min.; (E) HyperSense factor 1.3, 1 mm3, 3:26 min.; (F) HyperSense factor 1.3, 0.8 mm3, 4:58 min.
E
Figure 1.
Representative images of MP-RAGE in a normal brain using different HyperSense factors. Scan time reductions can be achieved without noticeable image blurring or decreased SNR, up to HyperSense factor of 1.3, as shown in this example. With HyperSense, (F) MP-RAGE images with an isotropic 0.8 mm voxel size can be acquired in under 5 min. and with a shorter scan time compared to (A) an acquisition with an isotropic 1 mm3 isotropic voxel size without HyperSense. (A) Without HyperSense, 1 mm3, 6:06 min.; (B) HyperSense factor 1.0, 1 mm3, 4:32 min.; (C) HyperSense factor 1.1, 1 mm3, 4:05 min.; (D) HyperSense factor 1.2, 1 mm3, 3:45 min.; (E) HyperSense factor 1.3, 1 mm3, 3:26 min.; (F) HyperSense factor 1.3, 0.8 mm3, 4:58 min.
F
Figure 1.
Representative images of MP-RAGE in a normal brain using different HyperSense factors. Scan time reductions can be achieved without noticeable image blurring or decreased SNR, up to HyperSense factor of 1.3, as shown in this example. With HyperSense, (F) MP-RAGE images with an isotropic 0.8 mm voxel size can be acquired in under 5 min. and with a shorter scan time compared to (A) an acquisition with an isotropic 1 mm3 isotropic voxel size without HyperSense. (A) Without HyperSense, 1 mm3, 6:06 min.; (B) HyperSense factor 1.0, 1 mm3, 4:32 min.; (C) HyperSense factor 1.1, 1 mm3, 4:05 min.; (D) HyperSense factor 1.2, 1 mm3, 3:45 min.; (E) HyperSense factor 1.3, 1 mm3, 3:26 min.; (F) HyperSense factor 1.3, 0.8 mm3, 4:58 min.
1. Haider CR, Hu HH, Campeau NG, Huston J 3rd, Riederer SJ. 3D high temporal and spatial resolution contrast-enhanced MR angiography of the whole brain. Magn Reson Med. 2008;60(3):749-760.
A
Figure 2.
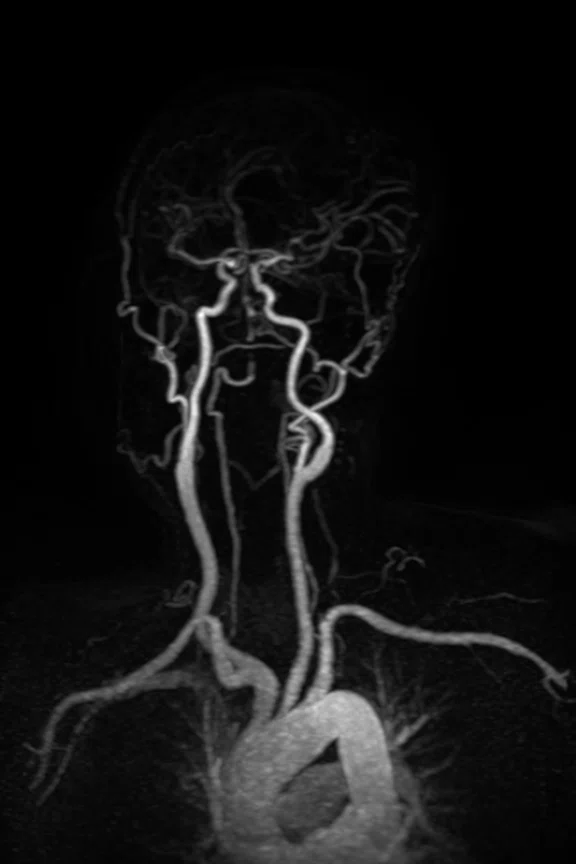
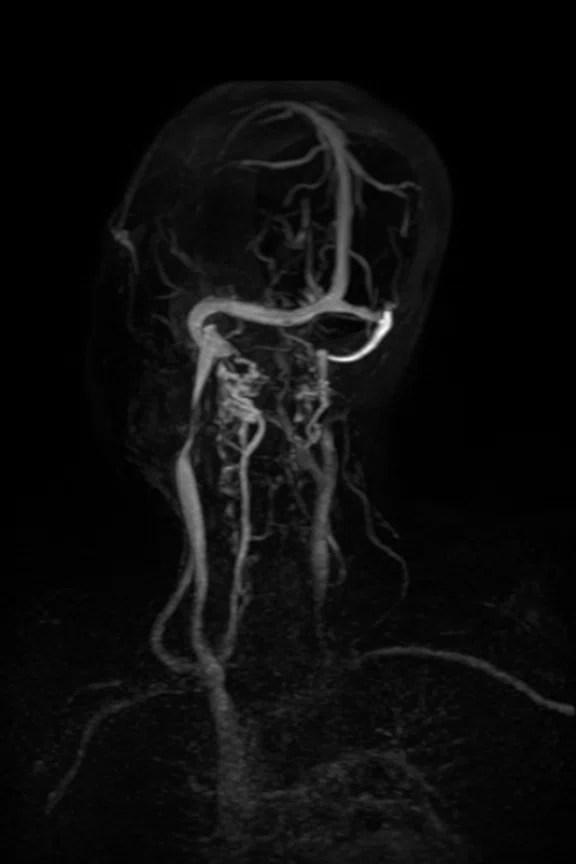
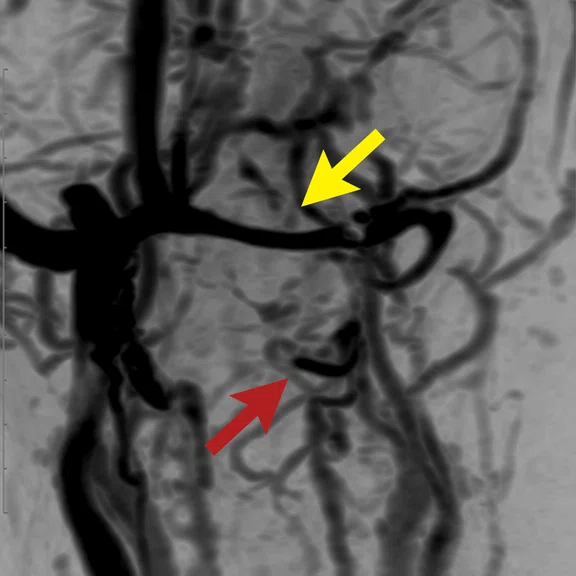
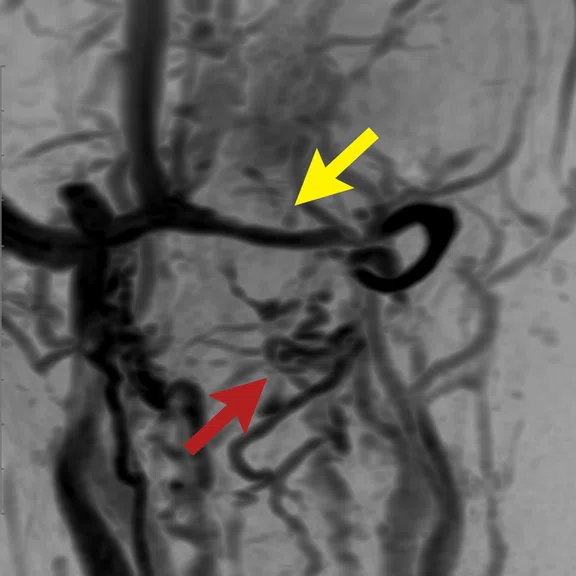
Time resolved dynamic contrast-enhanced MRA in head and neck using DISCO with HyperSense. With a more flexible setup of DISCO and additional acceleration using HyperSense, a shorter temporal resolution and temporal footprint can be achieved compared to TRICKS, resulting in (A) arterial and (B) venous phase images with better temporal resolution. Acquisition voxel was 1.3 x 1.7 x 1.2 mm, ARC 3 x 2, HyperSense factor of 1.5.
B
Figure 2.
Time resolved dynamic contrast-enhanced MRA in head and neck using DISCO with HyperSense. With a more flexible setup of DISCO and additional acceleration using HyperSense, a shorter temporal resolution and temporal footprint can be achieved compared to TRICKS, resulting in (A) arterial and (B) venous phase images with better temporal resolution. Acquisition voxel was 1.3 x 1.7 x 1.2 mm, ARC 3 x 2, HyperSense factor of 1.5.
A
Figure 3.
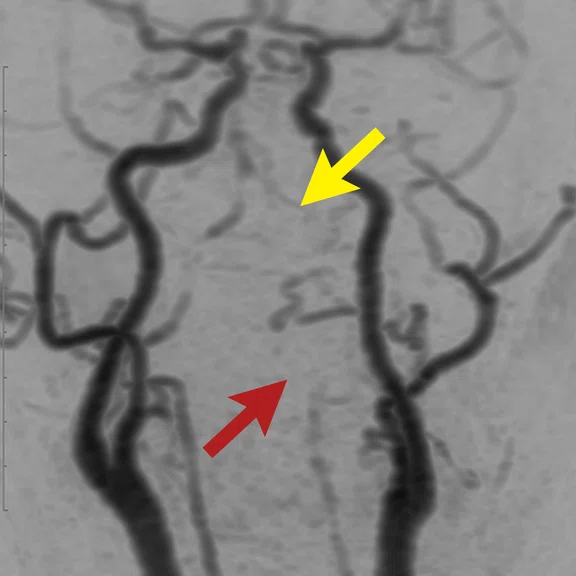
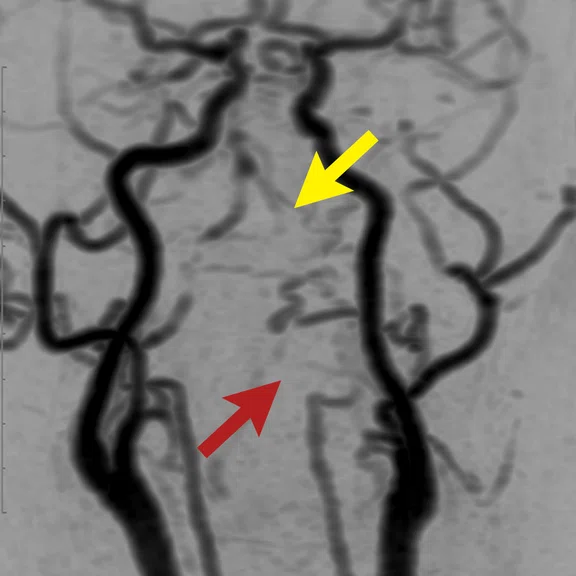
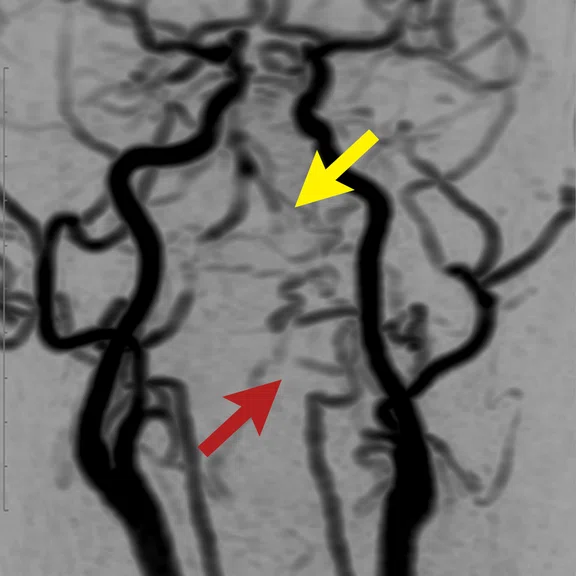
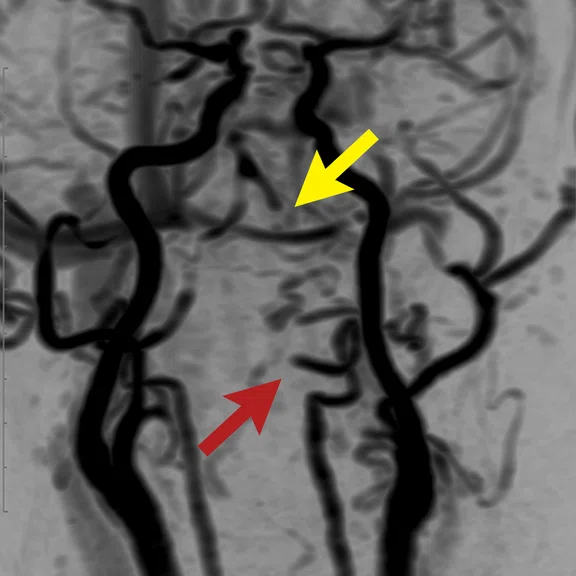
In a patient with left V4 occlusion, the dynamic passage is well depicted in these images (cropped) acquired with a temporal resolution of 1.8 sec. and temporal footprint of 6 sec., which would have been 2.5 sec. and 8 sec., respectively, without HyperSense. Acquisition voxel size was 1.3 x 1.7 x 1.2 mm, ARC 3 x 2, HyperSense factor of 1.5.
B
Figure 3.
In a patient with left V4 occlusion, the dynamic passage is well depicted in these images (cropped) acquired with a temporal resolution of 1.8 sec. and temporal footprint of 6 sec., which would have been 2.5 sec. and 8 sec., respectively, without HyperSense. Acquisition voxel size was 1.3 x 1.7 x 1.2 mm, ARC 3 x 2, HyperSense factor of 1.5.
C
Figure 3.
In a patient with left V4 occlusion, the dynamic passage is well depicted in these images (cropped) acquired with a temporal resolution of 1.8 sec. and temporal footprint of 6 sec., which would have been 2.5 sec. and 8 sec., respectively, without HyperSense. Acquisition voxel size was 1.3 x 1.7 x 1.2 mm, ARC 3 x 2, HyperSense factor of 1.5.
D
Figure 3.
In a patient with left V4 occlusion, the dynamic passage is well depicted in these images (cropped) acquired with a temporal resolution of 1.8 sec. and temporal footprint of 6 sec., which would have been 2.5 sec. and 8 sec., respectively, without HyperSense. Acquisition voxel size was 1.3 x 1.7 x 1.2 mm, ARC 3 x 2, HyperSense factor of 1.5.
E
Figure 3.
In a patient with left V4 occlusion, the dynamic passage is well depicted in these images (cropped) acquired with a temporal resolution of 1.8 sec. and temporal footprint of 6 sec., which would have been 2.5 sec. and 8 sec., respectively, without HyperSense. Acquisition voxel size was 1.3 x 1.7 x 1.2 mm, ARC 3 x 2, HyperSense factor of 1.5.
F
Figure 3.
In a patient with left V4 occlusion, the dynamic passage is well depicted in these images (cropped) acquired with a temporal resolution of 1.8 sec. and temporal footprint of 6 sec., which would have been 2.5 sec. and 8 sec., respectively, without HyperSense. Acquisition voxel size was 1.3 x 1.7 x 1.2 mm, ARC 3 x 2, HyperSense factor of 1.5.
A
Figure 4.
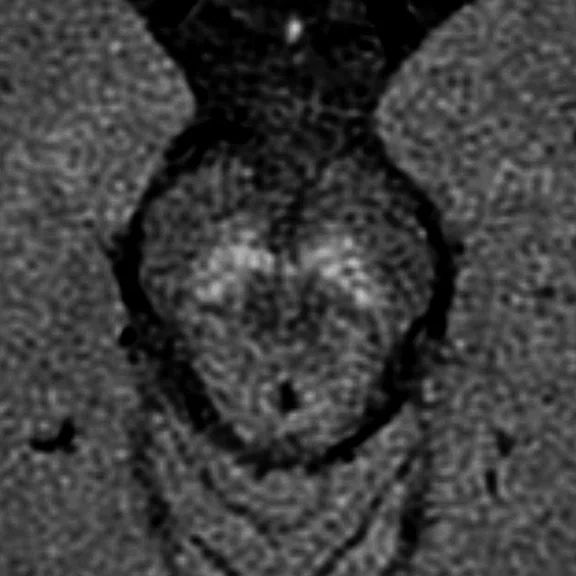
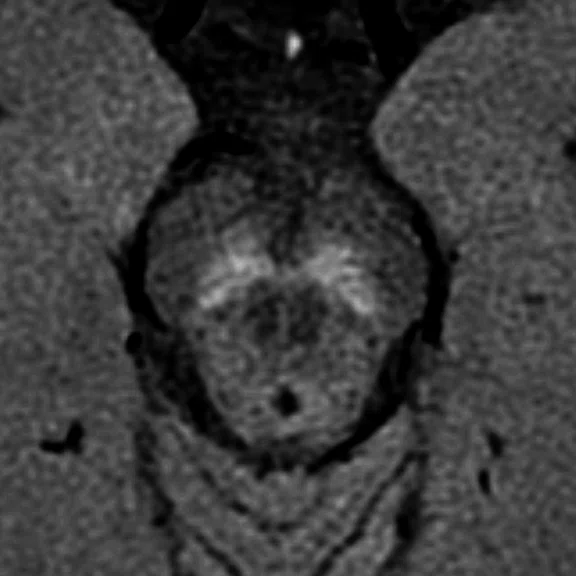
Improved SNR with AIR™ Recon DL. (A-D) Oblique axial T1-weighted fast spin echo images for neuromelanin imaging with 2 mm section thickness, obtained from a healthy volunteer. (A) Conventional image reconstruction (2 NEX); (B) average of 2 acquisitions (2 NEX + 2 NEX); AIR™ Recon DL image reconstruction with (C) medium and (D) high setting. Images reconstructed with AIR™ Recon DL show better SNR with half the scan time compared to (B) the averaged images and (A) the conventional reconstruction method.
B
Figure 4.
Improved SNR with AIR™ Recon DL. (A-D) Oblique axial T1-weighted fast spin echo images for neuromelanin imaging with 2 mm section thickness, obtained from a healthy volunteer. (A) Conventional image reconstruction (2 NEX); (B) average of 2 acquisitions (2 NEX + 2 NEX); AIR™ Recon DL image reconstruction with (C) medium and (D) high setting. Images reconstructed with AIR™ Recon DL show better SNR with half the scan time compared to (B) the averaged images and (A) the conventional reconstruction method.
C
Figure 4.
Improved SNR with AIR™ Recon DL. (A-D) Oblique axial T1-weighted fast spin echo images for neuromelanin imaging with 2 mm section thickness, obtained from a healthy volunteer. (A) Conventional image reconstruction (2 NEX); (B) average of 2 acquisitions (2 NEX + 2 NEX); AIR™ Recon DL image reconstruction with (C) medium and (D) high setting. Images reconstructed with AIR™ Recon DL show better SNR with half the scan time compared to (B) the averaged images and (A) the conventional reconstruction method.
D
Figure 4.
Improved SNR with AIR™ Recon DL. (A-D) Oblique axial T1-weighted fast spin echo images for neuromelanin imaging with 2 mm section thickness, obtained from a healthy volunteer. (A) Conventional image reconstruction (2 NEX); (B) average of 2 acquisitions (2 NEX + 2 NEX); AIR™ Recon DL image reconstruction with (C) medium and (D) high setting. Images reconstructed with AIR™ Recon DL show better SNR with half the scan time compared to (B) the averaged images and (A) the conventional reconstruction method.
A
Figure 5.
Coronal SS frFSE T2w images of a 34-year- old patient with active Crohn’s disease. (B, C) The AIR™ Recon DL reconstructed images show a reduction in background noise and a sharper margin of bowel wall and vascularity. (A) Conventional image; (B) AIR™ Recon DL reconstructed image using the high setting, 1.0 x 1.2 x 4 mm, 1 breath-hold, 58 sec.; and (C) AIR™ Recon DL reconstructed image using the high setting and original image, 1.2 x 1.7 x 4 mm, 1 breath-hold, 18 sec. (B, C) Despite 69% scan time reduction, there is no significant difference in image quality between (B) and (C).
B
Figure 5.
Coronal SS frFSE T2w images of a 34-year- old patient with active Crohn’s disease. (B, C) The AIR™ Recon DL reconstructed images show a reduction in background noise and a sharper margin of bowel wall and vascularity. (A) Conventional image; (B) AIR™ Recon DL reconstructed image using the high setting, 1.0 x 1.2 x 4 mm, 1 breath-hold, 58 sec.; and (C) AIR™ Recon DL reconstructed image using the high setting and original image, 1.2 x 1.7 x 4 mm, 1 breath-hold, 18 sec. (B, C) Despite 69% scan time reduction, there is no significant difference in image quality between (B) and (C).
C
Figure 5.
Coronal SS frFSE T2w images of a 34-year- old patient with active Crohn’s disease. (B, C) The AIR™ Recon DL reconstructed images show a reduction in background noise and a sharper margin of bowel wall and vascularity. (A) Conventional image; (B) AIR™ Recon DL reconstructed image using the high setting, 1.0 x 1.2 x 4 mm, 1 breath-hold, 58 sec.; and (C) AIR™ Recon DL reconstructed image using the high setting and original image, 1.2 x 1.7 x 4 mm, 1 breath-hold, 18 sec. (B, C) Despite 69% scan time reduction, there is no significant difference in image quality between (B) and (C).
A
Figure 6.
Dynamic contrast-enhanced T1w images of a 34-year-old patient with active Crohn’s disease. Images were obtained using LAVA HyperSense, 1.3 x 1.2 x 1.6 mm, HyperSense factor 1.2, 16 sec. of temporal resolution. (A-C) Coronal pre, arterial and venous images and (D-F) axial pre, arterial and venous images reformatted from each coronal image resulting in 2 mm slice thickness. With 3D near-isotropic LAVA and HyperSense, we can evaluate active inflammation in the axial images of the same phases with the coronal images, which is helpful for increasing diagnostic confidence.
B
Figure 6.
Dynamic contrast-enhanced T1w images of a 34-year-old patient with active Crohn’s disease. Images were obtained using LAVA HyperSense, 1.3 x 1.2 x 1.6 mm, HyperSense factor 1.2, 16 sec. of temporal resolution. (A-C) Coronal pre, arterial and venous images and (D-F) axial pre, arterial and venous images reformatted from each coronal image resulting in 2 mm slice thickness. With 3D near-isotropic LAVA and HyperSense, we can evaluate active inflammation in the axial images of the same phases with the coronal images, which is helpful for increasing diagnostic confidence.
C
Figure 6.
Dynamic contrast-enhanced T1w images of a 34-year-old patient with active Crohn’s disease. Images were obtained using LAVA HyperSense, 1.3 x 1.2 x 1.6 mm, HyperSense factor 1.2, 16 sec. of temporal resolution. (A-C) Coronal pre, arterial and venous images and (D-F) axial pre, arterial and venous images reformatted from each coronal image resulting in 2 mm slice thickness. With 3D near-isotropic LAVA and HyperSense, we can evaluate active inflammation in the axial images of the same phases with the coronal images, which is helpful for increasing diagnostic confidence.
D
Figure 6.
Dynamic contrast-enhanced T1w images of a 34-year-old patient with active Crohn’s disease. Images were obtained using LAVA HyperSense, 1.3 x 1.2 x 1.6 mm, HyperSense factor 1.2, 16 sec. of temporal resolution. (A-C) Coronal pre, arterial and venous images and (D-F) axial pre, arterial and venous images reformatted from each coronal image resulting in 2 mm slice thickness. With 3D near-isotropic LAVA and HyperSense, we can evaluate active inflammation in the axial images of the same phases with the coronal images, which is helpful for increasing diagnostic confidence.
E
Figure 6.
Dynamic contrast-enhanced T1w images of a 34-year-old patient with active Crohn’s disease. Images were obtained using LAVA HyperSense, 1.3 x 1.2 x 1.6 mm, HyperSense factor 1.2, 16 sec. of temporal resolution. (A-C) Coronal pre, arterial and venous images and (D-F) axial pre, arterial and venous images reformatted from each coronal image resulting in 2 mm slice thickness. With 3D near-isotropic LAVA and HyperSense, we can evaluate active inflammation in the axial images of the same phases with the coronal images, which is helpful for increasing diagnostic confidence.
F
Figure 6.
Dynamic contrast-enhanced T1w images of a 34-year-old patient with active Crohn’s disease. Images were obtained using LAVA HyperSense, 1.3 x 1.2 x 1.6 mm, HyperSense factor 1.2, 16 sec. of temporal resolution. (A-C) Coronal pre, arterial and venous images and (D-F) axial pre, arterial and venous images reformatted from each coronal image resulting in 2 mm slice thickness. With 3D near-isotropic LAVA and HyperSense, we can evaluate active inflammation in the axial images of the same phases with the coronal images, which is helpful for increasing diagnostic confidence.
A
Figure 7.
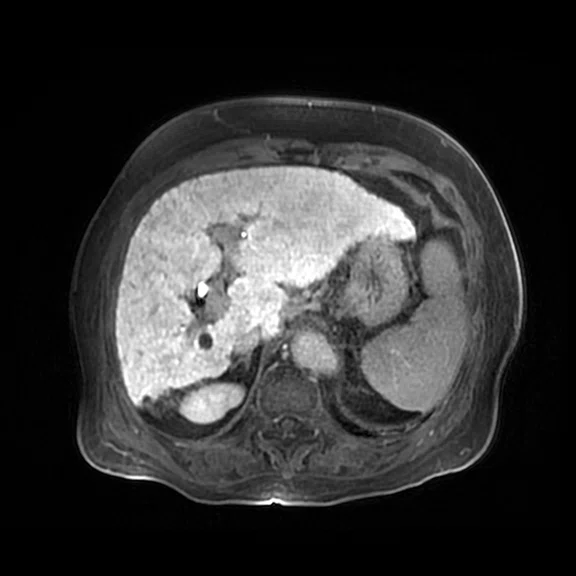
Dynamic contrast-enhanced T1w images using LAVA, 1.2 x 1.2 x 1.7 mm, of a 72-year-old patient with primary biliary cirrhosis. Hepatobiliary phase image obtained after contrast-enhanced dynamic MR for lesion detection and characterization of the liver. (A, C) Without HyperSense, 16 sec. and (B, D) with HyperSense factor 1.5, 11 sec. By using HyperSense, we can obtain images with reduced artifact due to respiratory motion in a much shorter time, which is helpful for patients who can’t hold their breath.
B
Figure 7.
Dynamic contrast-enhanced T1w images using LAVA, 1.2 x 1.2 x 1.7 mm, of a 72-year-old patient with primary biliary cirrhosis. Hepatobiliary phase image obtained after contrast-enhanced dynamic MR for lesion detection and characterization of the liver. (A, C) Without HyperSense, 16 sec. and (B, D) with HyperSense factor 1.5, 11 sec. By using HyperSense, we can obtain images with reduced artifact due to respiratory motion in a much shorter time, which is helpful for patients who can’t hold their breath.
C
Figure 7.
Dynamic contrast-enhanced T1w images using LAVA, 1.2 x 1.2 x 1.7 mm, of a 72-year-old patient with primary biliary cirrhosis. Hepatobiliary phase image obtained after contrast-enhanced dynamic MR for lesion detection and characterization of the liver. (A, C) Without HyperSense, 16 sec. and (B, D) with HyperSense factor 1.5, 11 sec. By using HyperSense, we can obtain images with reduced artifact due to respiratory motion in a much shorter time, which is helpful for patients who can’t hold their breath.
D
Figure 7.
Dynamic contrast-enhanced T1w images using LAVA, 1.2 x 1.2 x 1.7 mm, of a 72-year-old patient with primary biliary cirrhosis. Hepatobiliary phase image obtained after contrast-enhanced dynamic MR for lesion detection and characterization of the liver. (A, C) Without HyperSense, 16 sec. and (B, D) with HyperSense factor 1.5, 11 sec. By using HyperSense, we can obtain images with reduced artifact due to respiratory motion in a much shorter time, which is helpful for patients who can’t hold their breath.
A
Figure 8.
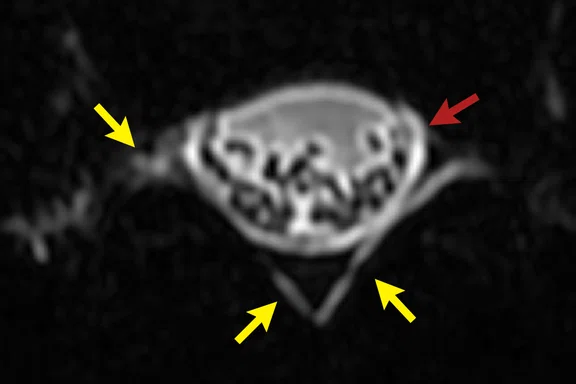
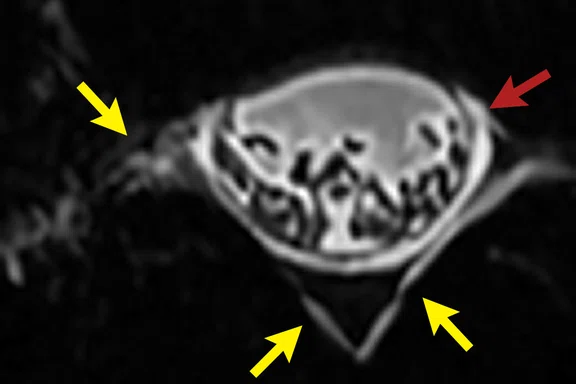
Improved sharpness with AIR™ Recon DL for myelography exams. (A, B) Axial SS frFSE, heavily T2w with fat suppression, 0.6 x 0.8 x 6 mm, 1:26 min. (A) Conventional and (B) AIR™ Recon DL reconstruction using medium level more sharply demonstrates the dura mater (red arrows), nerve structures with extradural fluid collection and perineural fluid extension (yellow arrows).
B
Figure 8.
Improved sharpness with AIR™ Recon DL for myelography exams. (A, B) Axial SS frFSE, heavily T2w with fat suppression, 0.6 x 0.8 x 6 mm, 1:26 min. (A) Conventional and (B) AIR™ Recon DL reconstruction using medium level more sharply demonstrates the dura mater (red arrows), nerve structures with extradural fluid collection and perineural fluid extension (yellow arrows).
A
Figure 9.
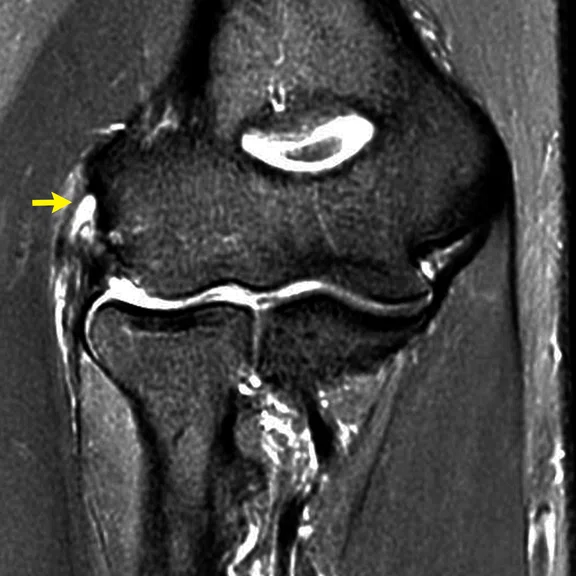
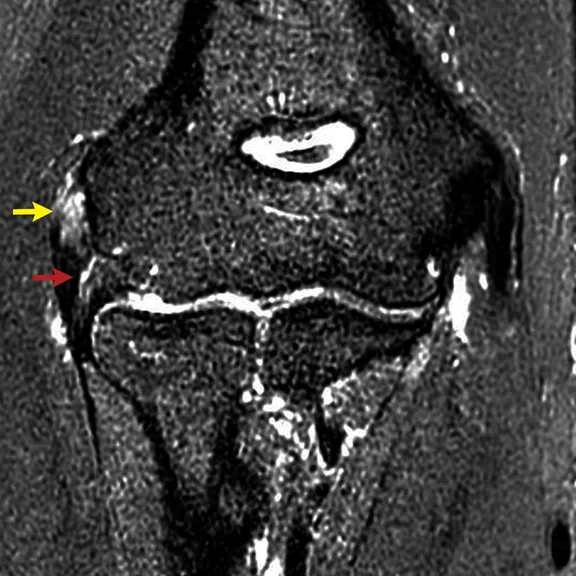
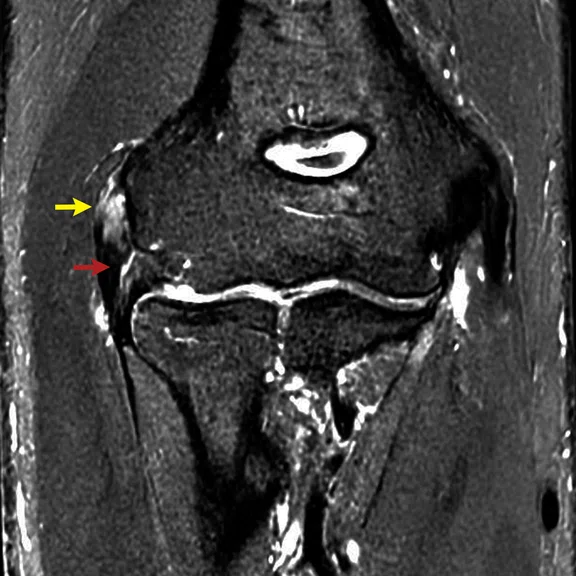
Coronal frFSE T2w with fat suppression of the right elbow joint. (A) Conventional image, 0.4 x 0.5 x 3 mm, 2:40 min., the tear of proximal common extensor tendon (CET) is visible (yellow arrow) and radial collateral ligament (RCL) is not remarkable. (B) Image reconstruction without AIR™ Recon DL and (C) with AIR™ Recon DL with medium level of the same raw data, 0.4 x 0.6 x 1 mm, 4:47 min., the tear of proximal CET is also seen (yellow arrows). Additionally, the tear of proximal RCL is seen (red arrows). AIR™ Recon DL helps for better denoising in small structures, as shown in (C) with higher SNR than (B).
B
Figure 9.
Coronal frFSE T2w with fat suppression of the right elbow joint. (A) Conventional image, 0.4 x 0.5 x 3 mm, 2:40 min., the tear of proximal common extensor tendon (CET) is visible (yellow arrow) and radial collateral ligament (RCL) is not remarkable. (B) Image reconstruction without AIR™ Recon DL and (C) with AIR™ Recon DL with medium level of the same raw data, 0.4 x 0.6 x 1 mm, 4:47 min., the tear of proximal CET is also seen (yellow arrows). Additionally, the tear of proximal RCL is seen (red arrows). AIR™ Recon DL helps for better denoising in small structures, as shown in (C) with higher SNR than (B).
C
Figure 9.
Coronal frFSE T2w with fat suppression of the right elbow joint. (A) Conventional image, 0.4 x 0.5 x 3 mm, 2:40 min., the tear of proximal common extensor tendon (CET) is visible (yellow arrow) and radial collateral ligament (RCL) is not remarkable. (B) Image reconstruction without AIR™ Recon DL and (C) with AIR™ Recon DL with medium level of the same raw data, 0.4 x 0.6 x 1 mm, 4:47 min., the tear of proximal CET is also seen (yellow arrows). Additionally, the tear of proximal RCL is seen (red arrows). AIR™ Recon DL helps for better denoising in small structures, as shown in (C) with higher SNR than (B).
A
Figure 10.
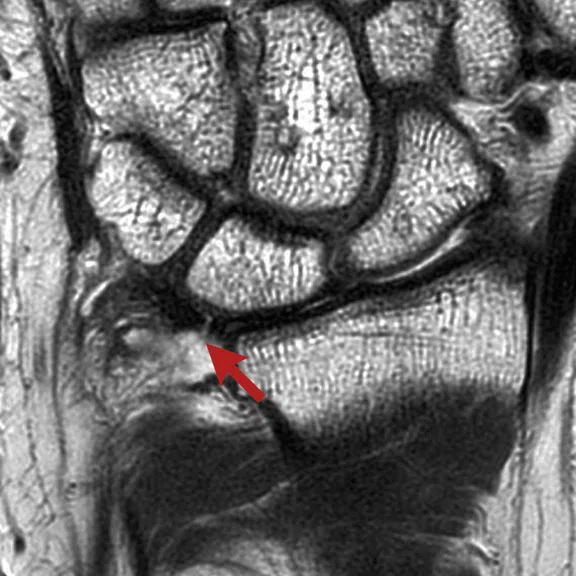
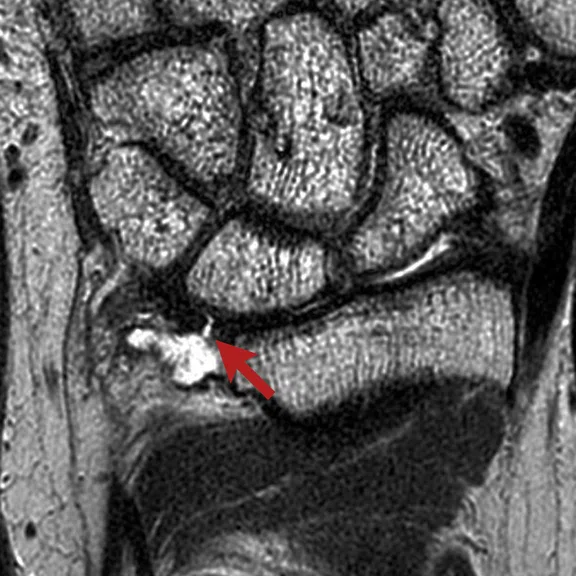
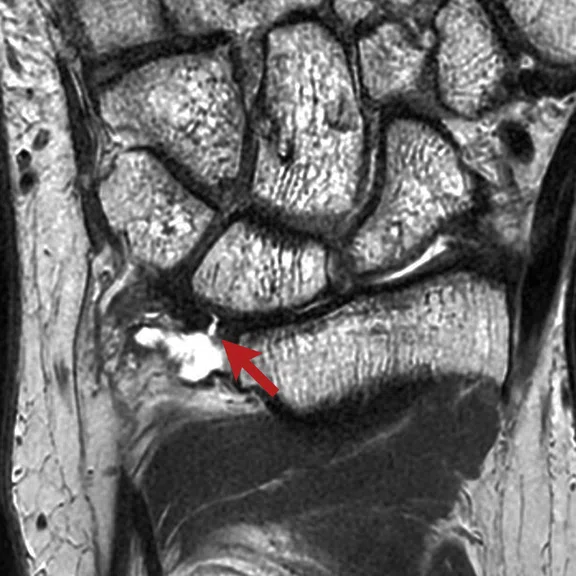
Coronal frFSE T2w of the right wrist joint. (A) Conventional reconstruction image, 0.3 x 0.4 x 2 mm, 2:03 min., the central tear of triangular fibrocartilage complex (TFCC) is suspected (red arrows). (B) Image reconstruction without AIR™ Recon DL and (C) with AIR™ Recon DL with medium level image, 0.4 x 0.4 x 1 mm, 3:06 min., the central tear of TFCC is diagnosed with certainty (red arrows). AIR™ Recon DL helps for better denoising small structures such as the wrist as shown in (C) with high SNR compared to (B).
B
Figure 10.
Coronal frFSE T2w of the right wrist joint. (A) Conventional reconstruction image, 0.3 x 0.4 x 2 mm, 2:03 min., the central tear of triangular fibrocartilage complex (TFCC) is suspected (red arrows). (B) Image reconstruction without AIR™ Recon DL and (C) with AIR™ Recon DL with medium level image, 0.4 x 0.4 x 1 mm, 3:06 min., the central tear of TFCC is diagnosed with certainty (red arrows). AIR™ Recon DL helps for better denoising small structures such as the wrist as shown in (C) with high SNR compared to (B).
C
Figure 10.
Coronal frFSE T2w of the right wrist joint. (A) Conventional reconstruction image, 0.3 x 0.4 x 2 mm, 2:03 min., the central tear of triangular fibrocartilage complex (TFCC) is suspected (red arrows). (B) Image reconstruction without AIR™ Recon DL and (C) with AIR™ Recon DL with medium level image, 0.4 x 0.4 x 1 mm, 3:06 min., the central tear of TFCC is diagnosed with certainty (red arrows). AIR™ Recon DL helps for better denoising small structures such as the wrist as shown in (C) with high SNR compared to (B).


PREVIOUS
${prev-page}
NEXT
${next-page}
Subscribe Now
Manage Subscription
FOLLOW US
Contact Us • Cookie Preferences • Privacy Policy • California Privacy PolicyDo Not Sell or Share My Personal Information • Terms & Conditions • Security
© 2024 GE HealthCare. GE is a trademark of General Electric Company. Used under trademark license.
SPOTLIGHT
Clinical applications of MR with AIR Recon DL and HyperSense
Clinical applications of MR with AIR Recon DL and HyperSense
by Ho-Joon Lee, MD, Yedaun Lee, MD, Jisook Yi, MD, and Seok Hahn, MD, Department of Radiology, Inje University Haeundae Paik Hospital, Busan, Republic of Korea
Advancements in MR imaging technology, such as AIR™ Recon DL and HyperSense, are enabling shorter scan times and higher SNR, extending the benefits of MR imaging to more patients across a broad array of indications.
Advancements in MR imaging technology, such as AIR™ Recon DL and HyperSense, are enabling shorter scan times and higher SNR, extending the benefits of MR imaging to more patients across a broad array of indications.
The quality of MR images has improved as a result of rapid improvements to image processing technology. However, scan times remain significantly longer compared to other imaging systems, limiting its widespread use. For example, a CT exam generally lasts about 5-10 minutes, while an MR can take anywhere from 30 minutes to 1 hour.
Some patients become uncomfortable laying still for long periods of time in a confined space. In particular, elderly and claustrophobic patients may often have to undergo an MR rescan due to motion artifacts that deteriorate the image quality and make the study difficult for a radiologist to interpret.
Therefore, a shorter scan time that does not reduce image quality is required. An aging population coupled with health coverage changes in the Republic of Korea are further highlighting this clinical need. Recently, as the cost of MR scans in Korea is supported by the national health insurance, the number of patients has increased, leading to access issues and an increase in the time patients must for wait for this exam.
By using either AIR™ Recon DL or HyperSense, MR exams can now be obtained with a shorter scan time, reducing rescans. In particular, the deep-learning-based reconstruction algorithm, AIR™ Recon DL, can reduce scan time by more than twice and also improve SNR and resolution.
This shorter total scan time enables the scheduling of more patients per day. The high resolution and increased SNR in the images help the radiologist in image interpretation.
In addition, 3D MR sequences typically have a longer scan time than 2D MR sequences. Applying HyperSense is another way to reduce scan time, leading to a more efficient protocol without changing image quality.
Neuroimaging
The advantages of reduced scan times are particularly useful when using advanced neuro sequences such as MP-RAGE. Previously, the scan time was relatively long, which limited its routine clinical use. With HyperSense, the scan time is markedly reduced to a more patient-comfortable range without noticeable deteriorations in image quality. It is also possible to increase spatial resolution within an acceptable scan time (Figure 1). With minimal investment in additional scan time, PROMO can be combined to increase robustness in a patient population that often has frequent motion.
A
B
C
D
E
F
Figure 1.
Representative images of MP-RAGE in a normal brain using different HyperSense factors. Scan time reductions can be achieved without noticeable image blurring or decreased SNR, up to HyperSense factor of 1.3, as shown in this example. With HyperSense, (F) MP-RAGE images with a isotropic 0.8 mm voxel size can be acquired in under 5 min. and with a shorter scan time compared to (A) an acquisition with a isotropic 1 mm3 isotropic voxel size without HyperSense. (A) Without HyperSense, 1 mm3, 6:06 min.; (B) HyperSense factor 1.0, 1 mm3, 4:32 min.; (C) HyperSense factor 1.1, 1 mm3, 4:05 min.; (D) HyperSense factor 1.2, 1 mm3, 3:45 min.; (E) HyperSense factor 1.3, 1 mm3, 3:26 min.; (F) HyperSense factor 1.3, 0.8 mm3, 4:58 min.
View sharing techniques, such as TRICKS or DISCO, enable dynamic scans with shorter temporal resolution. With view sharing techniques, because the periphery of the k-space is acquired over a longer period (temporal footprint), the temporal fidelity is compromised. A high temporal resolution usually comes at a price of spatial resolution1. DISCO, which has ARC-based acceleration in both phase and slice directions, already has a shorter temporal footprint over TRICKS, which uses ASSET for similar acceleration factors. Also, DISCO allows control of the percentage of the k-space center to be acquired, providing a more flexible setup. When HyperSense is combined with DISCO, an even faster temporal resolution and shorter temporal footprint can be achieved, leading to images with a more temporally correct representation of the contrast dynamics (Figures 2-3). If acquiring an arteriogram is the main objective, spatial resolution can be increased instead.
Figure 2.
Time resolved dynamic contrast-enhanced MRA in head and neck using DISCO with HyperSense. With a more flexible setup of DISCO and additional acceleration using HyperSense, a shorter temporal resolution and temporal footprint can be achieved compared to TRICKS, resulting in (A) arterial and (B) venous phase images with better temporal resolution. Acquisition voxel was 1.3 x 1.7 x 1.2 mm, ARC 3 x 2, HyperSense factor of 1.5.
Figure 3.
In a patient with left V4 occlusion, the dynamic passage is well depicted in these images (cropped) acquired with a temporal resolution of 1.8 sec. and temporal footprint of 6 sec., which would have been 2.5 sec. and 8 sec., respectively, without HyperSense. Acquisition voxel size was 1.3 x 1.7 x 1.2 mm, ARC 3 x 2, HyperSense factor of 1.5.
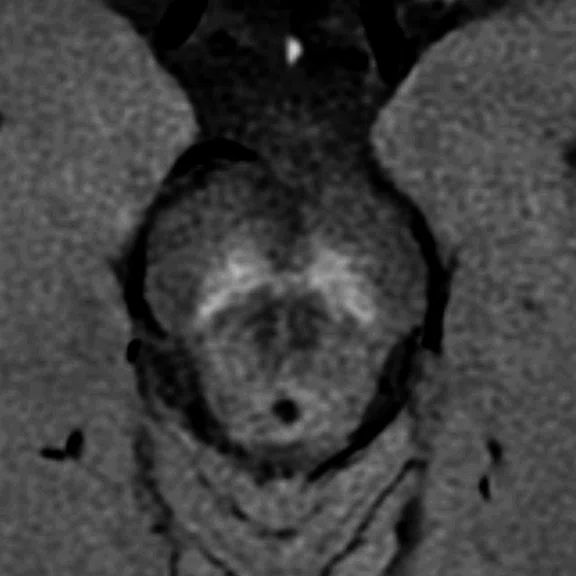
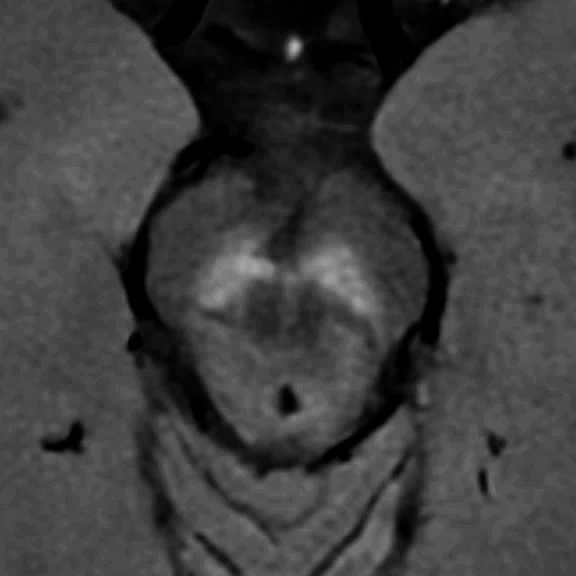
AIR™ Recon DL is another new technology that can be used to reduce scan time or to improve image quality of our routine 2D images. One example is the neuromelanin-weighted images acquired as part of our protocol for evaluating Parkinson’s disease, which usually requires multiple averages to achieve a reasonable SNR (Figure 4). With AIR™ Recon DL, we can decrease the number of averages while maintaining similar image quality.
Figure 4.
Improved SNR with AIR™ Recon DL. (A-D) Oblique axial T1-weighted fast spin echo images for neuromelanin imaging with 2 mm section thickness, obtained from a healthy volunteer. (A) Conventional image reconstruction (2 NEX); (B) average of 2 acquisitions (2 NEX + 2 NEX); AIR™ Recon DL image reconstruction with (C) medium and (D) high setting. Images reconstructed with AIR™ Recon DL show better SNR with half the scan time compared to
(B) the averaged images and (A) the conventional reconstruction method.
Body imaging
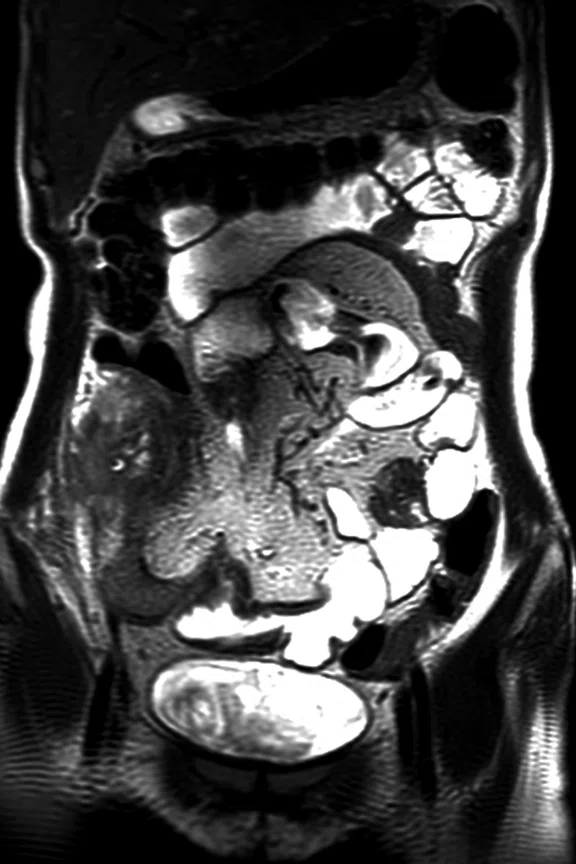
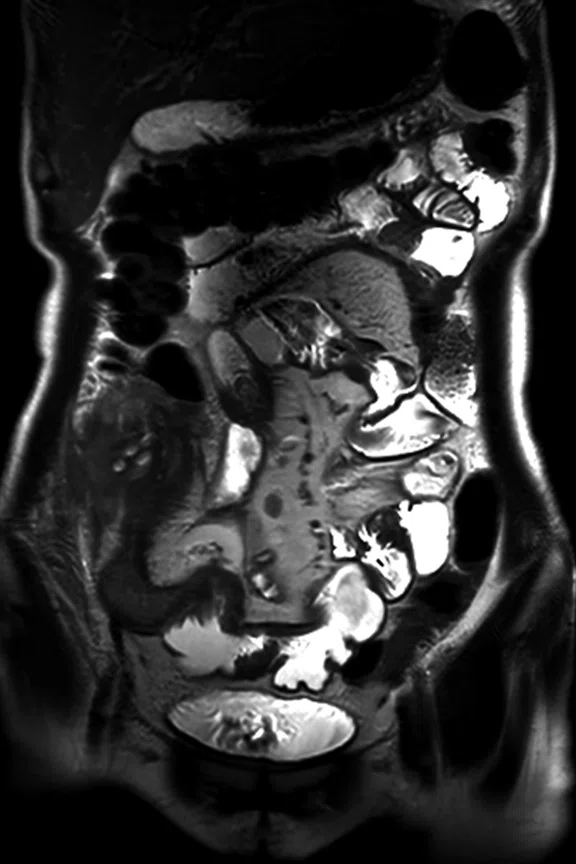
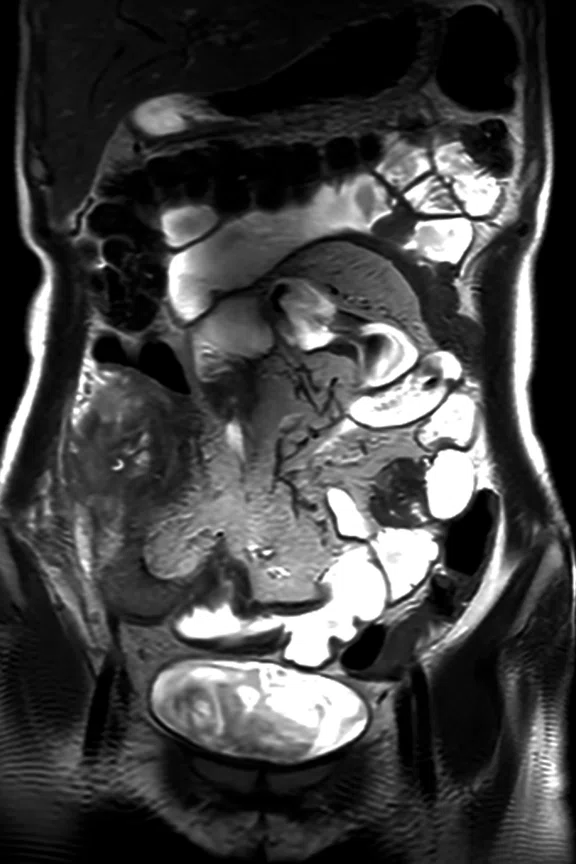
During just one breath-hold, we can obtain SSFSE T2-weighted images routinely for MR enterography by using AIR™ Recon DL. As a result, patients are more comfortable, which increases exam reproducibility because repetitive breath-holds can easily exhaust the patient and reduce compliance (Figure 5).
Figure 5.
Coronal SS frFSE T2w images of a 34-year- old patient with active Crohn’s disease. (B, C) The AIR™ Recon DL reconstructed images show a reduction in background noise and a sharper margin of bowel wall and vascularity. (A) Conventional image; (B) AIR™ Recon DL reconstructed image using the high setting, 1.0 x 1.2 x 4 mm, 1 breath-hold, 58 sec.; and (C) AIR™ Recon DL reconstructed image using the high setting and original image, 1.2 x 1.7 x 4 mm, 1 breath-hold, 18 sec. (B, C) Despite 69% scan time reduction, there is no significant difference in image quality between (B) and (C).
HyperSense decreases MR image acquisition failure in elderly patients who cannot hold their breath or are hard of hearing, and therefore unable to complete an MR exam. HyperSense improves the workflow in an MR room, which also decreases the number of patients waiting for their scans.
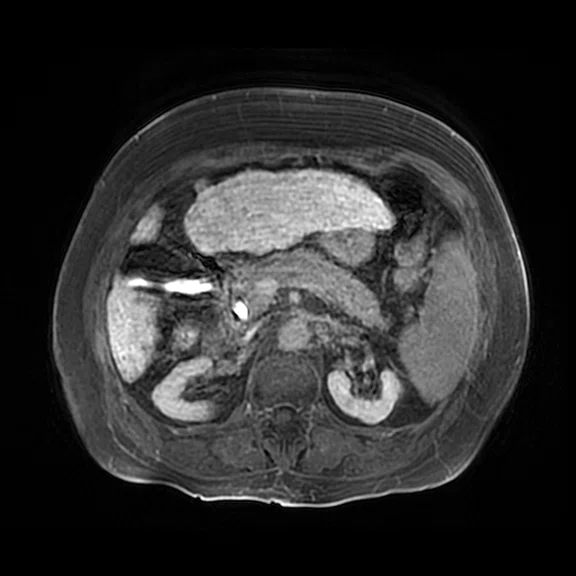
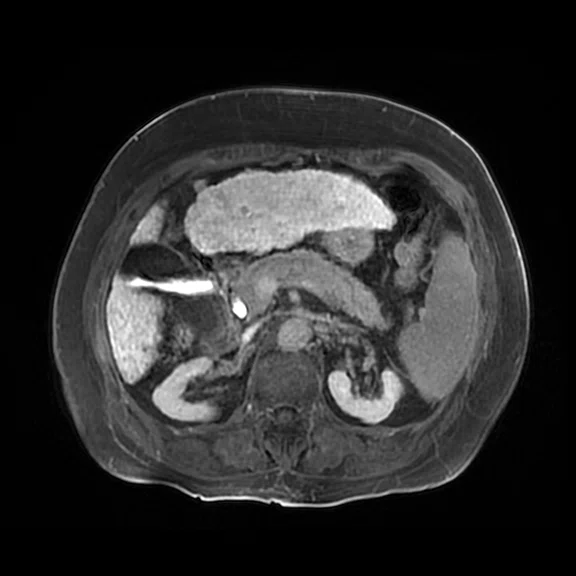
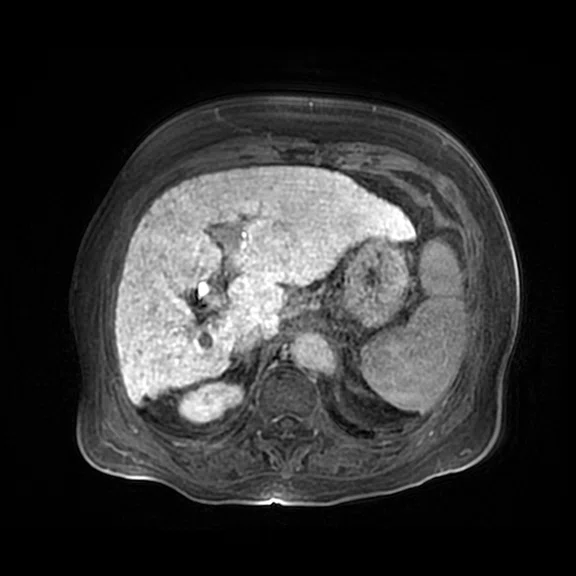
For MR enterography, we can obtain near-isotropic (3D) enhanced T1-weighted coronal images using LAVA with HyperSense (Figure 6A-C). Previously, we obtained enhanced axial T1-weighted images on a delayed phase after acquiring dynamic coronal images. Therefore, axial images were not helpful for evaluating active inflammation due to its late phase. With 3D near-isotropic coronal images, we can reformat diagnostic-quality 2 mm axial images from each coronal image (Figure 6D-F).
Figure 6.
Dynamic contrast-enhanced T1w images of a 34-year-old patient with active Crohn’s disease. Images were obtained using LAVA HyperSense, 1.3 x 1.2 x 1.6 mm, HyperSense factor 1.2, 16 sec. of temporal resolution. (A-C) Coronal pre, arterial and venous images and (D-F) axial pre, arterial and venous images reformatted from each coronal image resulting in 2 mm slice thickness. With 3D near-isotropic LAVA and HyperSense, we can evaluate active inflammation in the axial images of the same phases with the coronal images, which is helpful for increasing diagnostic confidence.
In liver MR exams, we often obtain the hepatobiliary phase image in a much shorter time using LAVA with HyperSense, such as 11 seconds. It is helpful for patients who cannot hold their breath longer than 16 seconds, which is our average scan time for the hepatobiliary phase. With the reduction in scan time, we can achieve a decrease in respiration artifacts and also acquire high-resolution images, improving diagnostic confidence (Figure 7).
Figure 7.
Dynamic contrast-enhanced T1w images using LAVA, 1.2 x 1.2 x 1.7 mm, of a 72-year-old patient with primary biliary cirrhosis. Hepatobiliary phase image obtained after contrast-enhanced dynamic MR for lesion detection and characterization of the liver. (A, C) Without HyperSense, 16 sec. and (B, D) with HyperSense factor 1.5, 11 sec. By using HyperSense, we can obtain images with reduced artifact due to respiratory motion in a much shorter time, which is helpful for patients who can’t hold their breath.
Numerous benefits across anatomies
In addition to scan time reduction with AIR™ Recon DL, we can acquire high-resolution images without increasing scan time. Thus, it is possible to characterize tiny lesions such as a pancreatic cystic lesion.
Abdominal MR exams in elderly patients can be very challenging for a technologist. Sometimes, even though they devote a large amount of time and effort, the MR acquisition fails, using precious resources.
In our radiology interpretations, the diagnostic confidence with an AIR™ Recon DL image is higher than a conventionally processed image, even when we reduce the scan time. The sharpness of anatomic structures is increased and noise is decreased on AIR™ Recon DL images. This is particularly apparent when detecting CSF leakage during MR myelography (Figure 8) in the spine, and also useful in the shoulder, knee, elbow and wrist. The improved image quality may also help reduce the radiologist’s eye fatigue when reviewing numerous images, while the shorter scan times alleviate the burden on the patient and potentially reduce rescans.
Figure 8.
Improved sharpness with AIR™ Recon DL for myelography exams. (A, B) Axial SS frFSE, heavily T2w with fat suppression, 0.6 x 0.8 x 6 mm, 1:26 min. (A) Conventional and (B) AIR™ Recon DL reconstruction using medium level more sharply demonstrates the dura mater (red arrows), nerve structures with extradural fluid collection and perineural fluid extension (yellow arrows).
AIR™ Recon DL is also well suited for obtaining thin slices in musculoskeletal imaging, allowing for evaluation of small anatomical structures of the joints such as the elbow (Figure 9) and wrist (Figure 10). This thin slice imaging achieved with AIR™ Recon DL is similar to existing 3D sequences with improved SNR. In our hospital, orthopedic surgeons are very satisfied with the images after implementing AIR™ Recon DL. Also, the MR scan time is not long despite these advantages, which helps patients better tolerate an MR scan. By enabling thin slice imaging of small anatomical structures that are typically difficult to see and interpret, it is now possible to evaluate more pathological conditions.
Figure 9.
Coronal frFSE T2w with fat suppression of the right elbow joint. (A) Conventional image, 0.4 x 0.5 x 3 mm, 2:40 min., the tear of proximal common extensor tendon (CET) is visible (yellow arrow) and radial collateral ligament (RCL) is not remarkable. (B) Image reconstruction without AIR™ Recon DL and (C) with AIR™ Recon DL with medium level of the same raw data, 0.4 x 0.6 x 1 mm, 4:47 min., the tear of proximal CET is also seen (yellow arrows). Additionally, the tear of proximal RCL is seen (red arrows). AIR™ Recon DL helps for better denoising in small structures, as shown in (C) with higher SNR than (B).
Figure 10.
Coronal frFSE T2w of the right wrist joint. (A) Conventional reconstruction image, 0.3 x 0.4 x 2 mm, 2:03 min., the central tear of triangular fibrocartilage complex (TFCC) is suspected (red arrows). (B) Image reconstruction without AIR™ Recon DL and (C) with AIR™ Recon DL with medium level image, 0.4 x 0.4 x 1 mm, 3:06 min., the central tear of TFCC is diagnosed with certainty (red arrows). AIR™ Recon DL helps for better denoising small structures such as the wrist as shown in (C) with high SNR compared to (B).
Technologies such as AIR™ Recon DL and HyperSense can help reduce long MR scan times, thereby reducing patient discomfort and the waiting time that longer scanning slots create in the hospital. This will help ensure the profitability of hospitals, maintain reliable diagnostic image quality and help our institution respond to the recent modifications in the national health insurance policy regarding MR imaging in the Republic of Korea.


