‡Not licensed in accordance with Canadian law. Not available for sale in Canada. Not CE marked. Not available for sale in all regions.
‡Not licensed in accordance with Canadian law. Not available for sale in Canada. Not CE marked. Not available for sale in all regions.
Not licensed in accordance with Canadian law. Not available for sale in Canada. Not CE marked. Not available for sale in all regions.
A
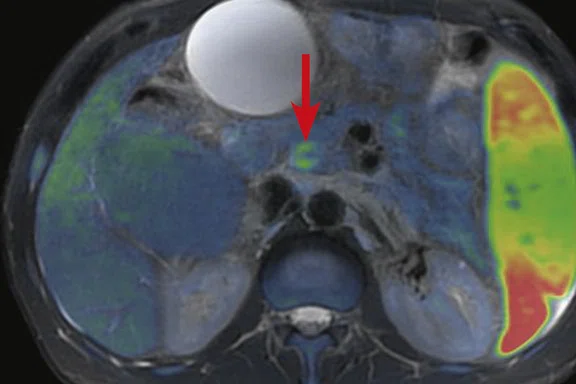
Figure 1.
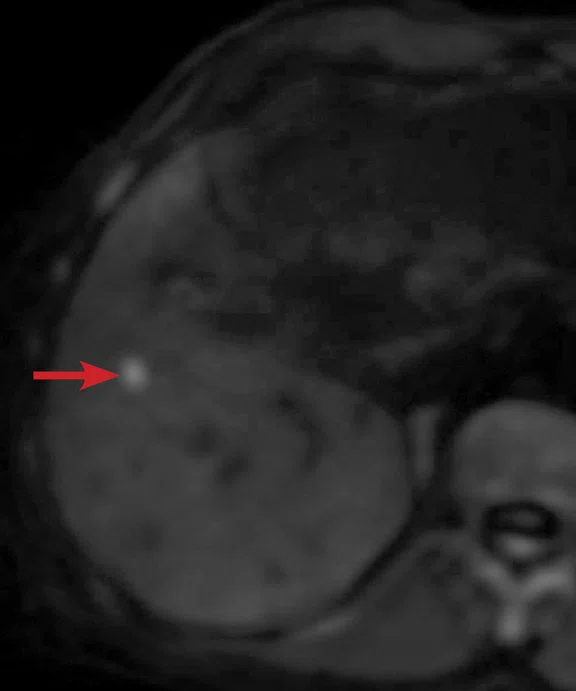
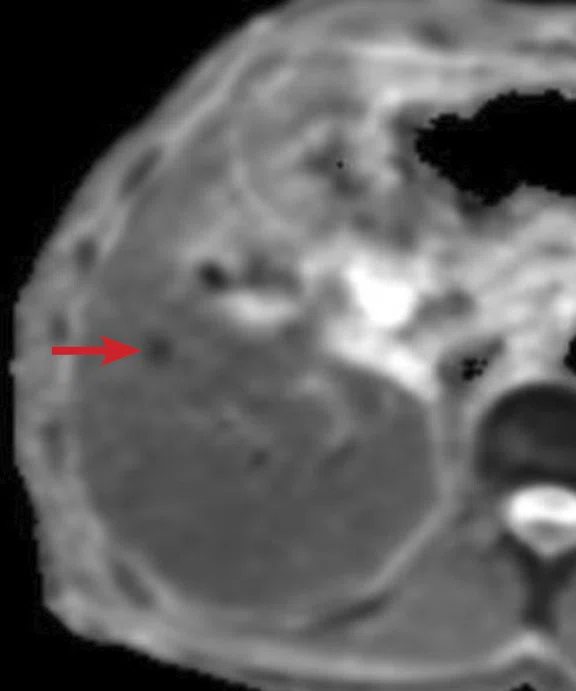
(A) Unenhanced LAVA Flex T1w imaging at baseline demonstrates a tiny hyperintense lesion within segment 5 adjacent to a blood vessel, with (B) corresponding high signal on MAGiC DWI b1000. Appearances on ADC mapping were indeterminate. (C) Follow-up imaging three months later confirmed a subtle but persistent T1 hyperintense lesion but with marked motion artifact across all T1w images. (D) High signal on MAGiC DWI b1000 was again demonstrated, however, now with (E) corresponding hypointensity on ADC mapping, therefore, confirming diffusion restriction consistent with melanoma metastasis.
B
Figure 1.
(A) Unenhanced LAVA Flex T1w imaging at baseline demonstrates a tiny hyperintense lesion within segment 5 adjacent to a blood vessel, with (B) corresponding high signal on MAGiC DWI b1000. Appearances on ADC mapping were indeterminate. (C) Follow-up imaging three months later confirmed a subtle but persistent T1 hyperintense lesion but with marked motion artifact across all T1w images. (D) High signal on MAGiC DWI b1000 was again demonstrated, however, now with (E) corresponding hypointensity on ADC mapping, therefore, confirming diffusion restriction consistent with melanoma metastasis.
C
Figure 1.
(A) Unenhanced LAVA Flex T1w imaging at baseline demonstrates a tiny hyperintense lesion within segment 5 adjacent to a blood vessel, with (B) corresponding high signal on MAGiC DWI b1000. Appearances on ADC mapping were indeterminate. (C) Follow-up imaging three months later confirmed a subtle but persistent T1 hyperintense lesion but with marked motion artifact across all T1w images. (D) High signal on MAGiC DWI b1000 was again demonstrated, however, now with (E) corresponding hypointensity on ADC mapping, therefore, confirming diffusion restriction consistent with melanoma metastasis.
D
Figure 1.
(A) Unenhanced LAVA Flex T1w imaging at baseline demonstrates a tiny hyperintense lesion within segment 5 adjacent to a blood vessel, with (B) corresponding high signal on MAGiC DWI b1000. Appearances on ADC mapping were indeterminate. (C) Follow-up imaging three months later confirmed a subtle but persistent T1 hyperintense lesion but with marked motion artifact across all T1w images. (D) High signal on MAGiC DWI b1000 was again demonstrated, however, now with (E) corresponding hypointensity on ADC mapping, therefore, confirming diffusion restriction consistent with melanoma metastasis.
E
Figure 1.
(A) Unenhanced LAVA Flex T1w imaging at baseline demonstrates a tiny hyperintense lesion within segment 5 adjacent to a blood vessel, with (B) corresponding high signal on MAGiC DWI b1000. Appearances on ADC mapping were indeterminate. (C) Follow-up imaging three months later confirmed a subtle but persistent T1 hyperintense lesion but with marked motion artifact across all T1w images. (D) High signal on MAGiC DWI b1000 was again demonstrated, however, now with (E) corresponding hypointensity on ADC mapping, therefore, confirming diffusion restriction consistent with melanoma metastasis.
A
Figure 2.
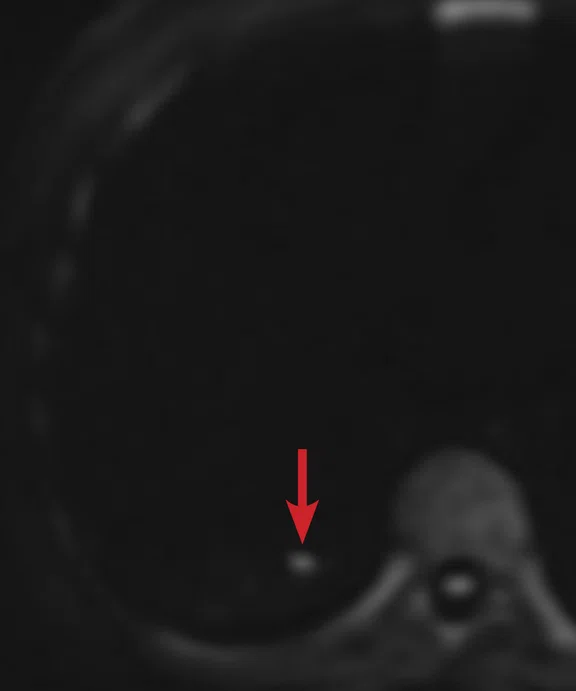
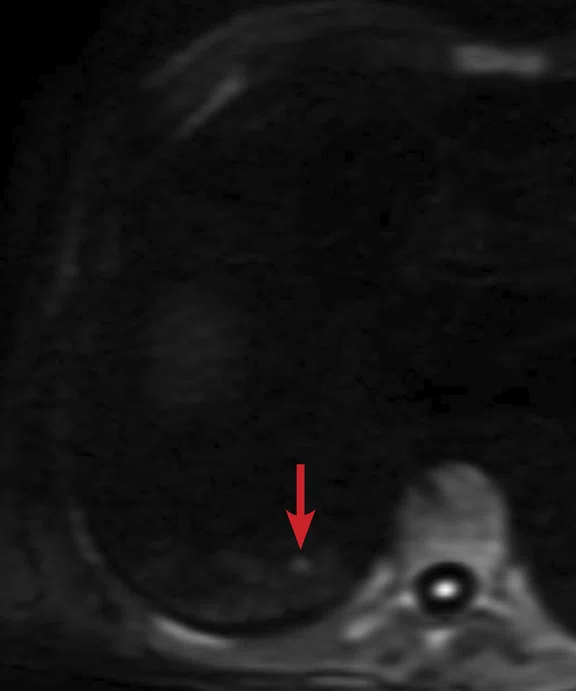
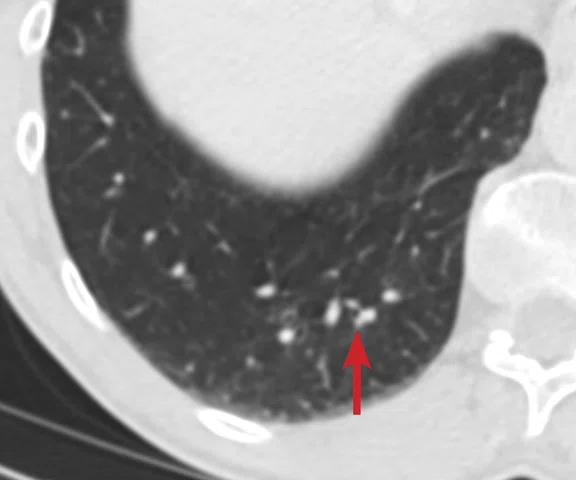
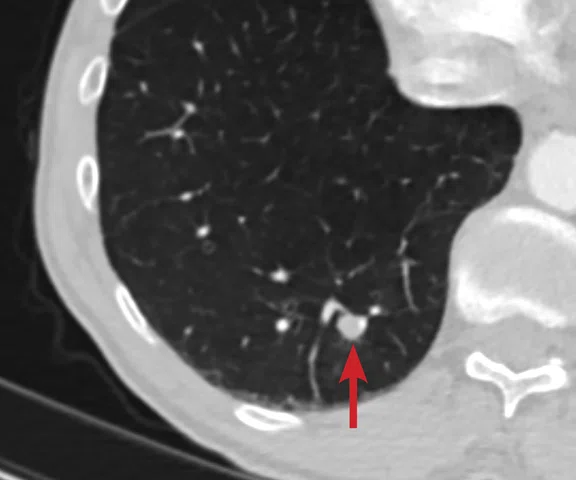
(A) Small nodule of diffusion restriction within the right lung base, MAGiC DWI b1000 image. (B) On reinspection of original baseline imaging from three months prior, a less conspicuous focus of diffusion restriction was present at the same location, possibly corresponding with (C) a 2 mm nodule seen only in retrospect at contemporaneous baseline CT. Given its location adjacent to a blood vessel, this would be almost impossible to identify in the absence of a DWI correlate. (D) A repeat CT staging study was therefore performed, which confirmed the presence of an enlarging pulmonary metastasis, equivalent to the nodule seen in (A).
B
Figure 2.
(A) Small nodule of diffusion restriction within the right lung base, MAGiC DWI b1000 image. (B) On reinspection of original baseline imaging from three months prior, a less conspicuous focus of diffusion restriction was present at the same location, possibly corresponding with (C) a 2 mm nodule seen only in retrospect at contemporaneous baseline CT. Given its location adjacent to a blood vessel, this would be almost impossible to identify in the absence of a DWI correlate. (D) A repeat CT staging study was therefore performed, which confirmed the presence of an enlarging pulmonary metastasis, equivalent to the nodule seen in (A).
C
Figure 2.
(A) Small nodule of diffusion restriction within the right lung base, MAGiC DWI b1000 image. (B) On reinspection of original baseline imaging from three months prior, a less conspicuous focus of diffusion restriction was present at the same location, possibly corresponding with (C) a 2 mm nodule seen only in retrospect at contemporaneous baseline CT. Given its location adjacent to a blood vessel, this would be almost impossible to identify in the absence of a DWI correlate. (D) A repeat CT staging study was therefore performed, which confirmed the presence of an enlarging pulmonary metastasis, equivalent to the nodule seen in (A).
D
Figure 2.
(A) Small nodule of diffusion restriction within the right lung base, MAGiC DWI b1000 image. (B) On reinspection of original baseline imaging from three months prior, a less conspicuous focus of diffusion restriction was present at the same location, possibly corresponding with (C) a 2 mm nodule seen only in retrospect at contemporaneous baseline CT. Given its location adjacent to a blood vessel, this would be almost impossible to identify in the absence of a DWI correlate. (D) A repeat CT staging study was therefore performed, which confirmed the presence of an enlarging pulmonary metastasis, equivalent to the nodule seen in (A).
A
Figure 3.
(A) Axial T2w PROPELLER image. Dysmorphic liver typical of advanced PSC with increasing dilatation of the common bile duct (arrow). Note the extensive T2 signal change within the background liver parenchyma consistent with fibrosis (asterisk). (B) Coronal MRCP maximum intensity projection (MIP) image demonstrating a shouldered, irregular stricture within the inferior duct.
B
Figure 3.
(A) Axial T2w PROPELLER image. Dysmorphic liver typical of advanced PSC with increasing dilatation of the common bile duct (arrow). Note the extensive T2 signal change within the background liver parenchyma consistent with fibrosis (asterisk). (B) Coronal MRCP maximum intensity projection (MIP) image demonstrating a shouldered, irregular stricture within the inferior duct.
A
Figure 4.
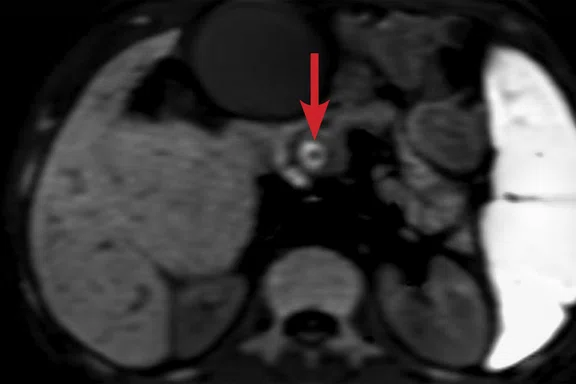
(A, D) MAGiC DWI b1000 images demonstrating a ring of restricted diff usion within the inferior common bile duct immediately upstream of the stricture shown in Figure 3B. (B, E) Axial T2w PROPELLER images fused with (C, F) false color DWI images demonstrate correlation with subtle irregular mural thickening and T2 hyperintensity at the level of the stricture (arrows). (C) Subtle diff usion restriction was also present within the regions of fi brosis (asterisk).
B
Figure 4.
(A, D) MAGiC DWI b1000 images demonstrating a ring of restricted diff usion within the inferior common bile duct immediately upstream of the stricture shown in Figure 3B. (B, E) Axial T2w PROPELLER images fused with (C, F) false color DWI images demonstrate correlation with subtle irregular mural thickening and T2 hyperintensity at the level of the stricture (arrows). (C) Subtle diff usion restriction was also present within the regions of fi brosis (asterisk).
C
Figure 4.
(A, D) MAGiC DWI b1000 images demonstrating a ring of restricted diff usion within the inferior common bile duct immediately upstream of the stricture shown in Figure 3B. (B, E) Axial T2w PROPELLER images fused with (C, F) false color DWI images demonstrate correlation with subtle irregular mural thickening and T2 hyperintensity at the level of the stricture (arrows). (C) Subtle diff usion restriction was also present within the regions of fi brosis (asterisk).
D
Figure 4.
(A, D) MAGiC DWI b1000 images demonstrating a ring of restricted diff usion within the inferior common bile duct immediately upstream of the stricture shown in Figure 3B. (B, E) Axial T2w PROPELLER images fused with (C, F) false color DWI images demonstrate correlation with subtle irregular mural thickening and T2 hyperintensity at the level of the stricture (arrows). (C) Subtle diff usion restriction was also present within the regions of fi brosis (asterisk).
E
Figure 4.
(A, D) MAGiC DWI b1000 images demonstrating a ring of restricted diff usion within the inferior common bile duct immediately upstream of the stricture shown in Figure 3B. (B, E) Axial T2w PROPELLER images fused with (C, F) false color DWI images demonstrate correlation with subtle irregular mural thickening and T2 hyperintensity at the level of the stricture (arrows). (C) Subtle diff usion restriction was also present within the regions of fi brosis (asterisk).
F
Figure 4.
(A, D) MAGiC DWI b1000 images demonstrating a ring of restricted diff usion within the inferior common bile duct immediately upstream of the stricture shown in Figure 3B. (B, E) Axial T2w PROPELLER images fused with (C, F) false color DWI images demonstrate correlation with subtle irregular mural thickening and T2 hyperintensity at the level of the stricture (arrows). (C) Subtle diff usion restriction was also present within the regions of fi brosis (asterisk).
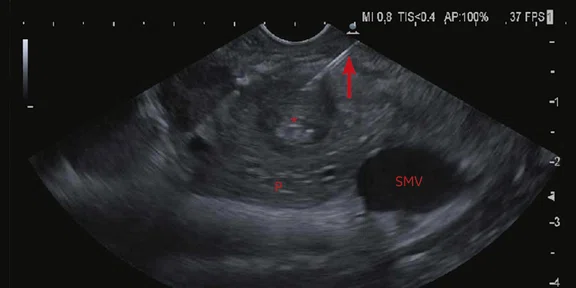
Figure 5.
Axial endoscopic ultrasound image at/immediately below the abnormal mural thickening seen in Figure 4. (P) = pancreas, (SMV) = superior mesenteric vein. A core biopsy needle (arrow) can be seen entering luminal soft tissue (asterisk). Image courtesy of Dr. N. Carroll, Consultant Radiologist, Cambridge University Hospitals.
1. Schmid-Tannwald C, Oto A, Reiser MF and Zech CJ. Diffusionweighted MRI of the abdomen: current value in clinical routine. J Magn Reson Imaging. 2013 Jan;37(1):35-47.
2. Kircher, MF et al. Comparison of Breath-hold versus Free-breathing versus Respiratory Triggered and Navigator Triggered Diffusion Weighted Imaging of the Liver. Proc. Intl. Soc. Mag. Reson. Med. 19 (2011).p840.
3. Taouli B, Sandberg A, Stemmer A, et al. Diffusion-weighted imaging of the liver: comparison of navigator triggered and breathhold acquisitions. J Magn Reson Imaging. 2009 Sep;30(3):561-8.
3. Taouli B, Sandberg A, Stemmer A, et al. Diffusion-weighted imaging of the liver: comparison of navigator triggered and breathhold acquisitions. J Magn Reson Imaging. 2009 Sep;30(3):561-8.
3. Taouli B, Sandberg A, Stemmer A, et al. Diffusion-weighted imaging of the liver: comparison of navigator triggered and breathhold acquisitions. J Magn Reson Imaging. 2009 Sep;30(3):561-8.
4. Higaki T, Nakamura Y, Tatsugami F, et al. Introduction to the Technical Aspects of Computed Diffusion-weighted Imaging for Radiologists. Radiographics. 2018 Jul-Aug;38(4):1131-1144.
A
Figure 2.
(A) Small nodule of diffusion restriction within the right lung base, MAGiC DWI b1000 image. (B) On reinspection of original baseline imaging from three months prior, a less conspicuous focus of diffusion restriction was present at the same location, possibly corresponding with (C) a 2 mm nodule seen only in retrospect at contemporaneous baseline CT. Given its location adjacent to a blood vessel, this would be almost impossible to identify in the absence of a DWI correlate. (D) A repeat CT staging study was therefore performed, which confirmed the presence of an enlarging pulmonary metastasis, equivalent to the nodule seen in (A).
B
Figure 2.
(A) Small nodule of diffusion restriction within the right lung base, MAGiC DWI b1000 image. (B) On reinspection of original baseline imaging from three months prior, a less conspicuous focus of diffusion restriction was present at the same location, possibly corresponding with (C) a 2 mm nodule seen only in retrospect at contemporaneous baseline CT. Given its location adjacent to a blood vessel, this would be almost impossible to identify in the absence of a DWI correlate. (D) A repeat CT staging study was therefore performed, which confirmed the presence of an enlarging pulmonary metastasis, equivalent to the nodule seen in (A).
C
Figure 2.
(A) Small nodule of diffusion restriction within the right lung base, MAGiC DWI b1000 image. (B) On reinspection of original baseline imaging from three months prior, a less conspicuous focus of diffusion restriction was present at the same location, possibly corresponding with (C) a 2 mm nodule seen only in retrospect at contemporaneous baseline CT. Given its location adjacent to a blood vessel, this would be almost impossible to identify in the absence of a DWI correlate. (D) A repeat CT staging study was therefore performed, which confirmed the presence of an enlarging pulmonary metastasis, equivalent to the nodule seen in (A).
D
Figure 2.
(A) Small nodule of diffusion restriction within the right lung base, MAGiC DWI b1000 image. (B) On reinspection of original baseline imaging from three months prior, a less conspicuous focus of diffusion restriction was present at the same location, possibly corresponding with (C) a 2 mm nodule seen only in retrospect at contemporaneous baseline CT. Given its location adjacent to a blood vessel, this would be almost impossible to identify in the absence of a DWI correlate. (D) A repeat CT staging study was therefore performed, which confirmed the presence of an enlarging pulmonary metastasis, equivalent to the nodule seen in (A).
A
Figure 3.
(A) Axial T2w PROPELLER image. Dysmorphic liver typical of advanced PSC with increasing dilatation of the common bile duct (arrow). Note the extensive T2 signal change within the background liver parenchyma consistent with fibrosis (asterisk). (B) Coronal MRCP maximum intensity projection (MIP) image demonstrating a shouldered, irregular stricture within the inferior duct.
B
Figure 3.
(A) Axial T2w PROPELLER image. Dysmorphic liver typical of advanced PSC with increasing dilatation of the common bile duct (arrow). Note the extensive T2 signal change within the background liver parenchyma consistent with fibrosis (asterisk). (B) Coronal MRCP maximum intensity projection (MIP) image demonstrating a shouldered, irregular stricture within the inferior duct.
1. Schmid-Tannwald C, Oto A, Reiser MF and Zech CJ. Diffusion weighted MRI of the abdomen: current value in clinical routine. J Magn Reson Imaging. 2013 Jan;37(1):35-47.
2. Kircher, MF et al. Comparison of Breath-hold versus Free-breathing versus Respiratory Triggered and Navigator Triggered Diffusion Weighted Imaging of the Liver. Proc. Intl. Soc. Mag. Reson. Med. 19 (2011).p840.
3. Taouli B, Sandberg A, Stemmer A, et al. Diffusion-weighted imaging of the liver: comparison of navigator triggered and breathhold acquisitions. J Magn Reson Imaging. 2009 Sep;30(3):561-8.
3. Taouli B, Sandberg A, Stemmer A, et al. Diffusion-weighted imaging of the liver: comparison of navigator triggered and breathhold acquisitions. J Magn Reson Imaging. 2009 Sep;30(3):561-8.
3. Taouli B, Sandberg A, Stemmer A, et al. Diffusion-weighted imaging of the liver: comparison of navigator triggered and breathhold acquisitions. J Magn Reson Imaging. 2009 Sep;30(3):561-8.
result


PREVIOUS
${prev-page}
NEXT
${next-page}
Subscribe Now
Manage Subscription
FOLLOW US
Contact Us • Cookie Preferences • Privacy Policy • California Privacy PolicyDo Not Sell or Share My Personal Information • Terms & Conditions • Security
© 2024 GE HealthCare. GE is a trademark of General Electric Company. Used under trademark license.
CASE STUDIES
Free-breathing navigator-echo triggered diffusion-weighted imaging in the evaluation of hepatobiliary disease
Free-breathing navigator-echo triggered diffusion-weighted imaging in the evaluation of hepatobiliary disease
By David Bowden FRCR, Consultant Hepatobiliary & GI Radiologist, Addenbrooke’s Hospital, Cambridge University Hospitals NHS Foundation Trust
Introduction
Increasing demands are made upon MR in the workup of patients with hepatobiliary disease. This is especially true in the evaluation of those with cholangiopathies in which high-quality imaging is critical for the initial disease diagnosis and also in surveillance imaging for the development of malignancy. In addition, there has been continued expansion of treatment options available to patients with primary and secondary hepatic malignancies previously considered untreatable. Surgical resection and locoregional therapies such as radiofrequency ablation, transarterial embolization/chemoembolization (TAE/TACE), radioembolization, hepatic-arterial infusion pump-delivered therapy and external beam radiotherapy are all currently available treatment strategies. While traditionally colorectal metastases have been targeted for therapy, other tumor types are increasingly being considered for more aggressive intervention.
Given the high cost and potential of associated toxicity to normal tissues and organs of many cancer treatment options, accurate identification and characterization of hepatobiliary lesions is critical. Patients listed for transplantation for chronic liver disease, including those with cholangiopathies, require optimal imaging because the identification of a malignancy may ultimately preclude transplantation. Of proven importance is diffusion-weighted imaging (DWI) due to its sensitivity for detecting lesions and, in some cases, its utility in characterizing them.1 Furthermore, in patients unable to undergo contrast-enhanced MR imaging due to renal dysfunction, DWI is of even greater importance for lesion detection.
Several techniques exist for DWI evaluation of the liver, including breath-hold, free-breathing, respiratory and navigator-echo triggered acquisitions.2 While breath-hold DWI has the advantage of speed of acquisition, disadvantages include inferior signal-to-noise ratio (SNR), which is particularly pronounced at high b-values and necessitates thicker slice partitions and reduced spatial resolution. This results in inferior lesion-to-liver contrast-to-noise ratios (CNR) and a reliance on the patient’s ability to breath-hold for adequate periods of time.3 In addition, signal loss secondary to susceptibility artifact and motion is more pronounced, in particular within the left liver where cardiac pulsation often markedly compromises image quality.3
Navigator-echo triggered DWI can track diaphragmatic motion during free-breathing and subsequently trigger data acquisition in quiescent periods of the respiratory cycle.3 Given the importance of this sequence, this technique has superseded breath-hold DWI at our institution and has resulted in increased confidence in lesion detection and repeatability. The method is particularly applicable within the left liver to mitigate the effects of cardiac motion and within the most superior segments on the right where the proximity of lung parenchyma often results in image degradation. The resultant high resolution and relative insensitivity to motion artifact has also, on occasion, led to the detection of extrahepatic disease that would otherwise almost certainly go undetected with MR.
Case 1
Patient history
A 65-year-old man with a history of recent removal of a malignant melanoma from the scalp. CT staging demonstrated an indeterminate liver lesion within segment 5, requiring further characterization. If solitary, the patient was to be considered for radiofrequency ablation or resection.
Technique
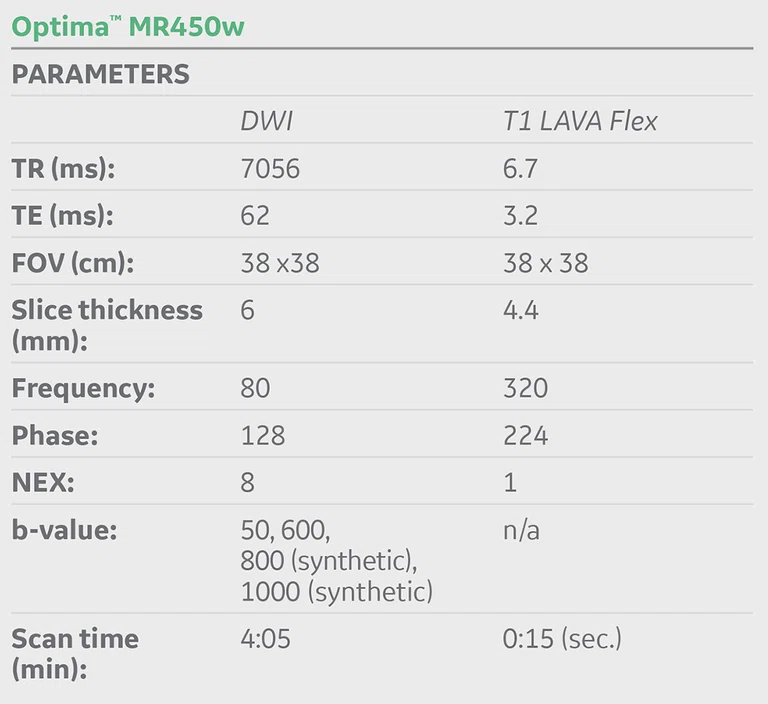
Standard imaging protocol included navigator-echo triggered DWI using b-values of 50 and 600 in addition to MAGiC DWI (synthetic DWI), a sequence allowing the calculation of additional high b-values without separate acquisitions. This approach reduces scan time and delivers excellent image sharpness and SNR at the synthetically calculated high b-values.
Figure 1.
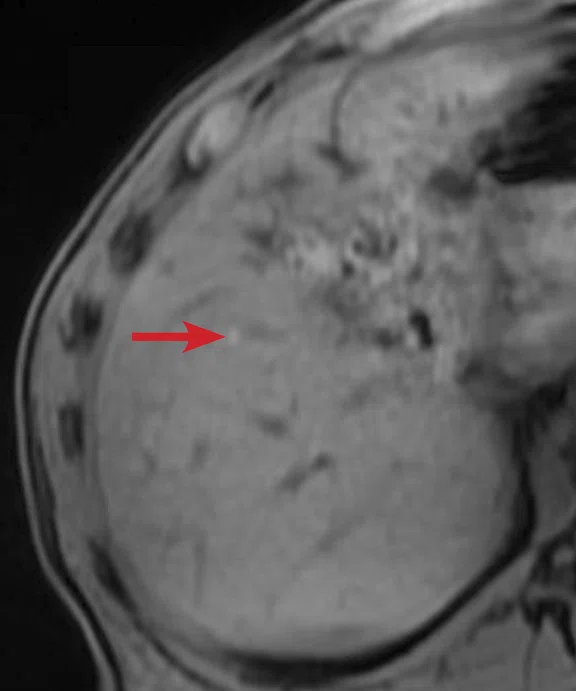
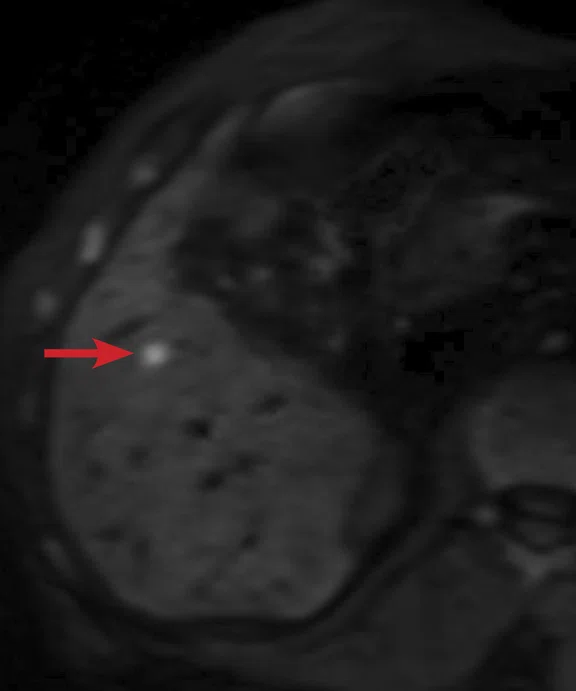
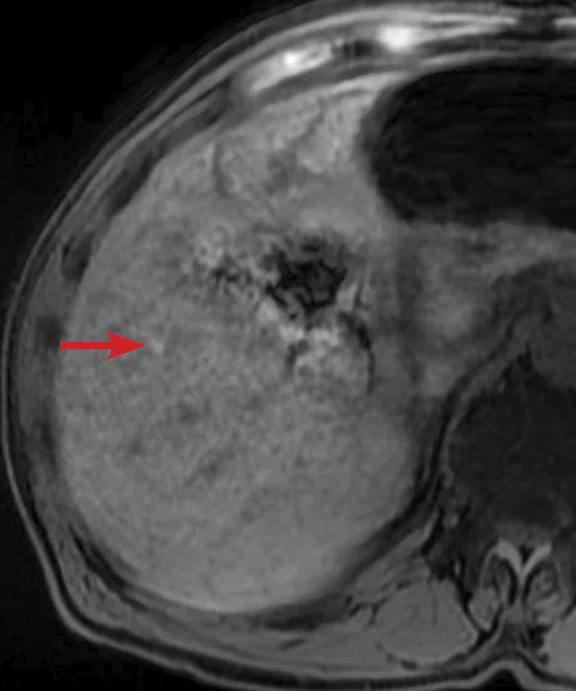
(A) Unenhanced LAVA Flex T1w imaging at baseline demonstrates a tiny hyperintense lesion within segment 5 adjacent to a blood vessel, with (B) corresponding high signal on MAGiC DWI b1000. Appearances on ADC mapping were indeterminate. (C) Follow-up imaging three months later confirmed a subtle but persistent T1 hyperintense lesion but with marked motion artifact across all T1w images. (D) High signal on MAGiC DWI b1000 was again demonstrated, however, now with (E) corresponding hypointensity on ADC mapping, therefore, confirming diffusion restriction consistent with melanoma metastasis.
MR findings
Unenhanced LAVA Flex T1-weighted imaging demonstrated a tiny hyperintense lesion within segment 5, of high signal on DWI but indeterminate Apparent Diffusion Coefficient (ADC) findings due to image artifact (Figure 1). Due to its small size and indeterminate nature, early interval imaging was advised, although initial findings were concerning, given the known innate T1 hyperintensity of melanoma metastases.
At follow-up, the patient’s inability to breath-hold for some sequences resulted in suboptimal T1-weighted image quality but confirmed a persistent tiny hyperintense lesion, now with unequivocal restricted diffusion consistent with melanoma metastasis. In addition, a small hyperintense focus was visible within the right lung base, which in retrospect was present three months prior, although less conspicuous (Figure 2). On repeat review of the previous CT imaging performed at the same time as the original MR study, a tiny nodule was visible at this location, raising concern for pulmonary metastasis. Restaging CT imaging of the chest was advised, which confirmed an enlarging lung nodule consistent with metastatic disease. Patient management subsequently changed significantly to immunotherapy with avoidance of unnecessary surgery or locoregional therapy.
Figure 2.
(A) Small nodule of diffusion restriction within the right lung base, MAGiC DWI b1000 image. (B) On reinspection of original baseline imaging from three months prior, a less conspicuous focus of diffusion restriction was present at the same location, possibly corresponding with (C) a 2 mm nodule seen only in retrospect at contemporaneous baseline CT. Given its location adjacent to a blood vessel, this would be almost impossible to identify in the absence of a DWI correlate. (D) A repeat CT staging study was therefore performed, which confirmed the presence of an enlarging pulmonary metastasis, equivalent to the nodule seen in (A).
Case 2
Patient history
A 57-year-old man with primary sclerosing cholangitis (PSC) resulting in cirrhosis, listed for transplantation and under surveillance due to elevated risk of cholangiocarcinoma and with deteriorating liver function tests.
Technique
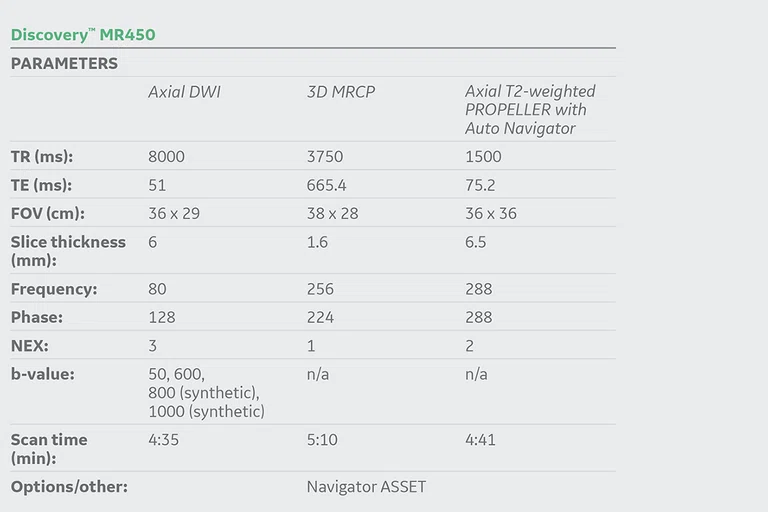
Standard liver MR protocol including navigator-echo triggered high-resolution magnetic resonance cholangiopancreatography (MRCP), Axial T2-weighted PROPELLER image acquisition and navigator-echo triggered DWI (using b-values of 50 and 600) with MAGiC DWI-generated b-values of 800 and b1000 images.
MR findings
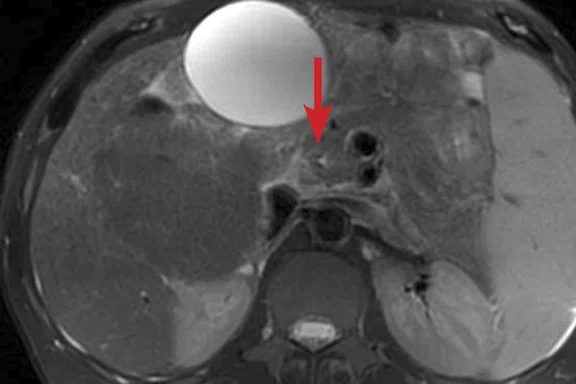
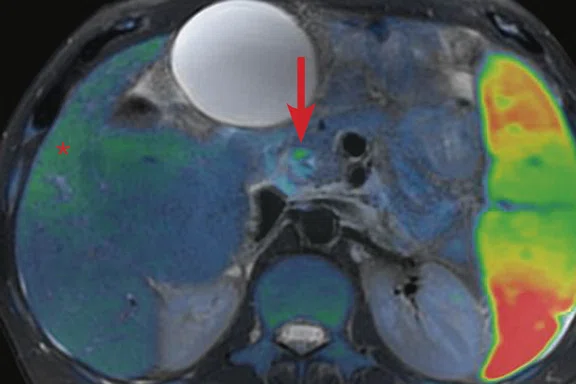
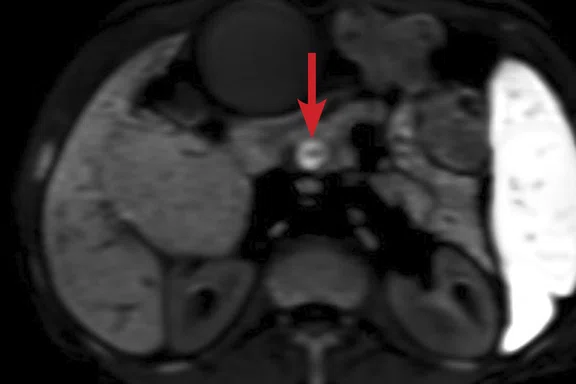
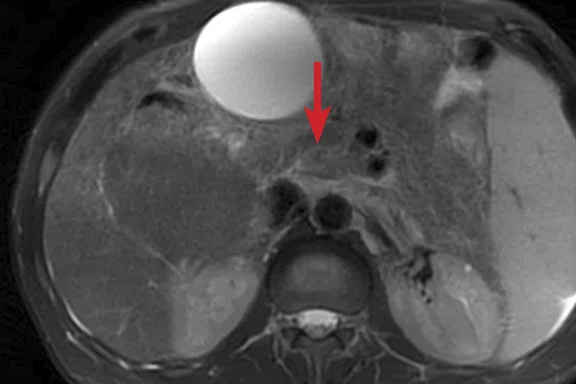
T2-weighted PROPELLER images demonstrated a typical dysmorphic liver with left lobe atrophy consistent with advanced PSC, widespread areas of geographic hyperintensity and subtle diffusion restriction consistent with fibrosis (Figure 3). Increasing extrahepatic duct dilatation was seen with an irregular stricture of the inferior common bile duct. High b-value (1000) MAGiC DWI clearly showed a ring of restricted diffusion at the level of the stricture, which could be matched to a subtle T2 hyperintense lesion aided by the use of image fusion (Figure 4). Endoscopic ultrasound evaluation confirmed the presence of a mural lesion with a luminal soft tissue component (Figure 5); biopsy confirmed cholangiocarcinoma. The patient was therefore removed from listing for transplantation.
Discussion
In both cases the high quality resolution and motion resistance of navigator-triggered DWI, in conjunction with utilization of high b-value synthetic images derived using MAGiC DWI, led to the identification of lesions that dramatically changed patient management. Previously, DWI has been partly hampered by issues relating to movement, susceptibility artifact and poor resolution; cases such as these clearly demonstrate that time invested in image acquisition during certain critical sequences is well-spent, while utilization of MAGiC DWI enabled time-savings from avoiding the acquisition of additional b-value images. An additional benefit of MAGiC DWI is the ability to calculate high b-value synthetic images without the lengthened TE that an acquisition would require, thereby improving image resolution and SNR as shown in the cases described.4
Figure 3.
(A) Axial T2w PROPELLER image. Dysmorphic liver typical of advanced PSC with increasing dilatation of the common bile duct (arrow). Note the extensive T2 signal change within the background liver parenchyma consistent with fibrosis (asterisk). (B) Coronal MRCP maximum intensity projection (MIP) image demonstrating a shouldered, irregular stricture within the inferior duct.
Figure 4.
(A, D) MAGiC DWI b1000 images demonstrating a ring of restricted diffusion within the inferior common bile duct immediately upstream of the stricture shown in Figure 3B. (B, E) Axial T2w PROPELLER images fused with (C, F) false color DWI images demonstrate correlation with subtle irregular mural thickening and T2 hyperintensity at the level of the stricture (arrows). (C) Subtle diffusion restriction was also present within the regions of fibrosis (asterisk).
Figure 5.
Axial endoscopic ultrasound image at/immediately below the abnormal mural thickening seen in Figure 4. (P) = pancreas, (SMV) = superior mesenteric vein. A core biopsy needle (arrow) can be seen entering luminal soft tissue (asterisk). Image courtesy of Dr. N. Carroll, Consultant Radiologist, Cambridge University Hospitals.
Being able to confidently identify lesions only millimeters in size, including within the lung bases where technical issues such as motion and susceptibility artifact are normally significant factors of image degradation, leads to significantly improved diagnostic confidence. While breath-hold DWI has its place in certain patient groups with a low pre-test probability of disease, we now routinely employ navigator-triggered DWI and T2-weighted PROPELLER imaging to optimize image quality in challenging patient groups.
Acknowledgements
Martin Graves, PhD, Consultant Clinical Scientist and Head of MR Physics, Cambridge University Hospitals; Simon Dezonie, Zone Clinical Leader, UK, GE Healthcare.


