Figure 2.
Changes in T1ρ and T2 relaxation times between basketball players (BB) and swimmers (Swim) during competitive season (post-season-1 minus pre-season-1), off season (pre-season-2 minus post-season-1), and 1 year (pre-season-2 minus pre-season-1). In both graphs, circles represent outliers, and the whiskers indicate the 10th and 90th percentiles.
A
Figure 6.
(A) Sagittal T2*single [ms] MRI of PT demonstrating decreased T2* in the proximal patellar tendon (arrow). (B) Shows high correlation (R=0.668, p=0.006) between T2*single and loss of tendon stiffness (SWS).
B
Figure 6.
(A) Sagittal T2*single [ms] MRI of PT demonstrating decreased T2* in the proximal patellar tendon (arrow). (B) Shows high correlation (R=0.668, p=0.006) between T2*single and loss of tendon stiffness (SWS).
2D FSE PD FatSat
Figure 1.
Advanced knee protocol designed for the directed study to investigate longitudinal changes in quantitative and qualitative metrics in basketball and swimmer cohorts.
Table 1.
According to the NBA 2020-21 season statistics, these are the most common injuries leading to games missed.
‡ Technology in development that represents ongoing research and development efforts. These technologies are not products and may never become products. Not for sale. Not cleared or approved by the US FDA or any other global regulator for commercial availability.
‡ Technology in development that represents ongoing research and development efforts. These technologies are not products and may never become products. Not for sale. Not cleared or approved by the US FDA or any other global regulator for commercial availability.
1. Rubin EB, Mazzoli V, Black MS, et al, Effects of the Competitive Season and Off-Season on Knee Articular Cartilage in Collegiate Basketball Players Using Quantitative MRI: A Multicenter Study. J Magn Reson Imaging. 2021 Sep;54(3):840-851.
2. Li X, Benjamin Ma C, Link TM, et al. In vivo T(1rho) and T(2) mapping of articular cartilage in osteoarthritis of the knee using 3 T MRI. Osteoarthritis Cartilage. 2007 Jul;15(7):789-97.
3. Duvvuri U, Reddy R, Patel SD, Kaufman JH, Kneeland JB, Leigh JS. T1rho-relaxation in articular cartilage: effects of enzymatic degradation. Magn Reson Med. 1997 Dec;38(6):863-7.
Figure 3.
Bone shapes demonstrated significant group differences in the tibia and patella between swimmers and basketball players. Tibia mode 2 relates to the size of the lateral plateau (top), tibia mode 7 primarily describes to relative heights of intercondylar spines (middle), and patella mode 4 shows the symmetry and curvature of medial and lateral facets (bottom).
5. Li Z, Liu SY, Xu L, Xu SY, Ni GX. Effects of treadmill running with different intensity on rat subchondral bone. Sci Rep. 2017;7:1977.
6. Hashemi J, Chandrashekar N, Gill B, et al. The geometry of the tibial plateau and its influence on the biomechanics of the tibiofemoral joint. J Bone Joint Surg Am. 2008;90:2724‐2734.
4. Gao KT, Pedoia V, Young KA, et al. Multiparametric MRI characterization of knee articular cartilage and subchondral bone shape in collegiate basketball players. J Orthop Res. 2021 Jul;39(7):1512-1522.
7. Erin C. Argentieri1, Garry Gold2, Sharmila Majumdar3, Hollis G. Potter1, Matthew F. Koff. Comparison of Meniscal T2* Metrics in Elite Basketball Players and Swimmers, ORS 2021, Annual Meeting Paper No. 1219.
8. Erin C. Argentieri, Garry Gold, Sharmila Majumdar, Hollis G. Potter, Matthew F. Koff. Medial and lateral meniscal T2* within elite basketball players and swimmers. ORS 2022 Annual Meeting Paper No. 1021.
10. Breda SJ, Oei EHG, Zwerver J, et al. Effectiveness of progressive tendon-loading exercise therapy in patients with patellar tendinopathy: a randomised clinical trial. Br J Sports Med. 2021;55:501-509.
11. Breda SJ, de Vos RJ, Poot DHJ, Krestin GP, Hernandez- Tamames JA, Oei EHG. Association Between T2* Relaxation Times Derived From Ultrashort Echo Time MRI and Symptoms During Exercise Therapy for Patellar Tendinopathy: A Large Prospective Study. J Magn Reson Imaging. 2021 Nov;54(5):1596-1605.
12. Breda SJ, van der Vlist A, de Vos RJ, Krestin GP, Oei EHG. The association between patellar tendon stiffness measured with shear-wave elastography and patellar tendinopathy-a casecontrol study. Eur Radiol. 2020 Nov;30(11):5942-5951.
13. Breda SJ, de Vos RJ, Krestin GP, Oei EHG. Decreasing patellar tendon stiffness during exercise therapy for patellar tendinopathy is associated with better outcome. J Sci Med Sport. 2022 Jan 13:S1440-2440(22)00007-X.
A
Figure 4.
(A) Mono-exponential T2* maps using 3D-UTE at the proximal patellar tendon in a 19-year-old male volleyball player with clinically diagnosed and ultrasound-confirmed PT at baseline, 12 weeks and 24 weeks. (B) Scatter plot of unadjusted individual T2* relaxation times versus symptom severity as scored at baseline and after 12 and 24 weeks with the validated VISA-P questionnaire for PT. There was a significant association between a decrease in mono-exponential T2* within the degenerative tissue and clinical improvement (P =.005).
B
Figure 4.
(A) Mono-exponential T2* maps using 3D-UTE at the proximal patellar tendon in a 19-year-old male volleyball player with clinically diagnosed and ultrasound-confirmed PT at baseline, 12 weeks and 24 weeks. (B) Scatter plot of unadjusted individual T2* relaxation times versus symptom severity as scored at baseline and after 12 and 24 weeks with the validated VISA-P questionnaire for PT. There was a significant association between a decrease in mono-exponential T2* within the degenerative tissue and clinical improvement (P =.005).
14. Argentieri EC, Koff MF, Lin B, Shah PH, Potter HG, Nwawka OK. Longitudinal Changes in Quantitative MRI and Ultrasound Metrics of Patellar Tendon are Associated with Tendon Degeneration and Leg Dominance within of Collegiate Basketball Players over One Season of Play. ISMRM 2018. Annual Meeting.
15. Erin C. Argentieri et al, Patellar tendon T2* MRI demonstrates longitudinal changes of tendon degeneration over a season in collegiate basketball players. ORS 2018
18. Firminger CR, Bruce OL, Wannop JW, Stefanyshyn DJ, Edwards WB. Effect of Shoe and Surface Stiffness on Lower Limb Tendon Strain in Jumping. Med Sci Sports Exerc. 2019 Sep;51(9):1895-1903.
19. Firminger CR, Edwards WB. Effects of cyclic loading on the mechanical properties and failure of human patellar tendon. J. Biomech. 2021;120(1):110345.
20. Kuervers EJ, Firminger CR, Edwards WB. Effect of Knee Angle and Quadriceps Muscle Force on Shear-Wave Elastography Measurements at the Patellar Tendon. Ultrasound Med Biol. 2021 Aug;47(8):2167-2175.
16. Stewart Z, Heiderscheit B, Thelen D, Wilson J, Lee K. Shear wave speed as a useful biomarker of tendon health: correlation with conventional US and clinical scores in a blinded randomized placebo-controlled trial for treatment of Jumper’s knee. Society of Skeletal Radiology 2022. Annual Meeting Paper No. 47
17. Moskwa R, Lee K, Sieve R, Liu F, Wilson J, Kijowski R. Comparison of Quantitative MRI Parameters and SWS of the Patellar Tendon in PT. RSNA 2019. Annual Meeting.
Figure 9.
Fascicle length and Pennation angle differences over 12 weeks in different muscle groups between diver (red), Nordic (yellow) and control group (blue).
Figure 8.
Between limb differences (involved-uninvolved/uninvolved) in diffusivity parameters (A) in the region of injury following an acute hamstring strain injury in a collegiate athlete. Region of injury was defined via manual segmentation of edema on the T2w MR following injury. (B) The acute region of injury was registered to both follow-up scans and diffusivity parameters were averaged over 3D injury volumes. As expected, (A) lower fractional anisotropy and higher diffusivity values are apparent on the involved limb at the time of injury, indicating a disruption of muscle fibers. Diffusivity parameters begin to normalize at return to sport (22 days after injury) and 12 weeks after return to sport. (B) Disruption of fibers is also represented by the principal direction of diffusion (λ1) in the region of injury, as the observed direction of travel (medial/ lateral, red) differs from the expected (superior/ inferior, blue).
Figure 10.
Players’ motion and applied CT-based finite element modeling to study strain on tibial bone.
22. Wille CM, Hurley S, Alcock R, Adluru N, Kijowski R, Heiderscheit BC. Quantitative muscle micro-structural changes detected with diffusion tensor imaging following acute hamstring strain injuries. RSNA 2019. Annual Meeting.
23. Kipp J, Wille CM, Stiffler-Joachim M, et al. Muscle stiffness changes in athletes following acute hamstring injury with and without edema on MRI. APTA 2020 Combined Sections Meeting.
26. Suskens JJM, Secondulfo L, Kiliç Ö, et al. Effect of two eccentric hamstring exercises on muscle architectural characteristics assessed with diffusion tensor MRI: a three-arm randomized controlled trial. Br J Sp Med. 2022; submitted.
24. Monte JR, Hooijmans MT, Froeling M, et al. The repeatability of bilateral diffusion tensor imaging (DTI) in the upper leg muscles of healthy adults. Eur Radiol. 2020;30(3):1709-1718.
25. Secondulfo L, Suskens JJM, Kilic Ö, et al. A method for quantification of changes in leg muscle fiber orientations. ISMRM 2020. Annual Meeting Paper No. 2715.
27. Dooley K, Snodgrass S, Stanwell P, et al. Spatial muscle activation patterns during different leg exercise protocols in physically active adults using muscle functional MRI: a systematic review. J Appl Physiol (1985). 2020 Oct 1;129(4):934-946.
28. Steineman B et al. Orthotics and foot structure affect the fifth metatarsal principal strains during simulated level walking, AM J Sports Med. 2022. submitted.
29. Hoffman JW, Bitar RC, Sturnick DR, et al. Influence of Foot Orthotics and Intrinsic Factors on Strain Measurements in the Fifth Metatarsal. Foot Ankle Orthop. 2020;5(4):2473011420S00250.
30. Yan C, Bice RJ, Frame JW, Warden SJ, Kersh ME. Tibial bone strains in basketball players during simulated activities. ORS 2021 Annual Meeting Paper No. 1589
31. Warden SJ, Edwards WB, Willy RW. Preventing Bone Stress Injuries in Runners with Optimal Workload. Curr Osteoporos Rep. 2021 Jun;19(3):298-307.
9. Drew BT, Smith TO, Littlewood C, Sturrock B. Do structural changes (eg, collagen/matrix) explain the response to therapeutic exercises in tendinopathy: A systematic review. Br J Sports Med. 2014;48(12):966-972.
21. Wille CM, Lee KS, Heiderscheit BC. Denervation Edema of Hamstring Muscles Following Acute Strain Injury. J Orthop Sports Phys Ther. 2019 Oct;49(10):761.
I
Figure #.
Figure Copy.
H
Figure #.
Figure Copy.
Left pateller tendon
Figure 5.
Display of pre-season and post-season short T2* (T2*S) values in a collegiate basketball player. Both limbs display prolongation of T2*S from pre-season to post-season, however the patellar tendon of the left limb displays greater increase of T2*S as compared to the patellar tendon of right limb.
Right pateller tendon
Figure 5.
Display of pre-season and post-season short T2* (T2*S) values in a collegiate basketball player. Both limbs display prolongation of T2*S from pre-season to post-season, however the patellar tendon of the left limb displays greater increase of T2*S as compared to the patellar tendon of right limb.
A
Figure 7.
(A) Conventional T2w and (C) quantitative DTI imaging from a representative collegiate athlete who sustained an index left hamstring strain injury of the biceps femoris long head. Conventional imaging is used to generate (B) individual muscle regions of interest (ROI) to be used in the analysis of diffusion imaging and can be used to monitor changes in muscle morphology following acute injury. (D) Muscle architecture changes are apparent through diffusion tensor imaging and derived muscle tractography images. (E) Diffusion parameters that can be used to monitor muscle morphology within individual muscles following injury include fractional anisotropy (FA), mean diffusivity (MD), radial diffusivity (RD) and eigen values (λ1, λ2, λ3). Quantitative values derived from tractography results include fiber length, fiber count and pennation angle.
C
Figure 7.
(A) Conventional T2w and (C) quantitative DTI imaging from a representative collegiate athlete who sustained an index left hamstring strain injury of the biceps femoris long head. Conventional imaging is used to generate (B) individual muscle regions of interest (ROI) to be used in the analysis of diffusion imaging and can be used to monitor changes in muscle morphology following acute injury. (D) Muscle architecture changes are apparent through diffusion tensor imaging and derived muscle tractography images. (E) Diffusion parameters that can be used to monitor muscle morphology within individual muscles following injury include fractional anisotropy (FA), mean diffusivity (MD), radial diffusivity (RD) and eigen values (λ1, λ2, λ3). Quantitative values derived from tractography results include fiber length, fiber count and pennation angle.
A
Figure #.
Figure Copy.
C
Figure #.
Figure Copy.
B
Figure 7.
(A) Conventional T2w and (C) quantitative DTI imaging from a representative collegiate athlete who sustained an index left hamstring strain injury of the biceps femoris long head. Conventional imaging is used to generate (B) individual muscle regions of interest (ROI) to be used in the analysis of diffusion imaging and can be used to monitor changes in muscle morphology following acute injury. (D) Muscle architecture changes are apparent through diffusion tensor imaging and derived muscle tractography images. (E) Diffusion parameters that can be used to monitor muscle morphology within individual muscles following injury include fractional anisotropy (FA), mean diffusivity (MD), radial diffusivity (RD) and eigen values (λ1, λ2, λ3). Quantitative values derived from tractography results include fiber length, fiber count and pennation angle.
D
Figure 7.
(A) Conventional T2w and (C) quantitative DTI imaging from a representative collegiate athlete who sustained an index left hamstring strain injury of the biceps femoris long head. Conventional imaging is used to generate (B) individual muscle regions of interest (ROI) to be used in the analysis of diffusion imaging and can be used to monitor changes in muscle morphology following acute injury. (D) Muscle architecture changes are apparent through diffusion tensor imaging and derived muscle tractography images. (E) Diffusion parameters that can be used to monitor muscle morphology within individual muscles following injury include fractional anisotropy (FA), mean diffusivity (MD), radial diffusivity (RD) and eigen values (λ1, λ2, λ3). Quantitative values derived from tractography results include fiber length, fiber count and pennation angle.
E
Figure 7.
(A) Conventional T2w and (C) quantitative DTI imaging from a representative collegiate athlete who sustained an index left hamstring strain injury of the biceps femoris long head. Conventional imaging is used to generate (B) individual muscle regions of interest (ROI) to be used in the analysis of diffusion imaging and can be used to monitor changes in muscle morphology following acute injury. (D) Muscle architecture changes are apparent through diffusion tensor imaging and derived muscle tractography images. (E) Diffusion parameters that can be used to monitor muscle morphology within individual muscles following injury include fractional anisotropy (FA), mean diffusivity (MD), radial diffusivity (RD) and eigen values (λ1, λ2, λ3). Quantitative values derived from tractography results include fiber length, fiber count and pennation angle.
A
Figure 8.
Between limb differences (involved-uninvolved/uninvolved) in diffusivity parameters (A) in the region of injury following an acute hamstring strain injury in a collegiate athlete. Region of injury was defined via manual segmentation of edema on the T2w MR following injury. (B) The acute region of injury was registered to both follow-up scans and diffusivity parameters were averaged over 3D injury volumes. As expected, (A) lower fractional anisotropy and higher diffusivity values are apparent on the involved limb at the time of injury, indicating a disruption of muscle fibers. Diffusivity parameters begin to normalize at return to sport (22 days after injury) and 12 weeks after return to sport. (B) Disruption of fibers is also represented by the principal direction of diffusion (λ1) in the region of injury, as the observed direction of travel (medial/ lateral, red) differs from the expected (superior/ inferior, blue).
B
Figure 8.
Between limb differences (involved-uninvolved/uninvolved) in diffusivity parameters (A) in the region of injury following an acute hamstring strain injury in a collegiate athlete. Region of injury was defined via manual segmentation of edema on the T2w MR following injury. (B) The acute region of injury was registered to both follow-up scans and diffusivity parameters were averaged over 3D injury volumes. As expected, (A) lower fractional anisotropy and higher diffusivity values are apparent on the involved limb at the time of injury, indicating a disruption of muscle fibers. Diffusivity parameters begin to normalize at return to sport (22 days after injury) and 12 weeks after return to sport. (B) Disruption of fibers is also represented by the principal direction of diffusion (λ1) in the region of injury, as the observed direction of travel (medial/ lateral, red) differs from the expected (superior/ inferior, blue).
C
Figure 8.
Between limb differences (involved-uninvolved/uninvolved) in diffusivity parameters (A) in the region of injury following an acute hamstring strain injury in a collegiate athlete. Region of injury was defined via manual segmentation of edema on the T2w MR following injury. (B) The acute region of injury was registered to both follow-up scans and diffusivity parameters were averaged over 3D injury volumes. As expected, (A) lower fractional anisotropy and higher diffusivity values are apparent on the involved limb at the time of injury, indicating a disruption of muscle fibers. Diffusivity parameters begin to normalize at return to sport (22 days after injury) and 12 weeks after return to sport. (B) Disruption of fibers is also represented by the principal direction of diffusion (λ1) in the region of injury, as the observed direction of travel (medial/ lateral, red) differs from the expected (superior/ inferior, blue).


result
A
Figure #.
Figure Copy.
C
Figure #.
Figure Copy.
A
Figure 7.
(A) Conventional T2w and (C) quantitative DTI imaging from a representative collegiate athlete who sustained an index left hamstring strain injury of the biceps femoris long head. Conventional imaging is used to generate (B) individual muscle regions of interest (ROI) to be used in the analysis of diffusion imaging and can be used to monitor changes in muscle morphology following acute injury. (D) Muscle architecture changes are apparent through diffusion tensor imaging and derived muscle tractography images. (E) Diffusion parameters that can be used to monitor muscle morphology within individual muscles following injury include fractional anisotropy (FA), mean diffusivity (MD), radial diffusivity (RD) and eigen values (λ1, λ2, λ3). Quantitative values derived from tractography results include fiber length, fiber count and pennation angle.
C
Figure 7.
(A) Conventional T2w and (C) quantitative DTI imaging from a representative collegiate athlete who sustained an index left hamstring strain injury of the biceps femoris long head. Conventional imaging is used to generate (B) individual muscle regions of interest (ROI) to be used in the analysis of diffusion imaging and can be used to monitor changes in muscle morphology following acute injury. (D) Muscle architecture changes are apparent through diffusion tensor imaging and derived muscle tractography images. (E) Diffusion parameters that can be used to monitor muscle morphology within individual muscles following injury include fractional anisotropy (FA), mean diffusivity (MD), radial diffusivity (RD) and eigen values (λ1, λ2, λ3). Quantitative values derived from tractography results include fiber length, fiber count and pennation angle.
A
Figure #.
Figure Copy.
C
Figure #.
Figure Copy.
B
Figure 7.
(A) Conventional T2w and (C) quantitative DTI imaging from a representative collegiate athlete who sustained an index left hamstring strain injury of the biceps femoris long head. Conventional imaging is used to generate (B) individual muscle regions of interest (ROI) to be used in the analysis of diffusion imaging and can be used to monitor changes in muscle morphology following acute injury. (D) Muscle architecture changes are apparent through diffusion tensor imaging and derived muscle tractography images. (E) Diffusion parameters that can be used to monitor muscle morphology within individual muscles following injury include fractional anisotropy (FA), mean diffusivity (MD), radial diffusivity (RD) and eigen values (λ1, λ2, λ3). Quantitative values derived from tractography results include fiber length, fiber count and pennation angle.
D
Figure 7.
(A) Conventional T2w and (C) quantitative DTI imaging from a representative collegiate athlete who sustained an index left hamstring strain injury of the biceps femoris long head. Conventional imaging is used to generate (B) individual muscle regions of interest (ROI) to be used in the analysis of diffusion imaging and can be used to monitor changes in muscle morphology following acute injury. (D) Muscle architecture changes are apparent through diffusion tensor imaging and derived muscle tractography images. (E) Diffusion parameters that can be used to monitor muscle morphology within individual muscles following injury include fractional anisotropy (FA), mean diffusivity (MD), radial diffusivity (RD) and eigen values (λ1, λ2, λ3). Quantitative values derived from tractography results include fiber length, fiber count and pennation angle.
A
Figure #.
Figure Copy.
C
Figure #.
Figure Copy.
E
Figure 7.
(A) Conventional T2w and (C) quantitative DTI imaging from a representative collegiate athlete who sustained an index left hamstring strain injury of the biceps femoris long head. Conventional imaging is used to generate (B) individual muscle regions of interest (ROI) to be used in the analysis of diffusion imaging and can be used to monitor changes in muscle morphology following acute injury. (D) Muscle architecture changes are apparent through diffusion tensor imaging and derived muscle tractography images. (E) Diffusion parameters that can be used to monitor muscle morphology within individual muscles following injury include fractional anisotropy (FA), mean diffusivity (MD), radial diffusivity (RD) and eigen values (λ1, λ2, λ3). Quantitative values derived from tractography results include fiber length, fiber count and pennation angle.
3D Cube PD Flex
Figure 1.
Advanced knee protocol designed for the directed study to investigate longitudinal changes in quantitative and qualitative metrics in basketball and swimmer cohorts.
3D Cube PD Flex
Figure 1.
Advanced knee protocol designed for the directed study to investigate longitudinal changes in quantitative and qualitative metrics in basketball and swimmer cohorts.
3D Cube PD Flex
Figure 1.
Advanced knee protocol designed for the directed study to investigate longitudinal changes in quantitative and qualitative metrics in basketball and swimmer cohorts.
3D MAPSS‡
Figure 1.
Advanced knee protocol designed for the directed study to investigate longitudinal changes in quantitative and qualitative metrics in basketball and swimmer cohorts.
‡ Technology in development that represents ongoing research and development efforts. These technologies are not products and may never become products. Not for sale. Not cleared or approved by the US FDA or any other global regulator for commercial availability.
3D UTE‡
Figure 1.
Advanced knee protocol designed for the directed study to investigate longitudinal changes in quantitative and qualitative metrics in basketball and swimmer cohorts.
‡ Technology in development that represents ongoing research and development efforts. These technologies are not products and may never become products. Not for sale. Not cleared or approved by the US FDA or any other global regulator for commercial availability.
3D ZTE‡
Figure 1.
Advanced knee protocol designed for the directed study to investigate longitudinal changes in quantitative and qualitative metrics in basketball and swimmer cohorts.
‡ Technology in development that represents ongoing research and development efforts. These technologies are not products and may never become products. Not for sale. Not cleared or approved by the US FDA or any other global regulator for commercial availability.
‡ Technology in development that represents ongoing research and development efforts. These technologies are not products and may never become products. Not for sale. Not cleared or approved by the US FDA or any other global regulator for commercial availability.
‡ Technology in development that represents ongoing research and development efforts. These technologies are not products and may never become products. Not for sale. Not cleared or approved by the US FDA or any other global regulator for commercial availability.
‡ Technology in development that represents ongoing research and development efforts. These technologies are not products and may never become products. Not for sale. Not cleared or approved by the US FDA or any other global regulator for commercial availability.
PREVIOUS
${prev-page}
NEXT
${next-page}


Subscribe Now
Manage Subscription
FOLLOW US


contact us • privacy policy • terms & conditions
© 2023 GE HealthCare. GE is a trademark of the General Electric Company used under trademark license.
TECH TRENDS
GE Healthcare and NBA team up to advance understanding of injuries among basketball players
GE Healthcare and NBA team up to advance understanding of injuries among basketball players
by Maggie Fung, Director of Global MR MSK Imaging, Katharine Carter, M.Sc., Director of Medical Scientific Affairs and Robert D. Peters, PhD, Global MR Product Marketing Director, GE Healthcare, and Peter Meisel, MSPH, Director, Player Health, NBA
GE Healthcare previously collaborated with the National Football League (NFL) in the Head Health Initiative, which resulted in advancing the understanding of concussions and associated prevention strategies. With the success of that program, GE expanded its reach and teamed up with the National Basketball Association (NBA) in 2015 to form a strategic collaboration to promote orthopedic and sports medicine research benefitting the health and wellness of basketball players and athletes at all levels. This multi-year alliance involved over $5 million in research funding and focused on advancing our understanding of joint health, as well as acute and overuse musculoskeletal injuries. The program’s mission was to address high-priority clinical questions regarding the prevention, diagnosis and treatment of acute and overuse injuries among NBA athletes and, importantly, apply these findings to basketball players, other athletes and the general population. The collaboration included support from GE, the NBA, Adidas, Nike and Under Armour.
Research program aiming to address the most common basketball-related injuries
According to the NBA 2020–2021 season statistics, the most common injuries occurred in the knee, ankle, thigh and lower leg (see Table 1). In order to establish the research directions of the collaboration, the NBA and GE invited a diverse strategic advisory board, including NBA team physicians, musculoskeletal radiologists and research scientists, to define and develop four key areas of research focus:
- Knee and overload and articular cartilage injuries
- Patellar tendinopathy
- Acute myotendinous injuries
- Bone stress injuries

Table 1.
According to the NBA 2020-21 season statistics, these are the most common injuries leading to games missed.
Calls for proposals were announced for each of these areas, and 15 research projects from academic institutions around the world were selected and awarded funding in this competitive research program. Imaging modalities including MR, ultrasound, X-ray, CT, DEXA and other biomechanical assessments were employed to analyze various components in basketball and relevant sport injuries. Two directed multi-site research projects were also awarded to drive the advancement of MR imaging of basketball injuries in National Collegiate Athletic Association (NCAA) and NBA Draft Combine athletes. To date, an impressive 45 peer-reviewed journal publications and 136 conference presentations have been generated from this research collaboration. In addition, a team led by Dr. Brian Cole at Rush Medical Center and the Chicago Bulls worked with GE Healthcare to define a standardized multi-vendor knee and ankle MR imaging protocol that has been validated and recommended to NBA teams for clinically indicated and research use.
Knee and patellofemoral overload and articular cartilage injuries
Knee injury accounted for ~18% of injuries in NBA basketball players [2020- 2021 season] and it was clear that an understanding of overloading of the knee joint due to the high occurrence of jumping, cutting and pivoting movements was critical.
In one of the directed multi-site studies in this research program, Stanford University, Hospital of Special Surgery and University of California San Francisco acquired advanced longitudinal MR data in 60 subjects across multiple seasons in both NCAA basketball players (N=33) and swimmer controls (N=27) at the three sites. This advanced MR knee protocol consisted of conventional anatomy 2D FSE, T2 and T1ρ‡ cartilage relaxation time mapping, 3D Ultrashort TE T2* mapping‡ and Zero-TE bone imaging sequences (Figure 1). The study aimed to evaluate the structural and microstructural adaptations in elite basketball players, as well as how they track with activity during the collegiate season and offseason.
GE & NBA: Advanced knee protocol
2D FSE PD FatSat
- Clinical baseline sequences

3D Cube PD Flex
- Flex fat/water separation
- Compressed Sensing
- For cartilage & bone segmentation


3D MAPSS‡
- T2 and T1rho relaxometry for collagen & proteoglycan assessment (early markers of cartilage degenerations)


3D UTE‡
- T2* relaxometry in deep layer of cartilage, meniscus and patellar tendon, etc.

3D ZTE‡
- CT-like bone surface
- Visualization of cortical bone surfaces
- Now commercially available as oZTEo

Figure 1.
Advanced knee protocol designed for the directed study to investigate longitudinal changes in quantitative and qualitative metrics in basketball and swimmer cohorts.
As a sub-study, Garry Gold, MD, (Stanford University) and collaborators investigated the T2 and T1ρ changes pre- and post-season in the two cohorts.1 Quantitative MR, including T1ρ and T2 mapping, has been extensively used to probe biochemical changes in the articular cartilage. Increases in T2 and T1ρ are generally considered to be representative of collagen damage and loss of proteoglycan content.2,3
In the femoral articular cartilage of all athletes, a global decrease in T2 and T1ρ relaxation times during the competitive season and an increase in T2 and T1ρ relaxation times during the off-season was observed. The increase during the off-season could be explained by the increased activity during off-season workouts, which put more stress on their joints (Figure 2). In addition, in basketball players’ femoral cartilage, the anterior and central compartments respectively had the highest T2 and T1ρ relaxation times following the competitive season and off-season as compared to swimmers, indicative of the increased stress on the anterior femoral cartilage during repeated landing of jumps.

Figure 2.
Changes in T1ρ and T2 relaxation times between basketball players (BB) and swimmers (Swim) during competitive season (post-season-1 minus pre-season-1), off season (pre-season-2 minus post-season-1), and 1 year (pre-season-2 minus pre-season-1). In both graphs, circles represent outliers, and the whiskers indicate the 10th and 90th percentiles.
In another sub-study, Sharmila Majumdar, PhD, (UCSF) led a study using a voxel-based relaxometry pipeline to analyze this NCAA data and demonstrated a significant prolongation of T2 and T1ρ relaxation times in the medial femoral and tibial compartments and in the posterolateral femur in basketball players compared to swimmers.4 Furthermore, they observed depth-dependent differences with prolongation of the superficial layer in basketball players. The subchondral bone shape (e.g., relative sizes of the tibial plateaus, intercondylar eminences and the curvature and concavity of the patellar lateral facet) was also observed to be different between the two cohorts (Figure 3). This can potentially be explained by the difference in external loading, which is known to influence subchondral bone shape and thickness via bone remodeling.5,6

Figure 3.
Bone shapes demonstrated significant group differences in the tibia and patella between swimmers and basketball players. Tibia mode 2 relates to the size of the lateral plateau (top), tibia mode 7 primarily describes to relative heights of intercondylar spines (middle), and patella mode 4 shows the symmetry and curvature of medial and lateral facets (bottom).
Menisci status is also of interest as it works to absorb loads that develop across the joint and protect the underlying articular cartilage and bone. Acute meniscal injuries are often observed in basketball players resulting from high compressive forces at the knee joint. Hollis Potter, MD, et al. (Hospital of Special Surgery) analyzed UTE T2* values of the medial and lateral menisci in 30 NCAA collegiate athletes (14 basketball players and 16 swimmers) and observed significant compartmental difference in T2* metrics, likely reflecting the differences in structure and function between the medial and lateral menisci.7,8
Patellar Tendinopathy (PT)
One of the common injuries in basketball at both a professional and amateur level is patellar tendinopathy (PT), due to an overuse injury that occurs with frequent jumping, landing and cutting maneuvers. PT is commonly treated with physical therapy and anti-inflammatory medications. However, there is conflicting evidence that exercise therapy results in structural adaptation measured with clinically available imaging modalities (e.g., ultrasound and MR).9 Research in this area would help advance understanding of the structural changes in the tendon in response to different exercise strategies.
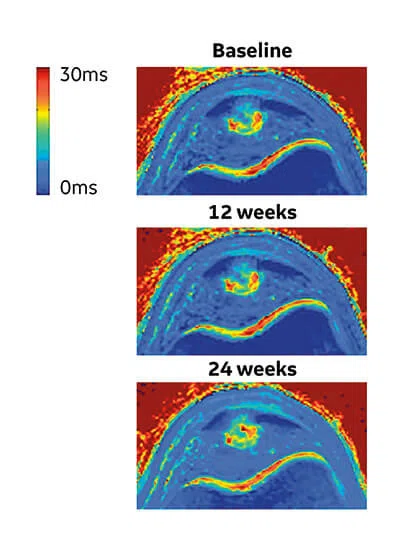
Edwin Oei, MD, PhD, et al. (Erasmus) conducted the JUMPER study, a randomized controlled trial investigating the effect of progressive tendonloading exercises (PTLE) vs. eccentric exercise therapy (EET) for PT. This study included 76 athletes with clinically diagnosed and ultrasound-confirmed PT and were randomized into two exercise groups. Subjects were imaged with MR (including 3D-UTE-MRI for T2* mapping) and ultrasound shear wave elastography (SWE) at baseline, 12 weeks and 24 weeks after injury. A VISA-P questionnaire was also used to assess symptoms. Key findings included:
- In patients with PT, PTLE resulted in a significantly better clinical outcome after 24 weeks than EET.10
- T2* relaxation times of the patellar tendon decreased significantly in athletes with PT performing exercise therapy at 24 weeks and this decrease was associated with improved clinical outcome (Figure 4).11
- PT was associated with significantly higher patellar tendon stiffness in ultrasound SWE. In addition, a decrease in patellar tendon stiffness during the early recovery phase corresponded to a better clinical outcome.12,13
A

B
Figure 4.
(A) Mono-exponential T2* maps using 3D-UTE at the proximal patellar tendon in a 19-year-old male volleyball player with clinically diagnosed and ultrasound-confirmed PT at baseline, 12 weeks and 24 weeks. (B) Scatter plot of unadjusted individual T2* relaxation times versus symptom severity as scored at baseline and after 12 and 24 weeks with the validated VISA-P questionnaire for PT. There was a significant association between a decrease in mono-exponential T2* within the degenerative tissue and clinical improvement (P =.005).
Ogonna Kenechi Nwawka, MD, et al. (Hospital of Special Surgery) studied the collegiate basketball population with both ultrasound shear wave elastography (SWE) and UTE T2* MRI. They observed significant and strong correlations between UTE T2* and SWE metrics in patients with patellar tendinopathy.14 Pre- and post-season analysis of data from 10 NCAA basketball players also demonstrated side-to-side differences in T2* metrics within and between timepoints. Dominant knees had significant T2* changes over time, which may suggest that patellar tendons of dominant and non-dominant knees experience and adapt to different loading conditions over a season of play. The T2* changes over time also strongly correlated with morphological PT grades, suggesting T2* could potentially be used to detect pathologic severity changes over time, which may suggest that patellar tendons of dominant and non-dominant knees experience and adapt to different loading conditions over a season of play. The T2* changes over time also strongly correlated with morphological PT grades, suggesting T2* could potentially be used to detect pathologic severity changes over time (Figure 5).15
Pre-season visit
Post-season visit

Left pateller tendon

Left pateller tendon

Right pateller tendon

Right pateller tendon
Figure 5.
Display of pre-season and post-season short T2* (T2*S) values in a collegiate basketball player. Both limbs display prolongation of T2*S from pre-season to post-season, however the patellar tendon of the left limb displays greater increase of T2*S as compared to the patellar tendon of right limb.

A

B
Figure 6.
(A) Sagittal T2*single [ms] MRI of PT demonstrating decreased T2* in the proximal patellar tendon (arrow). (B) Shows high correlation (R=0.668, p=0.006) between T2*single and loss of tendon stiffness (SWS).
Kenneth Lee, MD, MBA, et al. (University of Wisconsin-Madison) investigated in a randomized controlled trial the efficacy of platelet-rich plasma (PRP) therapy for PT, compared to dry-needling (DN) or sham injection (SH). UTE T2* MRI imaging and ultrasound shear wave speed (SWS) imaging were performed in 29 subjects at baseline, 16 weeks and 52 weeks after treatment to assess their ability to track changes in tendon healing and help predict return to play. Conventional and quantitative imaging results were correlated with pain scores, clinical surveys and biomechanical tests. Key findings included:
- PRP therapy was superior to DN and SH for providing pain relief and VISA-P scores at 52 weeks post-treatment.
- Ultrasound SWS may be a useful biomarker of tendon healing in patients with Jumper’s knee.16
- Increases in T2*single and T2*s were associated with loss of tendon stiffness, increased pain and disability.17
Brent Edwards, PhD, et al. (University of Calgary) asked the intriguing research question as to whether shoe or floor design had an impact on the mechanical stress and strain placed on the patellar tendon during basketball play. Dr. Edwards analyzed 30 collegiate and high school basketball players as they performed maximal countermovement jumps in each of three basketball shoes and on three wood court surfaces with varying compressive stiffness and energy-absorbing capacity. Motion capture, force platform and jump height data were collected during the jumping movements, MR was used to obtain participant-specific tendon morphology, and a combined dynamometry/ultrasound/EMG session was used to obtain tendon material properties. While the shoe or surface stiffness did not impact patellar tendon strain, they observed that landing in a less stiff shoe and on a stiffer surface significantly lowered Achilles tendon strain, which would increase the number of cycles before a tendon failure by 64-92%, or ~17-29 more basketball games.18 These results provided evidence that less stiff footwear and more energy absorption surface construction may be effective interventions to reduce the likelihood of Achilles tendinopathy without affecting jump performance in athletes.
Additionally, Dr. Edwards and team performed biomechanical sub-studies on the patellar tendon and, for the first time, quantified the relationship between patellar tendon strain, rate of stiffness degradation and rate of residual strain (i.e., creep) with the number of cycles to failure ex vivo,19 as well as established the reliability of shear wave elastography to provide non-invasive estimates of patellar tendon stiffness.20 The established relationships illustrated that using non-invasive methods to continuously monitor tendon strain may provide meaningful predictions of patellar tendon overuse injuries.
Myotendinous injuries
The hamstrings are one of the most commonly injured muscle group among athletes who perform running and jumping movements. Effective treatment of hamstring strain injury (HSI) remains a challenge, as demonstrated by an approximately one-third rate of injury recurrence within the first year. A better understanding of the risk factors associated with HSI could provide further insight into injury prevention.
Bryan Heiderscheit, PhD, et al. (University of Wisconsin- Madison) conducted research to determine whether conventional MR, novel quantitative MR (diffusion tensor imaging scalar parameters and tractography results) and ultrasound (shear wave speed) measures of muscle recovery, biomechanical measures and clinical assessment at the time of return to sport are predictive of injury recurrence. In a published case study of an athlete that sustained a HSI,21 denervation edema was observed using conventional T2- weighted MR in the acute stage as expected. However, even after three weeks of rehabilitation – during which the athlete was pain free, demonstrated full hamstring strength in clinical exam and had returned to competition – persistent denervation edema and muscle atrophy was observed. Eccentric strength testing also revealed that the involved limb was 15% weaker than the uninvolved limb. This case highlights that despite the athlete’s return to competition, imaging measures demonstrated persistent structural and architectural deficits of the injured hamstring muscle.
Diffusion tensor imaging (DTI) has been a promising area of quantitative muscle assessment in which the microstructural properties can be assessed via metrics such as fractional anisotropy (FA), mean diffusivity (MD) and radial diffusivity (RD). In a study of 16 collegiate athletes with HSI, Dr. Heiderscheit’s team observed a significant decrease in FA and a significant increase in MD, RD and eigen values λ2 and λ3 in the region of injury compared to the mirrored region of normal muscle. Fewer continuous fiber tracts were observed within the region of injury as compared to the contralateral side.22 Decreased FA and increased MD in regions of injured muscle indicate less restricted water diffusion, likely due to disruption of muscle fibers following injury. In addition, they observed that MR-negative HSI (i.e., grade 0: no edema) showed increased ultrasound shear wave speed, suggestive of increased muscle stiffness.23
E
Tractography results
- ROI geometry, volume
- Scaler diffusion parameters:
- FA, MD, RD, λ1, λ2, λ3
- Tractography results
- Fiber length and count
- Pennation angle
Figure 7.
(A) Conventional T2w and (C) quantitative DTI imaging from a representative collegiate athlete who sustained an index left hamstring strain injury of the biceps femoris long head. Conventional imaging is used to generate (B) individual muscle regions of interest (ROI) to be used in the analysis of diffusion imaging and can be used to monitor changes in muscle morphology following acute injury. (D) Muscle architecture changes are apparent through diffusion tensor imaging and derived muscle tractography images. (E) Diffusion parameters that can be used to monitor muscle morphology within individual muscles following injury include fractional anisotropy (FA), mean diffusivity (MD), radial diffusivity (RD) and eigen values (λ1, λ2, λ3). Quantitative values derived from tractography results include fiber length, fiber count and pennation angle.


A

B

C
Figure 8.
Between limb differences (involved-uninvolved/uninvolved) in diffusivity parameters (A) in the region of injury following an acute hamstring strain injury in a collegiate athlete. Region of injury was defined via manual segmentation of edema on the T2w MR following injury. (B) The acute region of injury was registered to both follow-up scans and diffusivity parameters were averaged over 3D injury volumes. As expected, (A) lower fractional anisotropy and higher diffusivity values are apparent on the involved limb at the time of injury, indicating a disruption of muscle fibers. Diffusivity parameters begin to normalize at return to sport (22 days after injury) and 12 weeks after return to sport. (B) Disruption of fibers is also represented by the principal direction of diffusion (λ1) in the region of injury, as the observed direction of travel (medial/ lateral, red) differs from the expected (superior/ inferior, blue).
E
Tractography results
- ROI geometry, volume
- Scaler diffusion parameters:
- FA, MD, RD, λ1, λ2, λ3
- Tractography results
- Fiber length and count
- Pennation angle
Figure 7.
(A) Conventional T2w and (C) quantitative DTI imaging from a representative collegiate athlete who sustained an index left hamstring strain injury of the biceps femoris long head. Conventional imaging is used to generate (B) individual muscle regions of interest (ROI) to be used in the analysis of diffusion imaging and can be used to monitor changes in muscle morphology following acute injury. (D) Muscle architecture changes are apparent through diffusion tensor imaging and derived muscle tractography images. (E) Diffusion parameters that can be used to monitor muscle morphology within individual muscles following injury include fractional anisotropy (FA), mean diffusivity (MD), radial diffusivity (RD) and eigen values (λ1, λ2, λ3). Quantitative values derived from tractography results include fiber length, fiber count and pennation angle.
Studying the repeatability and reproducibility of these quantitative techniques is also very important before these metrics can be used reliably to assess tissue changes. Johannes Tol, MD, PhD, et al. (Amsterdam UMC) studied the use of DTI in injured muscle tissue and developed tools for automated muscle segmentation. They demonstrated reproducibility of 3D muscle fiber Pennation angle and fascicle length measurements with different leg positions and time points.24,25 Prof. Tol further used these metrics to conduct a three-arm randomized controlled trial to investigate muscle structural changes after different exercise regimens (diver hamstring exercise N=24, Nordic hamstring exercise N=24, control N=24) over a 12-week period. They observed an increase in fascicle length of the semitendinosus muscle with the Nordic exercise group and a decrease in pennation angle of the biceps femoris with the diver exercise group (Figure 9). These unpublished findings could pave the way to assessing the effectiveness of various muscle injury prevention programs in elite sports population or to evaluate training programs in patients with muscle disorders.26

Figure 9 .
Fascicle length and Pennation angle differences over 12 weeks in different muscle groups between diver (red), Nordic (yellow) and control group (blue).
Suzi Edwards, PhD, et al. (University of Newcastle) are exploring an emerging method to measure muscle activation patterns called muscle functional MRI (mfMRI), where pre-exercise and post-exercise muscle metabolism differences (as measured with T2 relaxometry) indicate spatial muscle activation patterns.27 Dr. Edwards is currently undertaking a study to determine the spatial muscle activation patterns in the adductor muscles in athletes with a history of hip/groin pain following a multi-directional running task. mfMRI could prove to be an effective non-invasive tool to measure surface and deep muscle activity following exercise, as well as to predict muscle injury risk earlier.
Bone stress injuries
Bone stress injuries (BSI) are often observed in MR as hyperintense T2-weighted signal in the bone marrow, indicative of bone marrow edema. In the prevention of BSI, the design of foot orthotics might play a role in reducing stress to the player’s joint. Martin O’Malley, PhD, et al. (Hospital of Special Surgery) observed a reduction of Zone III (proximal diaphysis) strains with the use of foot orthotics and suggested that the effectiveness of orthotics to reduce strain is strongly influenced by individual foot structure.28,29
Another area of research in BSI prevention is assessing how bones are loaded during physical activity. Stuart Warden, PhD, (Indiana University-Purdue University Indianapolis) and Mariana Kersh, PhD, (University of Illinois at Urbana- Champaign) asked basketball players to perform different basketball activities while movements and forces were measured. Using a computational approach, the forces acting on the tibial bone during each activity were estimated and applied to a CT-based finite element model of the individual player’s tibia (Figure 10). The resultant temporal and spatial distribution of stresses and strains were calculated, enabling the investigators to show that sprinting and lateral cut maneuvers generated the greatest strains within the bone and that activities involving a rapid change in direction caused strains in different parts of the bone. This information will be used to inform preventative and management strategies for individuals with tibial bone stress injuries.30,31

Figure 10.
Players’ motion and applied CT-based finite element modeling to study strain on tibial bone.
Future of musculoskeletal MRI in sports medicine
MRI has been used in the diagnosis of sports medicine injury because of its excellent soft tissue contrast, and it has untapped potential to be used for assessing the healing process and providing more accurate prediction for return to play. Quantitative measurements such as T2*, T1ρ, T2, DTI and bone shape can provide insight into the tissue recovery process and more accurate methods to monitor treatment progress. The NBA’s and GE’s orthopedic and sports medicine collaboration has resulted in the development and clinical validation of these quantitative tools and will enable future research that can advance our understanding in sports injury diagnosis, prevention and treatment.
Contributors:
Stanford University: Feliks Kogan, PhD, and Garry Gold, MD
Hospital of Special Surgery: Hollis Potter, MD, Matt Koff, PhD, Erin Argentieri, PhD, Martin O’Malley, MD
University of San Francisco: Sharmila Majumdar, PhD, Valentina Pedoia, PhD
Erasmus Medical Center: Edwin Oei, MD, PhD
University of Wisconsin — Madison: Bryan Heiderscheit, PT, PhD, Kenneth Lee, MD, MBA, Christa Wille, DPT, PhD, Richard Kijowski, MD
University of Calgary: Brent Edwards, PhD
Amsterdam UMC: Johannes Tol, MD, PhD
University of Newcastle: Suzi Edwards, PhD
Indiana University-Purdue University: Stuart Warden, PhD, PT
University of Illinois at Urbana-Champaign: Mariana Kersh, PhD