A
Figure 1.
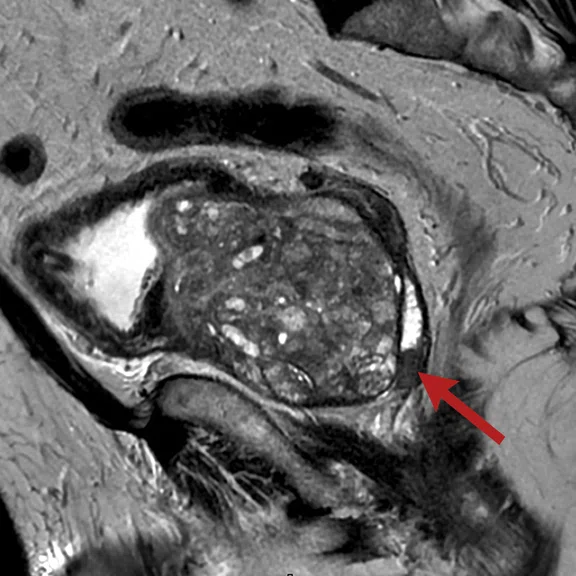
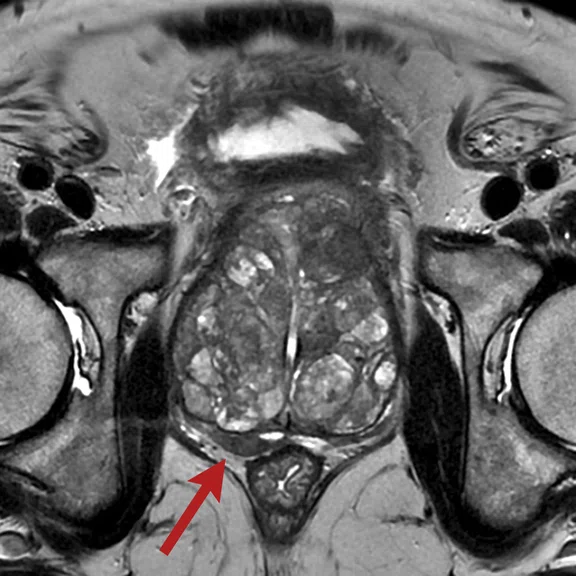
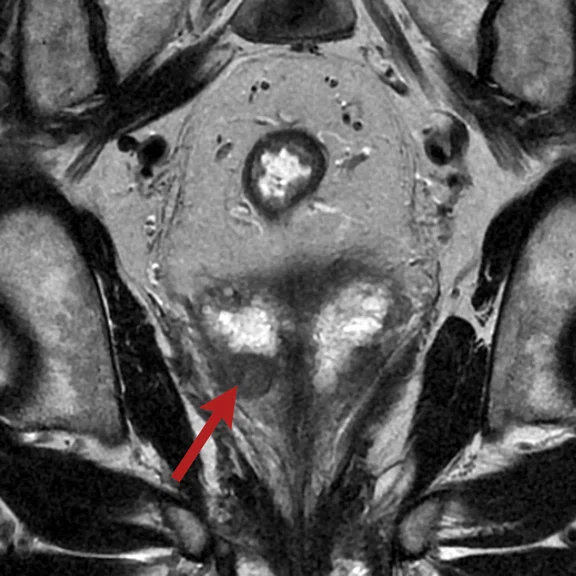
T2 FSE acquisition of the prostate with AIR™ Anterior Array Coil, (A) Sagittal T2 FSE, 0.6 x 0.7 x 3 mm, 3:15 min; (B) axial T2 FSE 0.5 x 0.6 x 3 mm, 4:27 min; and (C) coronal T2 FSE, 0.5 x 0.6 x 3 mm, 3:22 min.
B
Figure 1.
T2 FSE acquisition of the prostate with AIR™ Anterior Array Coil, (A) Sagittal T2 FSE, 0.6 x 0.7 x 3 mm, 3:15 min; (B) axial T2 FSE 0.5 x 0.6 x 3 mm, 4:27 min; and (C) coronal T2 FSE, 0.5 x 0.6 x 3 mm, 3:22 min.
C
Figure 1.
T2 FSE acquisition of the prostate with AIR™ Anterior Array Coil, (A) Sagittal T2 FSE, 0.6 x 0.7 x 3 mm, 3:15 min; (B) axial T2 FSE 0.5 x 0.6 x 3 mm, 4:27 min; and (C) coronal T2 FSE, 0.5 x 0.6 x 3 mm, 3:22 min.
A
Figure 2.
(A) Axial T2 FSE and FOCUS DWI acquired at (B) b50, (C) b400 and (D) b800; all images acquired at 1.9 x 1.9 x 3 mm, 4:38 min. MAGiC DWI with synthethic (E) b1500 and (F) b2000 and (G) ADC map.
B
Figure 2.
(A) Axial T2 FSE and FOCUS DWI acquired at (B) b50, (C) b400 and (D) b800; all images acquired at 1.9 x 1.9 x 3 mm, 4:38 min. MAGiC DWI with synthethic (E) b1500 and (F) b2000 and (G) ADC map.
E
Figure 2.
(A) Axial T2 FSE and FOCUS DWI acquired at (B) b50, (C) b400 and (D) b800; all images acquired at 1.9 x 1.9 x 3 mm, 4:38 min. MAGiC DWI with synthethic (E) b1500 and (F) b2000 and (G) ADC map.
C
Figure 2.
(A) Axial T2 FSE and FOCUS DWI acquired at (B) b50, (C) b400 and (D) b800; all images acquired at 1.9 x 1.9 x 3 mm, 4:38 min. MAGiC DWI with synthethic (E) b1500 and (F) b2000 and (G) ADC map.
F
Figure 2.
(A) Axial T2 FSE and FOCUS DWI acquired at (B) b50, (C) b400 and (D) b800; all images acquired at 1.9 x 1.9 x 3 mm, 4:38 min. MAGiC DWI with synthethic (E) b1500 and (F) b2000 and (G) ADC map.
D
Figure 2.
(A) Axial T2 FSE and FOCUS DWI acquired at (B) b50, (C) b400 and (D) b800; all images acquired at 1.9 x 1.9 x 3 mm, 4:38 min. MAGiC DWI with synthethic (E) b1500 and (F) b2000 and (G) ADC map.
G
Figure 2.
(A) Axial T2 FSE and FOCUS DWI acquired at (B) b50, (C) b400 and (D) b800; all images acquired at 1.9 x 1.9 x 3 mm, 4:38 min. MAGiC DWI with synthethic (E) b1500 and (F) b2000 and (G) ADC map.
A
Figure 3.
(A) DISCO acquisition with AIR™ AA Coil, 1.1 x 1.2 x 3 mm, temporal resolution 6.6 sec, total scan time 3:24 min., (B) dynamic enhancement curve generated by DISCO and (C) permeability maps created with GenIQ.
B
Figure 3.
(A) DISCO acquisition with AIR™ AA Coil, 1.1 x 1.2 x 3 mm, temporal resolution 6.6 sec, total scan time 3:24 min., (B) dynamic enhancement curve generated by DISCO and (C) permeability maps created with GenIQ.
C
Figure 3.
(A) DISCO acquisition with AIR™ AA Coil, 1.1 x 1.2 x 3 mm, temporal resolution 6.6 sec, total scan time 3:24 min., (B) dynamic enhancement curve generated by DISCO and (C) permeability maps created with GenIQ.
D
Figure 3.
(A) DISCO acquisition with AIR™ AA Coil, 1.1 x 1.2 x 3 mm, temporal resolution 6.6 sec, total scan time 3:24 min., (B) dynamic enhancement curve generated by DISCO and (C) permeability maps created with GenIQ.
E
Figure 3.
(A) DISCO acquisition with AIR™ AA Coil, 1.1 x 1.2 x 3 mm, temporal resolution 6.6 sec, total scan time 3:24 min., (B) dynamic enhancement curve generated by DISCO and (C) permeability maps created with GenIQ.
F
Figure 3.
(A) DISCO acquisition with AIR™ AA Coil, 1.1 x 1.2 x 3 mm, temporal resolution 6.6 sec, total scan time 3:24 min., (B) dynamic enhancement curve generated by DISCO and (C) permeability maps created with GenIQ.
A
Figure 4.
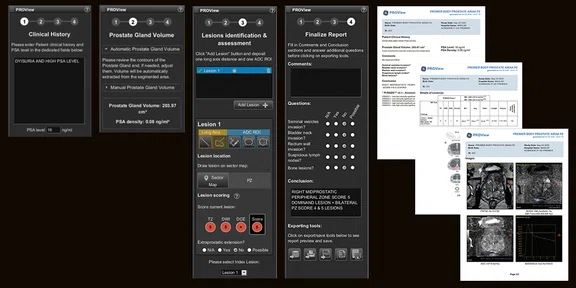
PROView 2.0 provides standardization of prostate reporting that aligns with the PI-RADS v2.1 reporting and integrates with standard dictation reporting systems.
1. Washino S, Okochi T, Saito K, Konishi T, Hirai M, Kobayashi Y, Miyagawa T. Combination of prostate imaging reporting and data system (PI-RADS) score and prostate-specific antigen (PSA) density predicts biopsy outcome in prostate biopsy naïve patients. BJU Int. 2017 Feb;119(2):225-233. doi: 10.1111/bju.13465. Epub 2016 Apr 1. PMID: 26935594.
2. Truong M, Stevens E, Ward R, et al. Clinical utility of PSA density and PI-RADS for deferring biopsy for the detection of clinically significant prostate cancer. J Clin Oncol, February 20, 2020;8(suppl 6):298-298.
A
Figure 2.
(A) Axial T2 FSE and FOCUS DWI acquired at (B) b50, (C) b400 and (D) b800; all images acquired at 1.9 x 1.9 x 3 mm, 4:38 min. MAGiC DWI with synthethic (E) b1500 and (F) b2000 and (G) ADC map.
B
Figure 2.
(A) Axial T2 FSE and FOCUS DWI acquired at (B) b50, (C) b400 and (D) b800; all images acquired at 1.9 x 1.9 x 3 mm, 4:38 min. MAGiC DWI with synthethic (E) b1500 and (F) b2000 and (G) ADC map.
E
Figure 2.
(A) Axial T2 FSE and FOCUS DWI acquired at (B) b50, (C) b400 and (D) b800; all images acquired at 1.9 x 1.9 x 3 mm, 4:38 min. MAGiC DWI with synthethic (E) b1500 and (F) b2000 and (G) ADC map.
C
Figure 2.
(A) Axial T2 FSE and FOCUS DWI acquired at (B) b50, (C) b400 and (D) b800; all images acquired at 1.9 x 1.9 x 3 mm, 4:38 min. MAGiC DWI with synthethic (E) b1500 and (F) b2000 and (G) ADC map.
F
Figure 2.
(A) Axial T2 FSE and FOCUS DWI acquired at (B) b50, (C) b400 and (D) b800; all images acquired at 1.9 x 1.9 x 3 mm, 4:38 min. MAGiC DWI with synthethic (E) b1500 and (F) b2000 and (G) ADC map.
D
Figure 2.
(A) Axial T2 FSE and FOCUS DWI acquired at (B) b50, (C) b400 and (D) b800; all images acquired at 1.9 x 1.9 x 3 mm, 4:38 min. MAGiC DWI with synthethic (E) b1500 and (F) b2000 and (G) ADC map.
G
Figure 2.
(A) Axial T2 FSE and FOCUS DWI acquired at (B) b50, (C) b400 and (D) b800; all images acquired at 1.9 x 1.9 x 3 mm, 4:38 min. MAGiC DWI with synthethic (E) b1500 and (F) b2000 and (G) ADC map.
A
Figure 3.
(A) DISCO acquisition with AIR™ AA Coil, 1.1 x 1.2 x 3 mm, temporal resolution 6.6 sec, total scan time 3:24 min., (B) dynamic enhancement curve generated by DISCO and (C) permeability maps created with GenIQ.
B
Figure 3.
(A) DISCO acquisition with AIR™ AA Coil, 1.1 x 1.2 x 3 mm, temporal resolution 6.6 sec, total scan time 3:24 min., (B) dynamic enhancement curve generated by DISCO and (C) permeability maps created with GenIQ.
C
Figure 3.
(A) DISCO acquisition with AIR™ AA Coil, 1.1 x 1.2 x 3 mm, temporal resolution 6.6 sec, total scan time 3:24 min., (B) dynamic enhancement curve generated by DISCO and (C) permeability maps created with GenIQ.
D
Figure 3.
(A) DISCO acquisition with AIR™ AA Coil, 1.1 x 1.2 x 3 mm, temporal resolution 6.6 sec, total scan time 3:24 min., (B) dynamic enhancement curve generated by DISCO and (C) permeability maps created with GenIQ.
E
Figure 3.
(A) DISCO acquisition with AIR™ AA Coil, 1.1 x 1.2 x 3 mm, temporal resolution 6.6 sec, total scan time 3:24 min., (B) dynamic enhancement curve generated by DISCO and (C) permeability maps created with GenIQ.
F
Figure 3.
(A) DISCO acquisition with AIR™ AA Coil, 1.1 x 1.2 x 3 mm, temporal resolution 6.6 sec, total scan time 3:24 min., (B) dynamic enhancement curve generated by DISCO and (C) permeability maps created with GenIQ.
result


PREVIOUS
${prev-page}
NEXT
${next-page}
Subscribe Now
Manage Subscription
FOLLOW US
Contact Us • Cookie Preferences • Privacy Policy • California Privacy PolicyDo Not Sell or Share My Personal Information • Terms & Conditions • Security
© 2024 GE HealthCare. GE is a trademark of General Electric Company. Used under trademark license.
CASE STUDIES
Multi-parametric prostate MR imaging with structured reporting
Multi-parametric prostate MR imaging with structured reporting
by Ercan Karaarslan, MD, Professor of Radiology, Acibadem Maslak Hospital, Istanbul, Turkey
The clinical demand for multi-parametric MR imaging continues to grow as it provides important information for patient management decisions. With prostate cancer, there is a range of biologic activity; in many patient cases, it is a slow-growing disease that does not lead to a prostate-cancer related death and in others it can be a very aggressive form. Considering that several treatment options have significant side effects such as rectal injury, incontinence and impotence, patient disease stratification and staging is imperative.
Technological advancements around oncologic imaging, in general, have enabled us to diagnose at an earlier stage, allowing us to more closely personalize patient treatment and, in many cases, utilize less invasive treatment methods. Our hospital also specializes in interventional radiology and prostate surgery with more than 1,000 patients receiving MR/Ultrasound fusion prostate biopsy or robotic surgery in the last few years.
In February 2020, a SIGNA™ Premier 3.0T was installed in our facility, providing new capabilities such as the AIR™ Anterior Array (AA) Coil and SIGNA™Works AIR™ Edition software featuring MUSE, FOCUS DWI, MAGiC DWI and DISCO. These capabilities provided a wing-to-wing solution for prostate imaging that improves image quality, the reporting process and patient comfort.
The patient experience is vastly improved, which has positively impacted compliance and, therefore, image quality. Patients have commented on the difference in comfort with the AIR™ AA Coil compared to conventional coils. They do not feel the same pressure on their body as with a conventional coil due to the lightweight nature of the AIR™ AA Coil. With SIGNA™ Premier, patients enter the bore feet-first so their head is near the edge of the magnet, reducing claustrophobia.
Patient history
An 85-year-old male with dysuria was referred by his urologist for prostate MR assessment.
Results
Patient has a right mid-prostatic peripheral zone with a score 5 dominant lesion and bilateral peripheral zone with score 4 and 5 lesions.
Discussion
The combination of FOCUS DWI with MAGiC DWI improves SNR and image quality for high b-value DWI information and also improves the resolution in small FOV DWI applications. MUSE is preferred for challenging patients with the presence of rectal gas, where the air-tissue interfaces increase susceptibility artifacts on DWI, making prostate peripheral zone assessment difficult. Compared to single-shot techniques, multi-shot MUSE is highly immune to susceptibility and the switching of frequency encoding direction to A-P (Phase read-out to R-L) also helps to minimize susceptibility artifacts in the peripheral zone. Using DISCO for dynamic contrast enhancement (DCE) imaging delivers both high temporal and spatial resolution with FatSat. We further analyze this data using GenIQ for permeability analysis on our AW Server platform.
PROView 2.0 is designed to provide standardization of prostate reporting to allow for interdisciplinary agreement between the urologist and radiologist for patient follow-up. The PSA density and accuracy of prostate volume are important values in the follow-up of PI-RADS® category 3 patients who may be deferred for repeat biopsy1,2. Patients classified as PI-RADS® category 3 may have a low risk of clinically significant prostate cancer, and therefore may not require repeat biopsy. Our existing reporting method utilizes a standard ellipsoid measurement model (length × width × height × 0.52 mm) for prostate volume assessment.
The PROView edge
PROView 2.0 is a review and reporting tool for prostate MR that applies the PI-RADS® v2.1 guidelines for the evaluation of prostate cancer. Its latest feature is designed to automate prostate segmentation‡ through the power of deep learning and calculated volume measurements to deliver consistent quantification results, no matter who is processing the imaging data.
The system has a guided workflow for simple and standardized assessment that includes an intelligent display of multi-parametric prostate MR series along with a clinical history of the patient’s PSA levels. It aligns with the PI-RADS® v2.1 reporting and integrates with standard dictation reporting systems. The report includes automated contouring and measurement of the prostate gland that, together with PSA level, help determine the PSA density (PSAD), which is relevant to the size of the prostate.
PROView also includes tools designed for lesion localization and for reporting on a PI-RADS® sector map, including:
- Lesion mapping to sectors and measurement for peripheral and transitional zones.
- Scoring of T2-weighted, DWI with integrated apparent diffusion coefficient (ADC) maps, and, when applicable, DCE acquisitions.
Reports are automatically generated along with all measurements and images, and these can be exported into HTML for seamless integration into external reporting solutions or saved through PDF and DICOM to PACS. PROView also allows physicians to select key images and manage them at any time during the review and embed in the report for referring physicians.


