1. Andre JB, Bresnahan BW, Mossa-Basha M, et al. Toward Quantifying the Prevalence, Severity, and Cost Associated With Patient Motion During Clinical MR Examinations. J Am Coll Radiol. 2015 Jul;12(7):689-95.
Andre JB, Bresnahan BW, Mossa-Basha M, et al. Toward Quantifying the Prevalence, Severity, and Cost Associated With Patient Motion During Clinical MR Examinations. J Am Coll Radiol. 2015 Jul;12(7):689-95.
A
Figure 2.
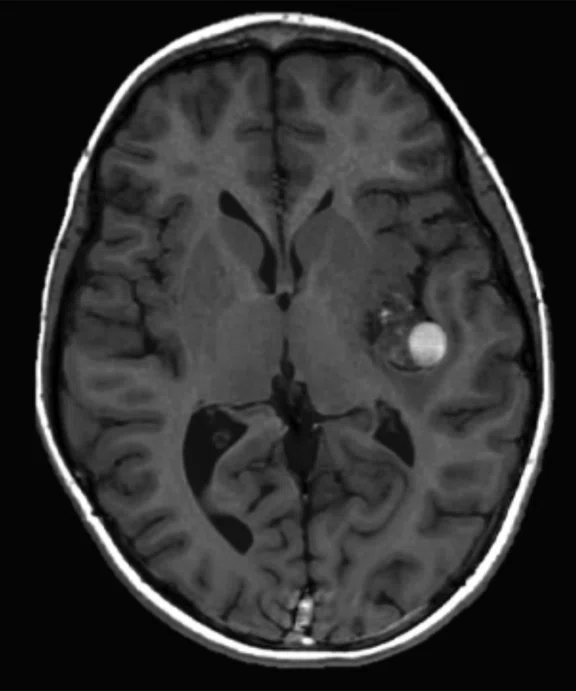
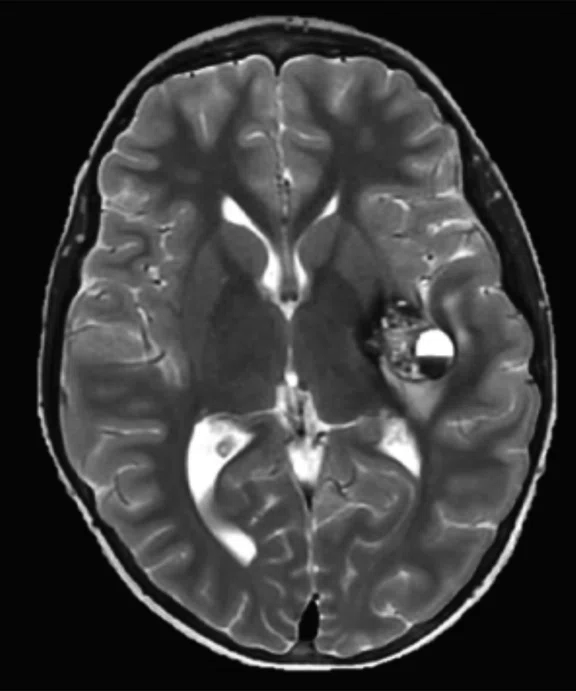
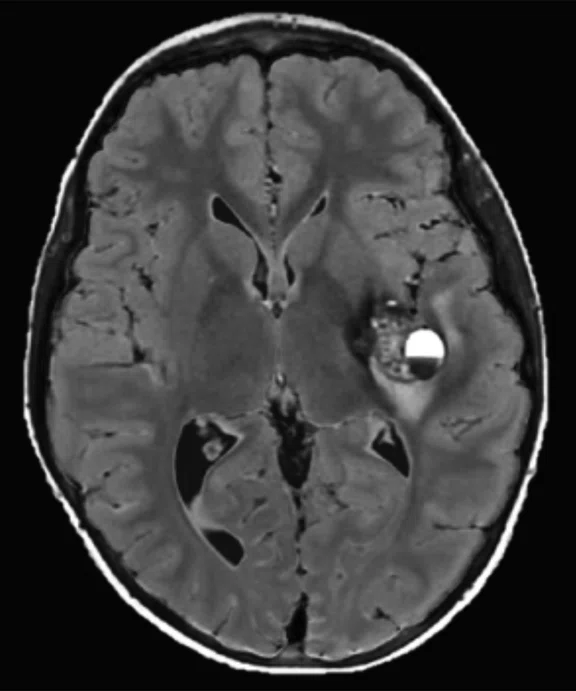
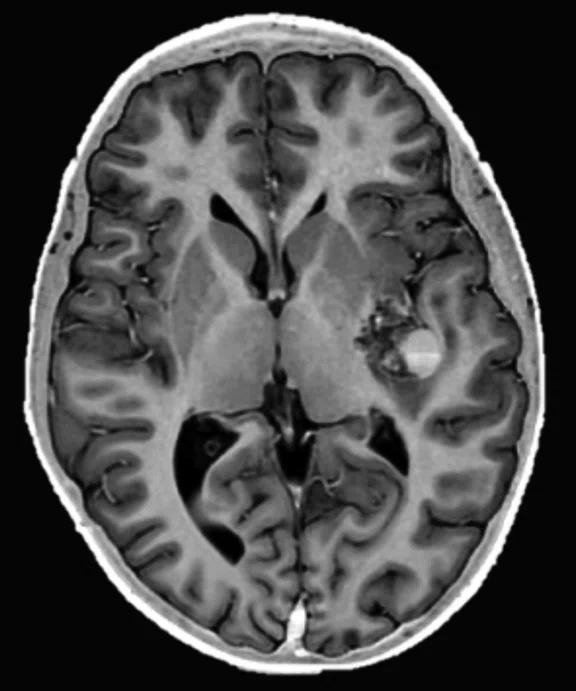
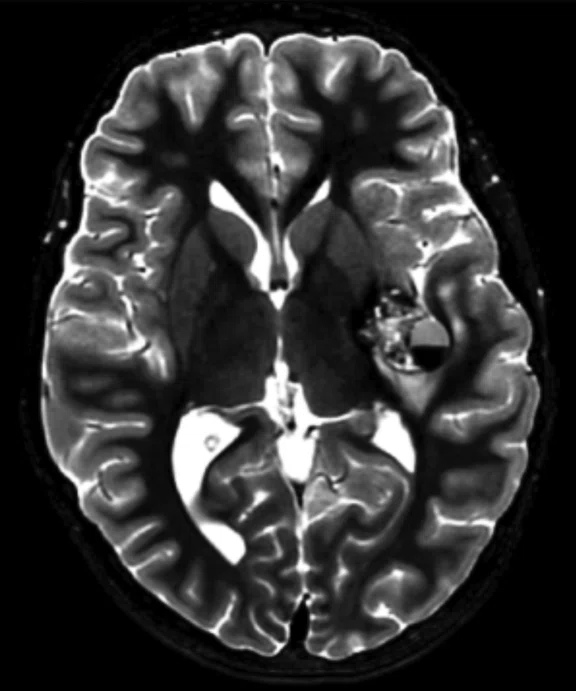
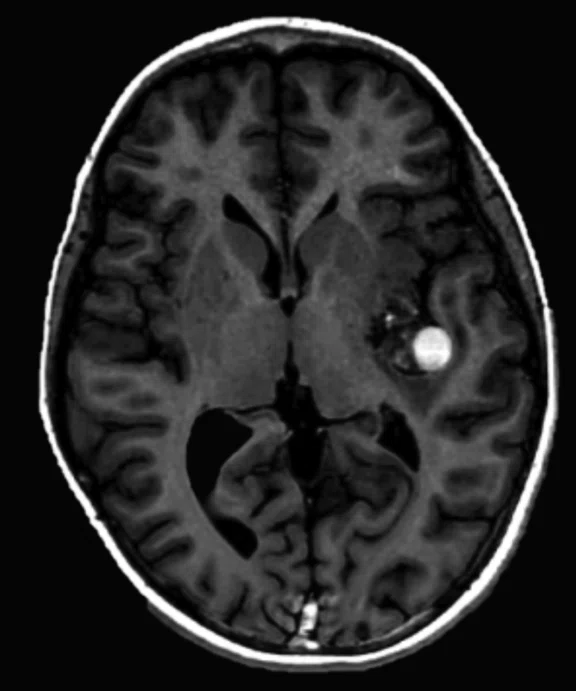
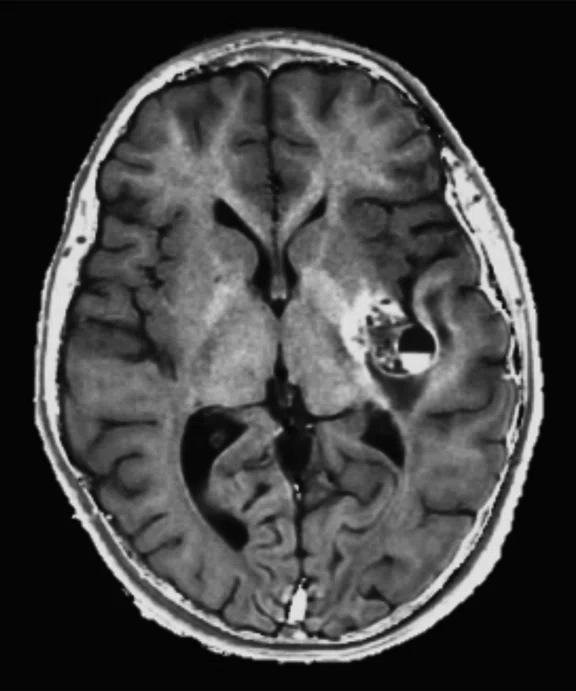
An eight-year-old patient pre-epileptic surgery exam. Conventional contrast (top row) and parametric maps (bottom row) were all generated in one 5 min. scan. (A) T1w, (B) T2w, (C) T2 FLAIR‡, (D) PSIR, (E) STIR, (F) T1 FLAIR, (G) PD, (H) T1, (I) T2, (J) R1=1/T1, (K) R2=1/T2. Images acquired on a Discovery™ MR750w GEM. Images courtesy of Queen Silvia Hospital, Sweden.
B
Figure 2.
An eight-year-old patient pre-epileptic surgery exam. Conventional contrast (top row) and parametric maps (bottom row) were all generated in one 5 min. scan. (A) T1w, (B) T2w, (C) T2 FLAIR‡, (D) PSIR, (E) STIR, (F) T1 FLAIR, (G) PD, (H) T1, (I) T2, (J) R1=1/T1, (K) R2=1/T2. Images acquired on a Discovery™ MR750w GEM. Images courtesy of Queen Silvia Hospital, Sweden.
C
Figure 2.
An eight-year-old patient pre-epileptic surgery exam. Conventional contrast (top row) and parametric maps (bottom row) were all generated in one 5 min. scan. (A) T1w, (B) T2w, (C) T2 FLAIR‡, (D) PSIR, (E) STIR, (F) T1 FLAIR, (G) PD, (H) T1, (I) T2, (J) R1=1/T1, (K) R2=1/T2. Images acquired on a Discovery™ MR750w GEM. Images courtesy of Queen Silvia Hospital, Sweden.
D
Figure 2.
An eight-year-old patient pre-epileptic surgery exam. Conventional contrast (top row) and parametric maps (bottom row) were all generated in one 5 min. scan. (A) T1w, (B) T2w, (C) T2 FLAIR‡, (D) PSIR, (E) STIR, (F) T1 FLAIR, (G) PD, (H) T1, (I) T2, (J) R1=1/T1, (K) R2=1/T2. Images acquired on a Discovery™ MR750w GEM. Images courtesy of Queen Silvia Hospital, Sweden.
E
Figure 2.
An eight-year-old patient pre-epileptic surgery exam. Conventional contrast (top row) and parametric maps (bottom row) were all generated in one 5 min. scan. (A) T1w, (B) T2w, (C) T2 FLAIR‡, (D) PSIR, (E) STIR, (F) T1 FLAIR, (G) PD, (H) T1, (I) T2, (J) R1=1/T1, (K) R2=1/T2. Images acquired on a Discovery™ MR750w GEM. Images courtesy of Queen Silvia Hospital, Sweden.
F
Figure 2.
An eight-year-old patient pre-epileptic surgery exam. Conventional contrast (top row) and parametric maps (bottom row) were all generated in one 5 min. scan. (A) T1w, (B) T2w, (C) T2 FLAIR‡, (D) PSIR, (E) STIR, (F) T1 FLAIR, (G) PD, (H) T1, (I) T2, (J) R1=1/T1, (K) R2=1/T2. Images acquired on a Discovery™ MR750w GEM. Images courtesy of Queen Silvia Hospital, Sweden.
G
Figure 2.
An eight-year-old patient pre-epileptic surgery exam. Conventional contrast (top row) and parametric maps (bottom row) were all generated in one 5 min. scan. (A) T1w, (B) T2w, (C) T2 FLAIR‡, (D) PSIR, (E) STIR, (F) T1 FLAIR, (G) PD, (H) T1, (I) T2, (J) R1=1/T1, (K) R2=1/T2. Images acquired on a Discovery™ MR750w GEM. Images courtesy of Queen Silvia Hospital, Sweden.
H
Figure 2.
An eight-year-old patient pre-epileptic surgery exam. Conventional contrast (top row) and parametric maps (bottom row) were all generated in one 5 min. scan. (A) T1w, (B) T2w, (C) T2 FLAIR‡, (D) PSIR, (E) STIR, (F) T1 FLAIR, (G) PD, (H) T1, (I) T2, (J) R1=1/T1, (K) R2=1/T2. Images acquired on a Discovery™ MR750w GEM. Images courtesy of Queen Silvia Hospital, Sweden.
I
Figure 2.
An eight-year-old patient pre-epileptic surgery exam. Conventional contrast (top row) and parametric maps (bottom row) were all generated in one 5 min. scan. (A) T1w, (B) T2w, (C) T2 FLAIR‡, (D) PSIR, (E) STIR, (F) T1 FLAIR, (G) PD, (H) T1, (I) T2, (J) R1=1/T1, (K) R2=1/T2. Images acquired on a Discovery™ MR750w GEM. Images courtesy of Queen Silvia Hospital, Sweden.
J
Figure 2.
An eight-year-old patient pre-epileptic surgery exam. Conventional contrast (top row) and parametric maps (bottom row) were all generated in one 5 min. scan. (A) T1w, (B) T2w, (C) T2 FLAIR‡, (D) PSIR, (E) STIR, (F) T1 FLAIR, (G) PD, (H) T1, (I) T2, (J) R1=1/T1, (K) R2=1/T2. Images acquired on a Discovery™ MR750w GEM. Images courtesy of Queen Silvia Hospital, Sweden.
K
Figure 2.
An eight-year-old patient pre-epileptic surgery exam. Conventional contrast (top row) and parametric maps (bottom row) were all generated in one 5 min. scan. (A) T1w, (B) T2w, (C) T2 FLAIR‡, (D) PSIR, (E) STIR, (F) T1 FLAIR, (G) PD, (H) T1, (I) T2, (J) R1=1/T1, (K) R2=1/T2. Images acquired on a Discovery™ MR750w GEM. Images courtesy of Queen Silvia Hospital, Sweden.
‡ It is recommended to acquire conventional T2 FLAIR images in addition to MAGiC.
A
Figure 3.
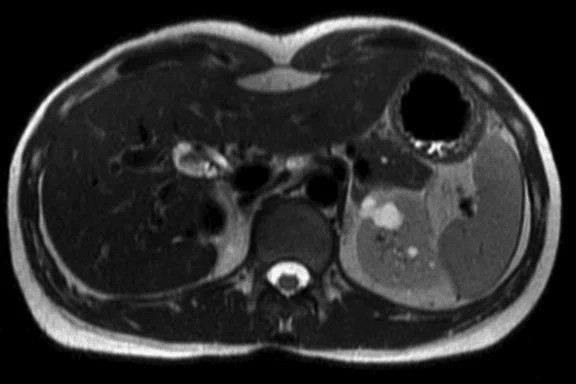
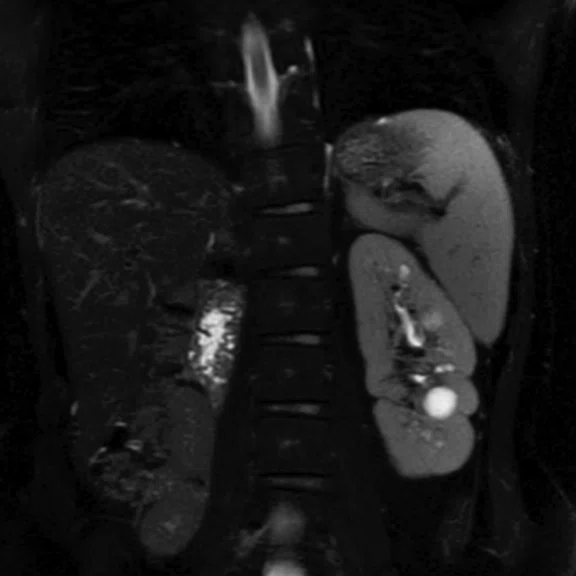
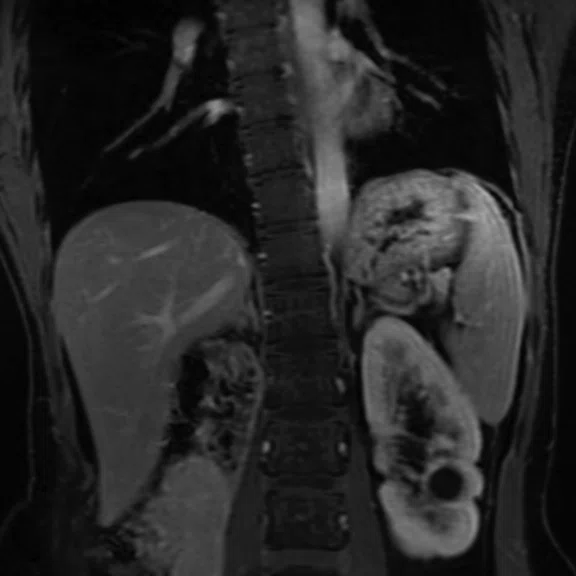
DISCO with Auto Navigator enables a free-breathing dynamic DCE liver exam with high resolution. (A) Axial T2 SSFSE 352 x 224, 4 mm slice, scan time of 40 sec.; (B) Coronal T2 SSFSE, 320 x 224, 4 mm slice, scan time of 33 sec.; and (C) Coronal Turbo LAVA, 320 x 192, 3 mm slice, scan time of 19 sec. Images courtesy of Seirei Hamamatsu Hospital, Japan.
B
Figure 3.
DISCO with Auto Navigator enables a free-breathing dynamic DCE liver exam with high resolution. (A) Axial T2 SSFSE 352 x 224, 4 mm slice, scan time of 40 sec.; (B) Coronal T2 SSFSE, 320 x 224, 4 mm slice, scan time of 33 sec.; and (C) Coronal Turbo LAVA, 320 x 192, 3 mm slice, scan time of 19 sec. Images courtesy of Seirei Hamamatsu Hospital, Japan.
C
Figure 3.
DISCO with Auto Navigator enables a free-breathing dynamic DCE liver exam with high resolution. (A) Axial T2 SSFSE 352 x 224, 4 mm slice, scan time of 40 sec.; (B) Coronal T2 SSFSE, 320 x 224, 4 mm slice, scan time of 33 sec.; and (C) Coronal Turbo LAVA, 320 x 192, 3 mm slice, scan time of 19 sec. Images courtesy of Seirei Hamamatsu Hospital, Japan.
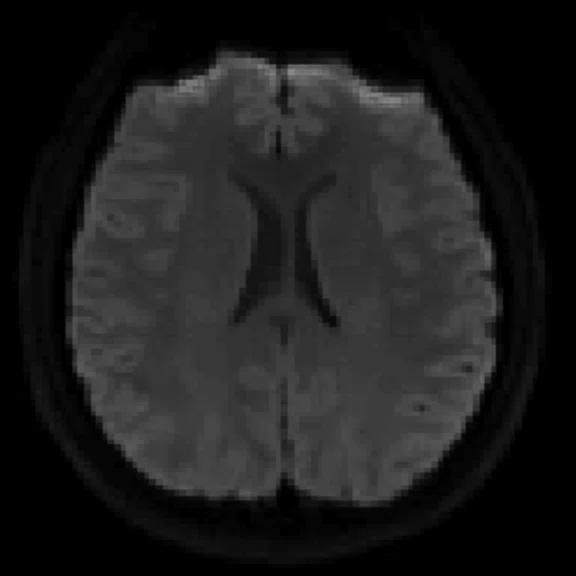
A
Figure 4.
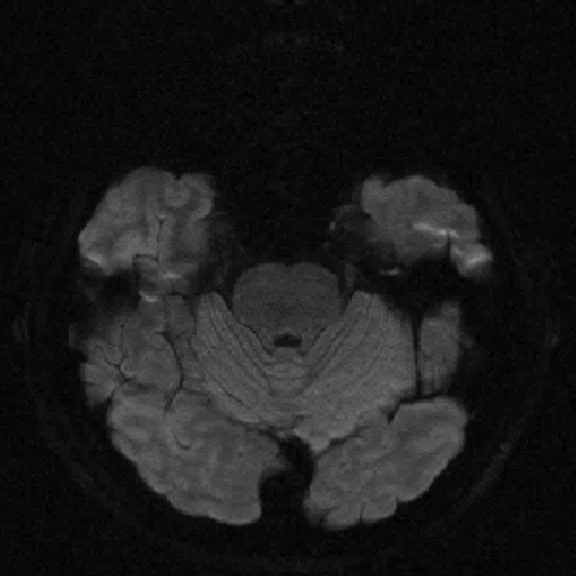
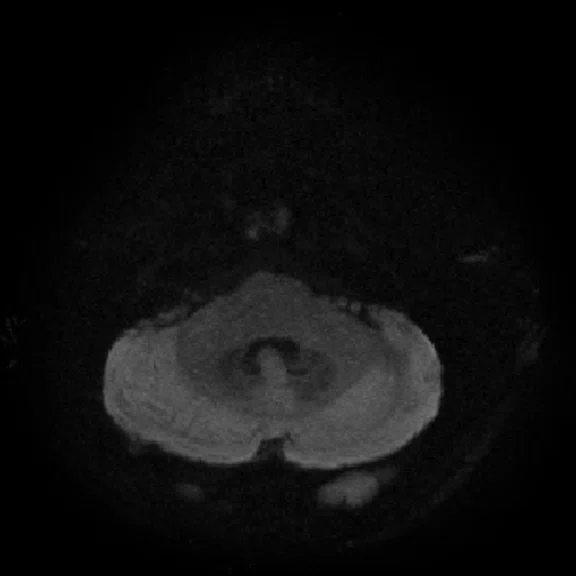
MUSE allows for advanced diffusion with reduced distortion and increased resolution. (A-C) SS diffusion, 2 x 2 x 3 mm. (D-F) 16-shot MUSE, 0.75 x 0.75 x 3 mm. Images courtesy of Duke University, North Carolina, USA.
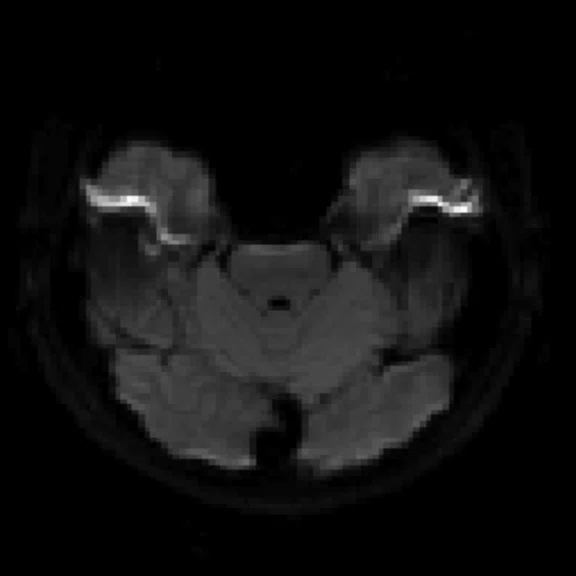
B
Figure 4.
MUSE allows for advanced diffusion with reduced distortion and increased resolution. (A-C) SS diffusion, 2 x 2 x 3 mm. (D-F) 16-shot MUSE, 0.75 x 0.75 x 3 mm. Images courtesy of Duke University, North Carolina, USA.
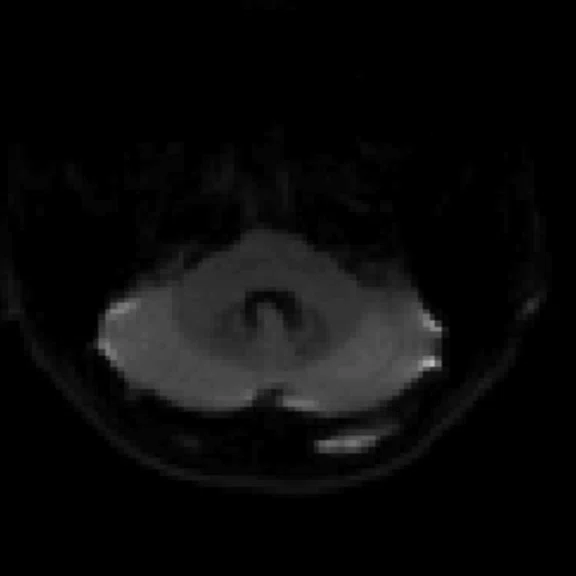
C
Figure 4.
MUSE allows for advanced diffusion with reduced distortion and increased resolution. (A-C) SS diffusion, 2 x 2 x 3 mm. (D-F) 16-shot MUSE, 0.75 x 0.75 x 3 mm. Images courtesy of Duke University, North Carolina, USA.
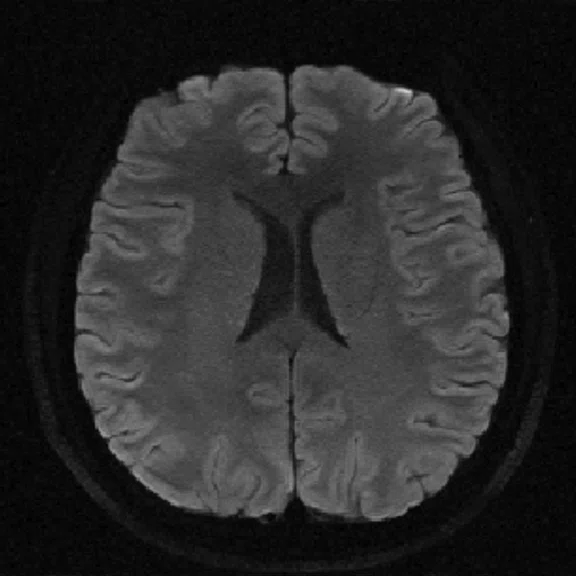
D
Figure 4.
MUSE allows for advanced diffusion with reduced distortion and increased resolution. (A-C) SS diffusion, 2 x 2 x 3 mm. (D-F) 16-shot MUSE, 0.75 x 0.75 x 3 mm. Images courtesy of Duke University, North Carolina, USA.
E
Figure 4.
MUSE allows for advanced diffusion with reduced distortion and increased resolution. (A-C) SS diffusion, 2 x 2 x 3 mm. (D-F) 16-shot MUSE, 0.75 x 0.75 x 3 mm. Images courtesy of Duke University, North Carolina, USA.
F
Figure 4.
MUSE allows for advanced diffusion with reduced distortion and increased resolution. (A-C) SS diffusion, 2 x 2 x 3 mm. (D-F) 16-shot MUSE, 0.75 x 0.75 x 3 mm. Images courtesy of Duke University, North Carolina, USA.
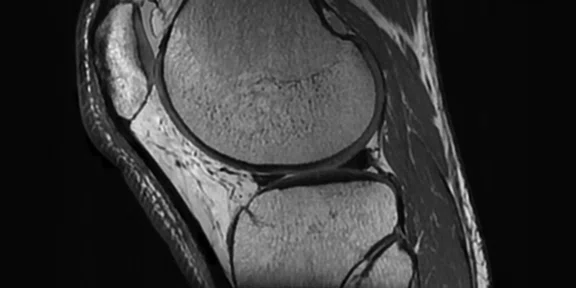
A
Figure 1.
Cube PD with HyperSense and ARC enables a 10-min isotropic knee exam. (A) Cube PD with HyperSense and ARC; (B) Cube PD FatSat with HyperSense and ARC. Both sequences acquired in 5 min TE/TR = min/1000 ms, FOV 16 cm, ARC 2 x 2, HyperSense factor of 1.2, 0.5 mm isotropic.
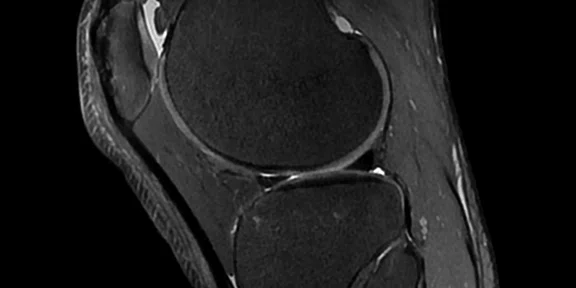
B
Figure 1.
Cube PD with HyperSense and ARC enables a 10-min isotropic knee exam. (A) Cube PD with HyperSense and ARC; (B) Cube PD FatSat with HyperSense and ARC. Both sequences acquired in 5 min TE/TR = min/1000 ms, FOV 16 cm, ARC 2 x 2, HyperSense factor of 1.2, 0.5 mm isotropic.
1. Andre JB, Bresnahan BW, Mossa-Basha M, et al. Toward Quantifying the Prevalence, Severity, and Cost Associated With Patient Motion During Clinical MR Examinations. J Am Coll Radiol. 2015 Jul;12(7):689-95.
1. Andre JB, Bresnahan BW, Mossa-Basha M, et al. Toward Quantifying the Prevalence, Severity, and Cost Associated With Patient Motion During Clinical MR Examinations. J Am Coll Radiol. 2015 Jul;12(7):689-95.
PREVIOUS
${prev-page}
NEXT
${next-page}


Subscribe Now
Manage Subscription
FOLLOW US
contact us • privacy policy • terms & conditions
© 2023 GE HealthCare. GE is a trademark of the General Electric Company used under trademark license.
result


Dr. First Last
Institure or Hospital
Location
Dr. First Last
Institure or Hospital
Location
TECH TRENDS
SIGNA™ Works: tuned for productivity and efficient workflows
SIGNA™ Works: tuned for productivity and efficient workflows
By Steve Lawson, RT(R)(MR), Global MR Clinical Marketing Manager, and Heide Harris, RT(R)(MR), Global Product Marketing Director, MR Applications and Visualization, GE Healthcare
Patient motion and magnetic field distortions, such as susceptibility effects, are common issues impacting image quality and efficiency (e.g., scan times) in MR imaging. GE Healthcare provides an array of sequences and solutions designed to take MR to the next level of productivity. Even better, SIGNA™Works is value-added technology that is upgradable and customizable to meet the specific needs of different practices.
Patient motion and magnetic field distortions, such as susceptibility effects, are common issues impacting image quality and efficiency (e.g., scan times) in MR imaging. GE Healthcare provides an array of sequences and solutions designed to take MR to the next level of productivity. Even better, SIGNA™Works is value-added technology that is upgradable and customizable to meet the specific needs of different practices.
MR is one of the most complex imaging studies a radiologic technologist acquires. From patient positioning with phased array coils to determining the precise prescription for the imaging study, there are many variables that can impact not only the quality of the study but the efficiency and productivity of technologists and the MR system.
One of the most common issues impacting productivity is patient motion. In a published study, a retrospective review of one calendar week of MR exams found significant motion artifacts on sequences in 19.8 percent of the total completed MR exams.1 The authors estimated the potential cost to the hospital to be $592 per hour in lost revenue and a median revenue foregone of approximately $115,000 per scanner, per year.1
Respiratory motion is a leading cause of artifacts degrading imaging quality. Many elderly or acutely ill patients cannot hold their breath for the duration of the acquisition. Other causes of motion artifacts include cardiac movement and CSF pulsation/blood flow.
One approach to reducing motion artifacts is to increase scanning speed to decrease overall MR exam times. This can be accomplished with parallel imaging and compressed sensing techniques, which can also have the added impact of reducing total scan time and potentially enabling additional scheduling slots. For respiratory motion, there are free-breathing techniques for patients that cannot hold their breath, including respiratory-gating, respiratory-triggered and Auto Navigator techniques.
TECH TRENDS
SIGNA™ Works: tuned for productivity and efficient workflows
By Steve Lawson, RT(R)(MR), Global MR Clinical Marketing Manager, and Heide Harris, RT(R)(MR), Global Product Marketing Director, MR Applications and Visualization, GE Healthcare
Patient motion and magnetic field distortions, such as susceptibility effects, are common issues impacting image quality and efficiency (e.g., scan times) in MR imaging. GE Healthcare provides an array of sequences and solutions designed to take MR to the next level of productivity. Even better, SIGNA™Works is value-added technology that is upgradable and customizable to meet the specific needs of different practices.
Patient motion and magnetic field distortions, such as susceptibility effects, are common issues impacting image quality and efficiency (e.g., scan times) in MR imaging. GE Healthcare provides an array of sequences and solutions designed to take MR to the next level of productivity. Even better, SIGNA™Works is value-added technology that is upgradable and customizable to meet the specific needs of different practices.
MR is one of the most complex imaging studies a radiologic technologist acquires. From patient positioning with phased array coils to determining the precise prescription for the imaging study, there are many variables that can impact not only the quality of the study but the efficiency and productivity of technologists and the MR system.
One of the most common issues impacting productivity is patient motion. In a published study, a retrospective review of one calendar week of MR exams found significant motion artifacts on sequences in 19.8 percent of the total completed MR exams.1 The authors estimated the potential cost to the hospital to be $592 per hour in lost revenue and a median revenue foregone of approximately $115,000 per scanner, per year.1
Respiratory motion is a leading cause of artifacts degrading imaging quality. Many elderly or acutely ill patients cannot hold their breath for the duration of the acquisition. Other causes of motion artifacts include cardiac movement and CSF pulsation/blood flow.
One approach to reducing motion artifacts is to increase scanning speed to decrease overall MR exam times. This can be accomplished with parallel imaging and compressed sensing techniques, which can also have the added impact of reducing total scan time and potentially enabling additional scheduling slots. For respiratory motion, there are free-breathing techniques for patients that cannot hold their breath, including respiratory-gating, respiratory-triggered and Auto Navigator techniques.
Magnetic field distortions can also be created by susceptibility effects that lead to signal loss, primarily in T2-weighted relaxation and spatial mismapping. The result is a signal void in the MR image or areas that have a very bright signal due to a "pile up," where the signal is "assigned" to the wrong area(s). Susceptibility artifacts may be common in patients with metal implants, screws or clips (e.g., aneurysm clip), as well as in diffusion-weighted (DWI) sequences. MR exams suffering from susceptibility effects can decrease system and technologist productivity when the region of interest in the MR image is distorted due to these artifacts.
Here’s a look at the available sequences and techniques that GE Healthcare offers in the SIGNA™Works productivity platform to address these issues.
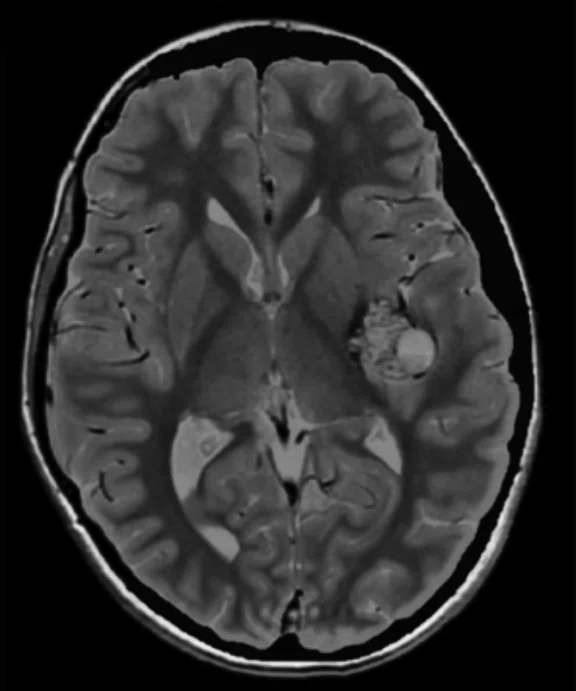
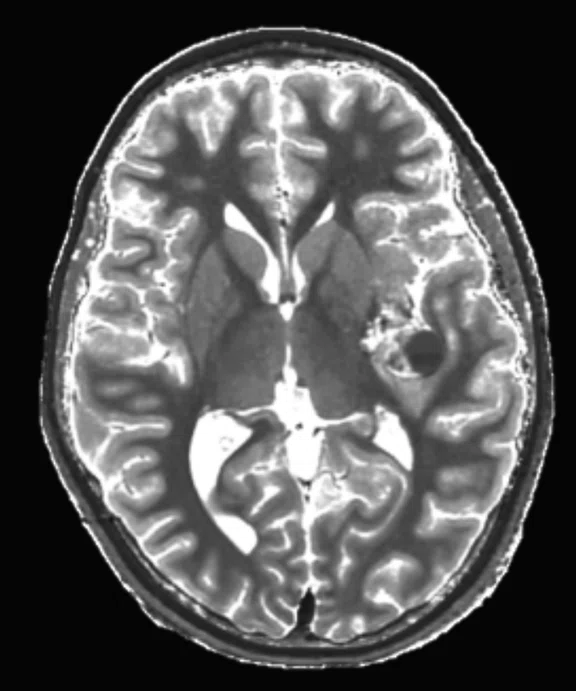
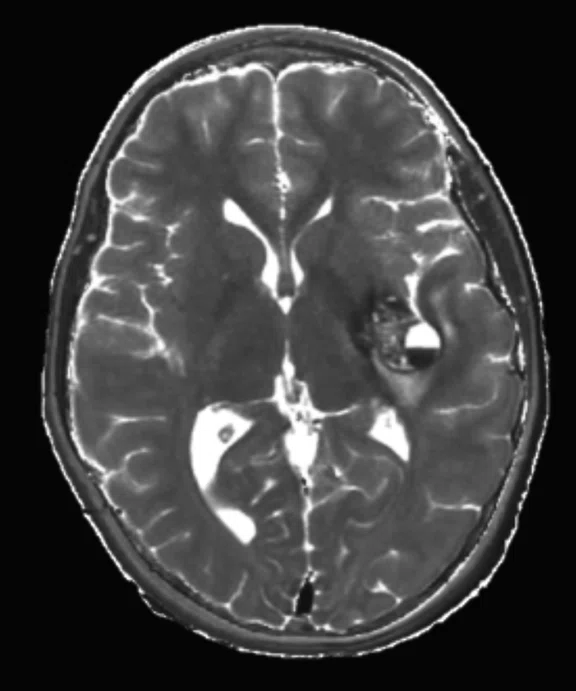
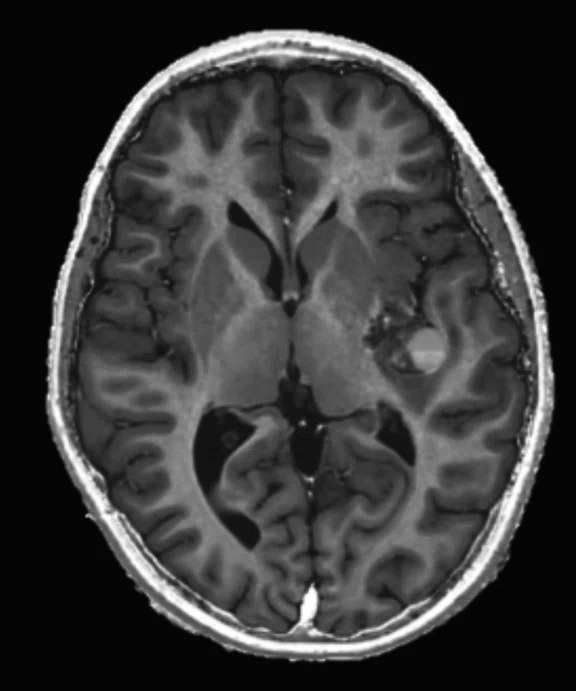
Figure 2.
An eight-year-old patient pre-epileptic surgery exam. Conventional contrast (top row) and parametric maps (bottom row) were all generated in one 5 min. scan. (A) T1w, (B) T2w, (C) T2 FLAIR‡, (D) PSIR, (E) STIR, (F) T1 FLAIR, (G) PD, (H) T1, (I) T2, (J) R1=1/T1, (K) R2=1/T2. Images acquired on a Discovery™ MR750w GEM. Images courtesy of Queen Silvia Hospital, Sweden.
Acceleration techniques
HyperWorks is a collection of advanced acceleration techniques that deliver fast scanning—up to 8 times faster—with excellent image quality. Designed to speed up scanning to reduce the potential for motion artifacts and, therefore, repeat exams, HyperWorks includes HyperSense, HyperBand and HyperCube.
- HyperSense is a compressed sensing acceleration technique based on sparse data sampling and iterative reconstruction, enabling faster imaging without the penalties commonly found with conventional parallel imaging. It uses a mathematical approach to identify and calculate data into an image versus scanning to collect all the data needed for that image. It can be used for 88 percent of all clinical procedures and is compatible with Cube and TOF sequences.
- HyperBand, compatible with DWI and diffusion tensor imaging (DTI) and ARC, speeds up scan time by exciting and acquiring multiple slices simultaneously to shorten acquisition time. HyperBand also allows the ability to acquire thinner slices in the same scan time for DWI or acquire more diffusion tensor directions on DTI.
- HyperCube accelerates small field-of-view (FOV) 3D volumetric imaging for more detail in less time without having to scan the entire FOV or use no-phase wrap. It lowers scan time without SNR loss, eliminates time-consuming parameters and enables better image quality. For large FOV robust fat suppression, HyperCube can be combined with Flex.
ARC is auto-calibrating, which means that it requires no coil sensitivity map and is therefore less sensitive to motion artifacts that would occur between the calibration and accelerated scan. It can be used with tight FOVs that are smaller than the anatomy being imaged and thus allow high-resolution imaging.
Synthetic MR
MAGiC is a multi-delay, multi-echo FSE sequence that generates images of any TR, TE and TI after a single scan has been acquired, even after the patient is gone. It automatically outputs eight contrasts—T1, T2, PD, T1 FLAIR, T2 FLAIR‡, STIR, DIR and PSIR—in approximately 5 minutes of scan time. In addition, MAGiC provides quantitative parametric maps, including T1, T2, R1, R2 and PD. MAGiC can provide more diagnostic information without adding scan time even after the patient has left.
MAGiC DWI is a synthetic DWI sequence that calculates multiple b-values from a single DWI scan. In DWI, increasing the b-value decreases SNR and increasing the number of b-values increases scan time. MAGiC DWI address both of these issues by synthetically calculating and providing multiple and higher b-values. In fact, it provides higher b-values than what can be acquired and improves image sharpness and SNR with shorter TEs. It is compatible with all diffusion directions and coils.
Volumetric MR
Cube, a volumetric FSE-based sequence, allows an image captured in one plane to be reformatted to any other scan plane, potentially eliminating the need for additional multi-planar 2D FSE acquisitions. Compatible with both free-breathing and respiratory-triggered sequences to reduce motion artifacts, Cube also decreases flow artifacts in the spine, ortho and brain applications. Since Cube modulates the RF pulse, there is reduced blurring, commonly associated with long Echo Train Length sequences. It can also be utilized with ARC and/or HyperSense to further reduce scan time, making 3D acquisitions consistently attainable.
Flex for Cube and FSE Flex use a 2-point Dixon technique for homogeneous FatSat with water, fat, in-phase and out-of-phase images in a single scan. With Cube Flex, the technologist can scan once and then reformat to any plane with high sub-millimeter resolution. FSE Flex acquires multiple contrasts in a single scan, reducing the need for multiple acquisitions, which is particularly useful for post-contrast spine or MSK imaging.
Figure 3.
DISCO with Auto Navigator enables a free-breathing dynamic DCE liver exam with high resolution. (A) Axial T2 SSFSE 352 x 224, 4 mm slice, scan time of 40 sec.; (B) Coronal T2 SSFSE, 320 x 224, 4 mm slice, scan time of 33 sec.; and (C) Coronal Turbo LAVA, 320 x 192, 3 mm slice, scan time of 19 sec. Images courtesy of Seirei Hamamatsu Hospital, Japan.
ViosWorks delivers a comprehensive cardiac anatomy, function and flow in a free-breathing, eight-minute scan. It provides visualization and quantification of 4D flow, tools to assess and quantify complex hemodynamics in cardiovascular disease, and increases productivity and patient comfort by acquiring one 3D volume over the chest. When used with HyperKat, ViosWorks reduces the number of slices needed. Cloud-based post-processing powered by Arterys™ also allows image analysis from anywhere using an internet browser.
Motion
PROPELLER is a multi-shot approach that preserves tissue contrast regardless of weighting while also reducing motion artifacts and providing a more signal rich image. Rather than filling k-space line-by-line, PROPELLER fills it with an arrangement of "blades" that are rotated in k-space at incremental angles, resulting in an oversampling of the center of k-space for a more signal-rich image. It delivers motion-artifact-reduced diagnostic images that are not impacted by respiration and peristalsis, potentially decreases the number of repeat scans and enables sedation-free scanning.
More recently, PROPELLER Multi-shot Blade (MB) advancements combine multiple blades together to achieve shorter TEs and improved motion correction. It allows for true T1 and PD contrast imaging. Both PROPELLER and PROPELLER MB are compatible with Auto Navigator.
PROMO (PROspective MOtion correction) delivers prospective motion correction for 3D brain imaging when combined with Cube T2, Cube FLAIR and Cube DIR. Motion is measured in real time by acquiring three-plane spiral Auto Navigator with a motion tracking algorithm. A mask is applied to navigators to remove non-rigidly moving tissue from motion estimates. Six rigid motion parameters are produced in real time by the PROMO tracking algorithm to prospectively correct for a patient’s motion during the scan.
Auto Navigator, a free-breathing approach, combats respiratory motion for body, cardiac and chest imaging with automatic tracker placement. It is compatible with all critical body imaging sequences, such as diffusion, PROPELLER, T2 MRCP and dynamic T1 imaging (LAVA, LAVA Flex and DISCO). The navigator tracker is automatically placed over the right hemidiaphragm and synchronizes with the patient’s breathing pattern to minimize respiratory ghosting artifacts. Real-time adjustment allows threshold levels and acceptance window to be adjusted during the acquisition, eliminating failures due to changes in the patient’s respiratory pattern. Auto Navigator can gate or trigger the patient’s respiratory cycle.
High susceptibility
MAVRIC SL is designed to greatly reduce artifacts caused by the presence of MR-Conditional metal implants, substantially reducing susceptibility artifacts and significantly improving visualization of bone and soft tissue. It provides the potential to visualize arthroscopic complications, fluid near an implant and adverse local tissue reaction. MAVRIC SL acquires several 3D FSE images at multiple spectral offsets that are combined into a single 3D composite data set to remove distortions commonly caused by MR-Conditional metal implants. It also has a T1-weighting capability for pre- and post-contrast enhancement.
FOCUS DWI, an EPI diffusion technique, enables smaller FOV imaging of anatomy for constrained, undistorted single-shot diffusion imaging. This 2D spatially-selective RF excitation method for DW-EPI and DTI is designed to reduce FOV in-phase encode direction within the imaging plane to reduce geometric distortion and eliminate phase wrap artifacts. By using a small FOV, FOCUS DWI increases image sharpness and resolution, and delivers less blurring and distortion in high susceptibility areas. It is ideal for use in the spine, prostate, gynecologic, brain and pancreas imaging and can be used with 1.5T and 3.0T systems.
MUSE (MUltiplexed Sensitivity Encoding) reduces blurring and susceptibility induced distortions compared to conventional parallel imaging techniques while pushing the boundaries of spatial resolution for DWI/DTI imaging. Traditionally, higher resolution DWI/DTI imaging was challenged because of imaging artifacts. The longer readout length and echo spacing lead to blurring and susceptibility artifacts. MUSE improves DWI and DTI image quality by acquiring phase-segmented DW-EPI and allowing higher resolution diffusion imaging in large matrix sizes, up to 512 × 512. It provides submillimeter in-plane image resolution and can be combined with in- and through-plane image acceleration techniques for enhanced speed and coverage. MUSE is particularly beneficial in anatomical areas that are vulnerable to susceptibility artifacts, such as the brain and prostate.
PROGRES, which includes Distortion Correction, addresses distortion in diffusion scans that typically arise from B0 inhomogeneity and the EPI readout but can also occur less frequently from motion and gradient-related imperfections such as eddy currents. This technique uses a "reverse polarity" acquisition and automated advanced processing to eliminate sources of distortion. It is most effective when SNR is high and provides the best high-resolution distortion reduction when combined with MUSE.


