A
Figure 1.
Susceptibility weighted imaging with 3D SWAN in high resolution, 0.3 x 0.4 x 1.2/-0.6 mm. (A) Magnitude image in MinIP; (B) filtered phase image in MinIP; (C) post-processed fusion of magnitude and filtered phase images (using ADD/SUB tool) in MinIP. Images courtesy of RIKEN Center for Brain Science, Wako, Saitama, Japan.
B
Figure 1.
Susceptibility weighted imaging with 3D SWAN in high resolution, 0.3 x 0.4 x 1.2/-0.6 mm. (A) Magnitude image in MinIP; (B) filtered phase image in MinIP; (C) post-processed fusion of magnitude and filtered phase images (using ADD/SUB tool) in MinIP. Images courtesy of RIKEN Center for Brain Science, Wako, Saitama, Japan.
C
Figure 1.
Susceptibility weighted imaging with 3D SWAN in high resolution, 0.3 x 0.4 x 1.2/-0.6 mm. (A) Magnitude image in MinIP; (B) filtered phase image in MinIP; (C) post-processed fusion of magnitude and filtered phase images (using ADD/SUB tool) in MinIP. Images courtesy of RIKEN Center for Brain Science, Wako, Saitama, Japan.
A
Figure 2.
Non-contrast enhanced MR angiography of the brain with 3D TOF in high resolution, 0.4 x 0.5 x 0.6 mm. (A) 3D TOF in 3D MIP; (B) 3D TOF post-processed with volume illumination. Images courtesy of University of Iowa, Iowa City, IA, US.
B
Figure 2.
Non-contrast enhanced MR angiography of the brain with 3D TOF in high resolution, 0.4 x 0.5 x 0.6 mm. (A) 3D TOF in 3D MIP; (B) 3D TOF post-processed with volume illumination. Images courtesy of University of Iowa, Iowa City, IA, US.
A
Figure 3.
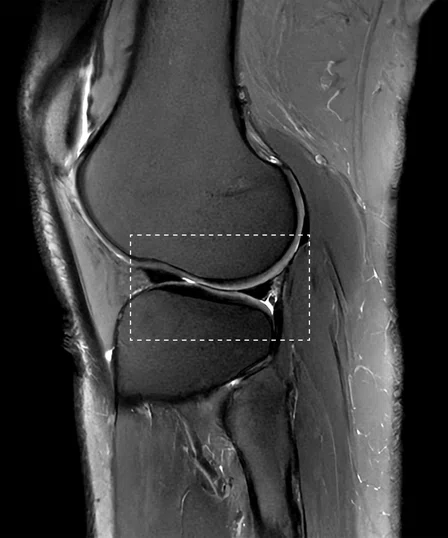
2D proton density FatSat imaging of the knee in high resolution. (A) Sagittal PD FatSat: 0.4 x 0.4 x 2.5 mm, 2:06 min. and (B) zoomed image of tibiofemoral cartilage. Images courtesy of Fondazione Imago7, University of Pisa, Pisa, Italy.
B
Figure 3.
2D proton density FatSat imaging of the knee in high resolution. (A) Sagittal PD FatSat: 0.4 x 0.4 x 2.5 mm, 2:06 min. and (B) zoomed image of tibiofemoral cartilage. Images courtesy of Fondazione Imago7, University of Pisa, Pisa, Italy.


result
PREVIOUS
${prev-page}
NEXT
${next-page}
Subscribe Now
Manage Subscription
FOLLOW US
Contact Us • Cookie Preferences • Privacy Policy • California Privacy PolicyDo Not Sell or Share My Personal Information • Terms & Conditions • Security
© 2024 GE HealthCare. GE is a trademark of General Electric Company. Used under trademark license.
IN PRACTICE
7.0T image gallery
7.0T image gallery

A

B

C
Figure 1.
Susceptibility weighted imaging with 3D SWAN in high resolution, 0.3 x 0.4 x 1.2/-0.6 mm. (A) Magnitude image in MinIP; (B) filtered phase image in MinIP; (C) post-processed fusion of magnitude and filtered phase images (using ADD/SUB tool) in MinIP. Images courtesy of RIKEN Center for Brain Science, Wako, Saitama, Japan.

A

B
Figure 2.
Non-contrast enhanced MR angiography of the brain with 3D TOF in high resolution, 0.4 x 0.5 x 0.6 mm. (A) 3D TOF in 3D MIP; (B) 3D TOF post-processed with volume illumination. Images courtesy of University of Iowa, Iowa City, IA, US.
A

B
Figure 3.
2D proton density FatSat imaging of the knee in high resolution. (A) Sagittal PD FatSat: 0.4 x 0.4 x 2.5 mm, 2:06 min. and (B) zoomed image of tibiofemoral cartilage. Images courtesy of Fondazione Imago7, University of Pisa, Pisa, Italy.