A
Figure 5.
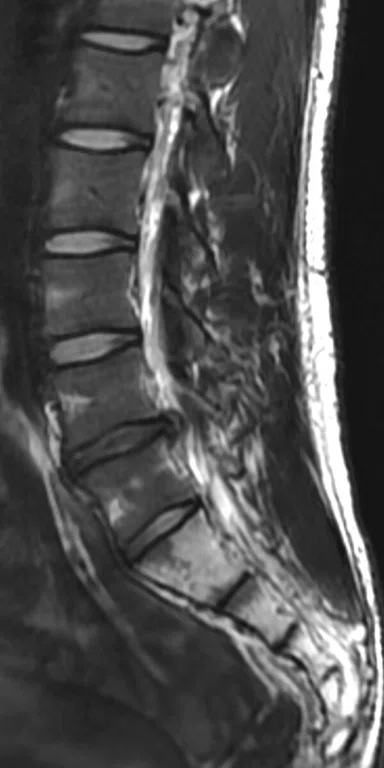
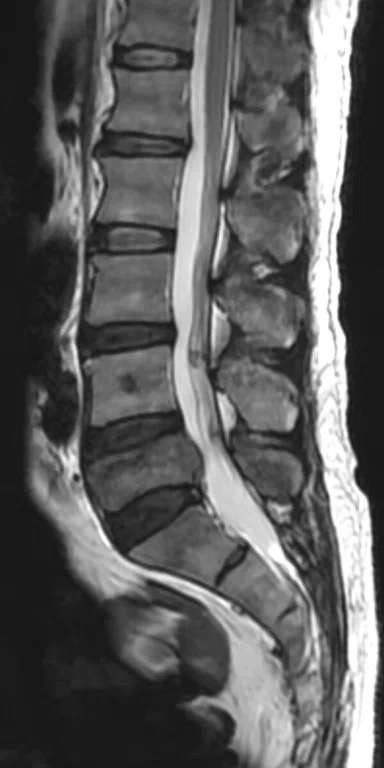
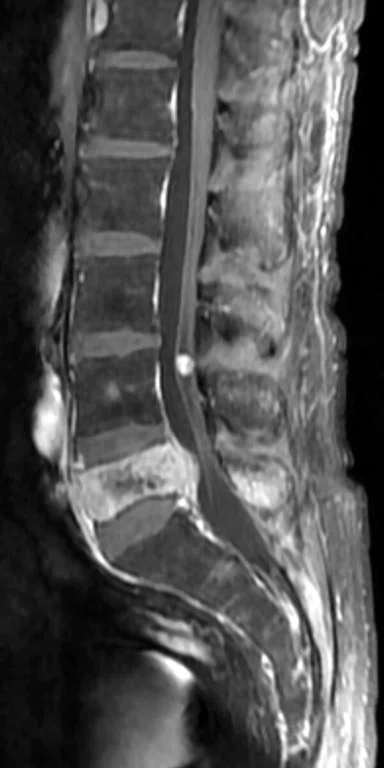
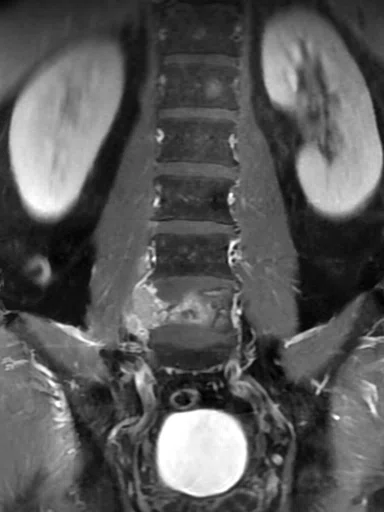
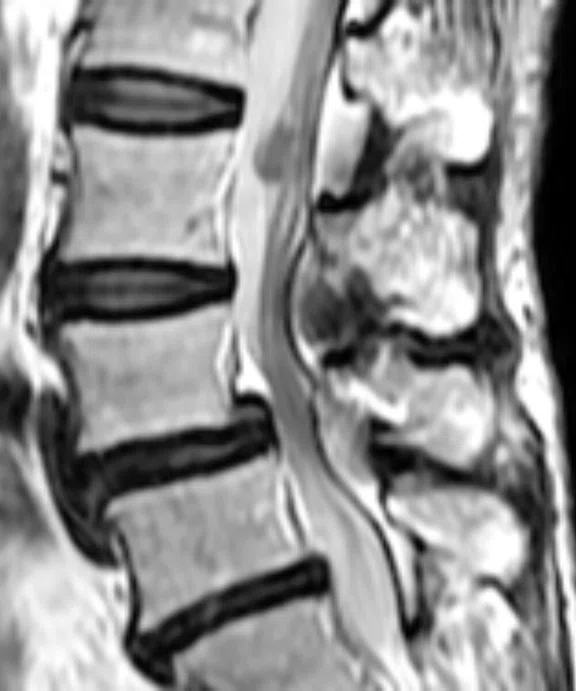
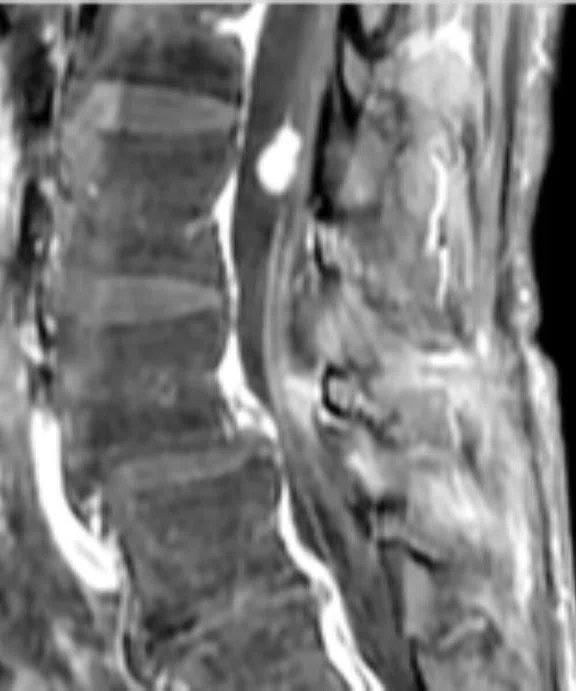
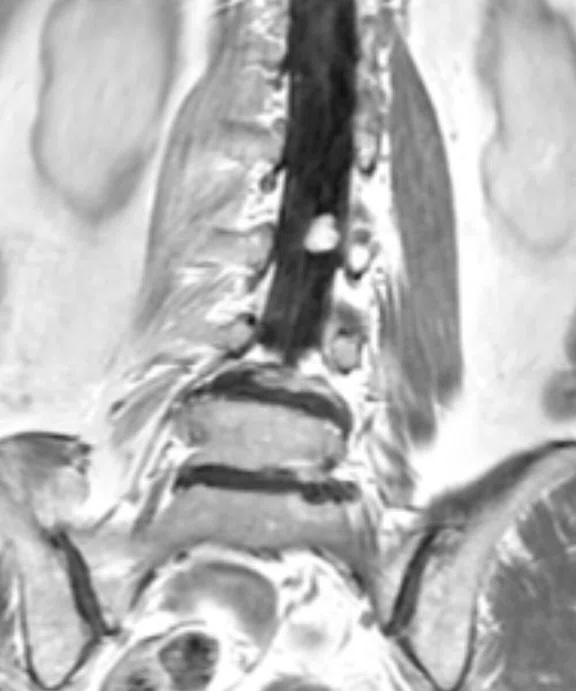
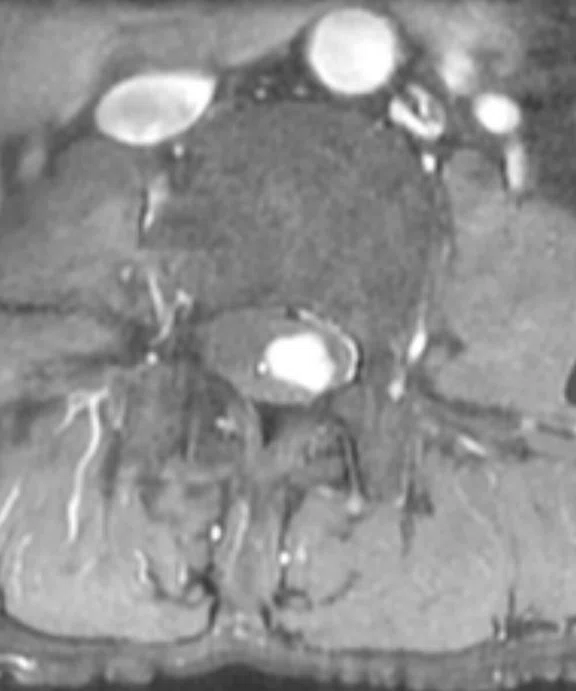
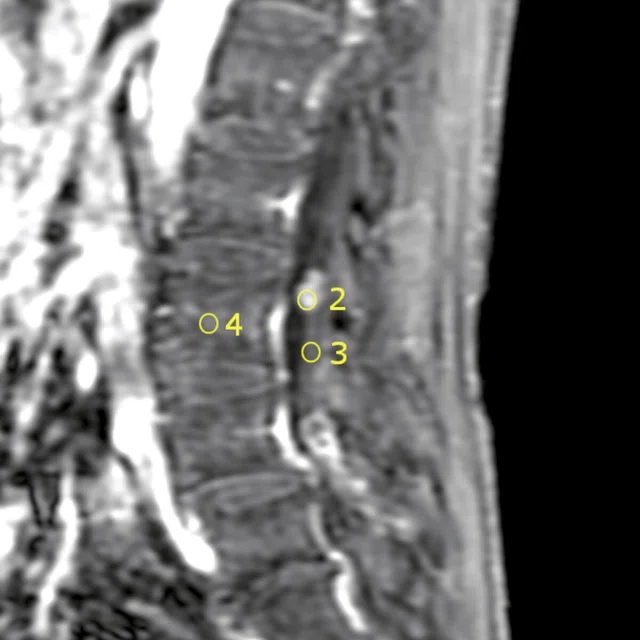
Patient with low back pain. (A) Sagittal T2, (B) CE T1 FatSat sagittal and (C) coronal show damage to the L4 and L5 vertebrae resulting from compression, posterior bulging of L5 consistent with a malignancy that is highly suspicious of metastasis and contrast-enhancing nodule at cauda quine, indicating a metastasis or neurinoma.
B
Figure 5.
Patient with low back pain. (A) Sagittal T2, (B) CE T1 FatSat sagittal and (C) coronal show damage to the L4 and L5 vertebrae resulting from compression, posterior bulging of L5 consistent with a malignancy that is highly suspicious of metastasis and contrast-enhancing nodule at cauda quine, indicating a metastasis or neurinoma.
C
Figure 5.
Patient with low back pain. (A) Sagittal T2, (B) CE T1 FatSat sagittal and (C) coronal show damage to the L4 and L5 vertebrae resulting from compression, posterior bulging of L5 consistent with a malignancy that is highly suspicious of metastasis and contrast-enhancing nodule at cauda quine, indicating a metastasis or neurinoma.
A
Figure 6.
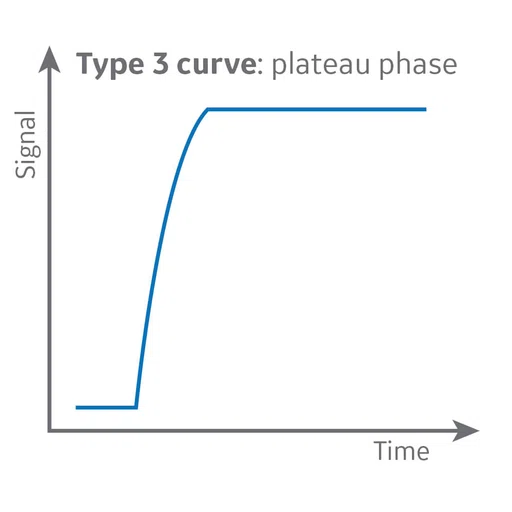
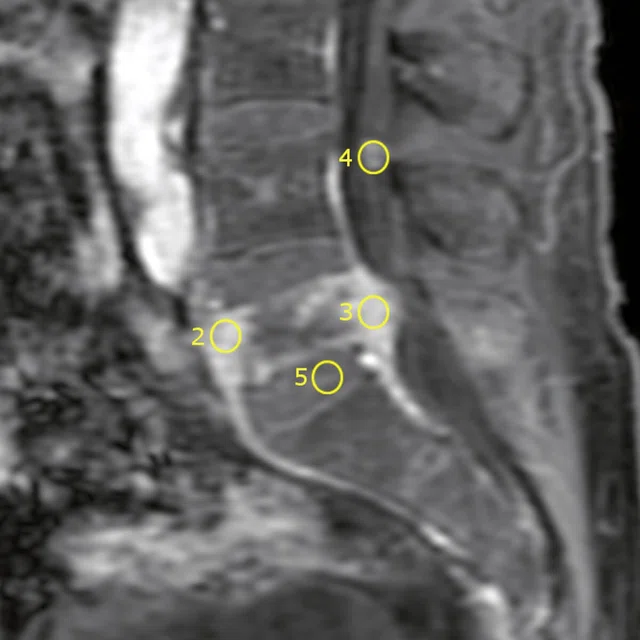
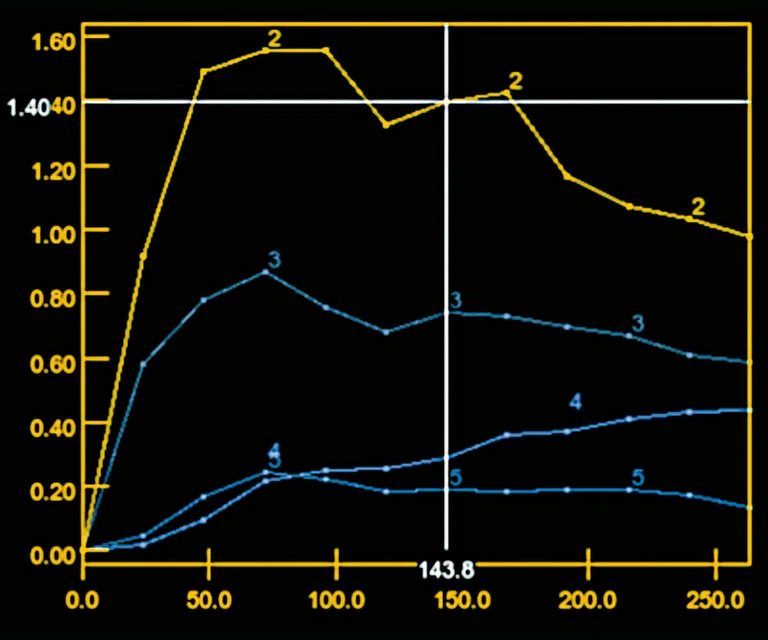
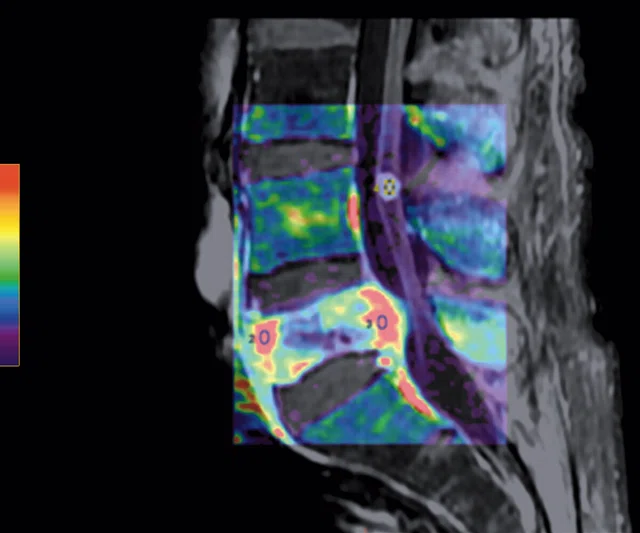
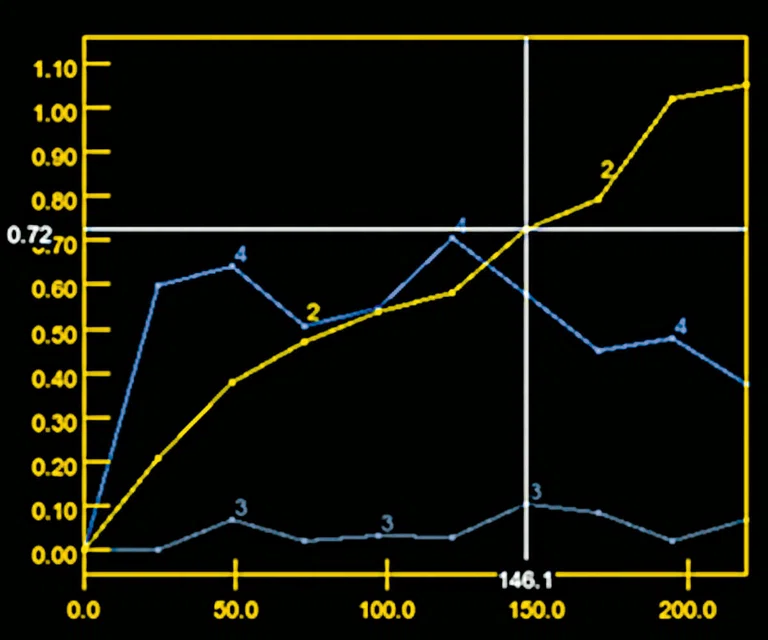
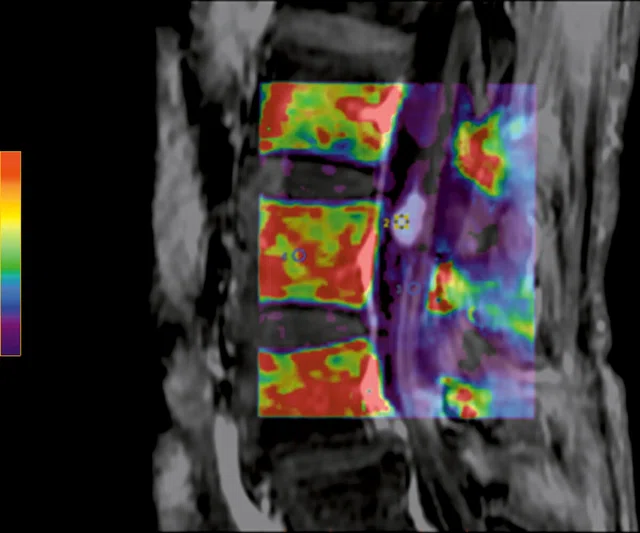
DCE MR perfusion demonstrates a Type 3 curve with early wash-in and a continued plateau at L5 level consistent with malignancy and a Type 2 curve with gradual enhancement at cauda equina nodule that is consistent with a benign lesion.
B
Figure 6.
DCE MR perfusion demonstrates a Type 3 curve with early wash-in and a continued plateau at L5 level consistent with malignancy and a Type 2 curve with gradual enhancement at cauda equina nodule that is consistent with a benign lesion.
A
Figure 1.
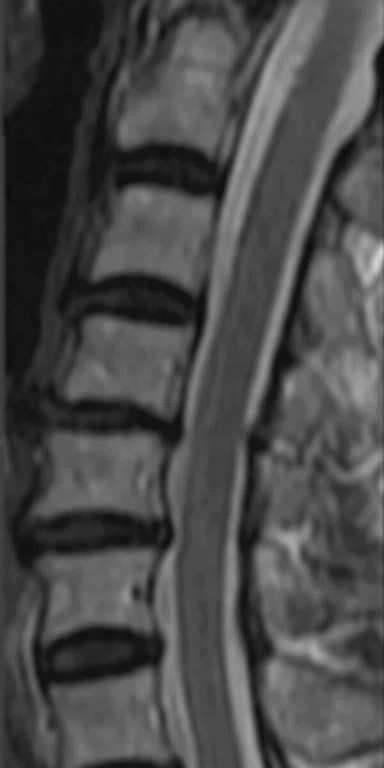
Patient with grade II/moderate central spinal canal stenosis at C5-6 level shows decrease of FA and increase of MD compared to the C1-2 level.
B
Figure 1.
Patient with grade II/moderate central spinal canal stenosis at C5-6 level shows decrease of FA and increase of MD compared to the C1-2 level.
C
Figure 1.
Patient with grade II/moderate central spinal canal stenosis at C5-6 level shows decrease of FA and increase of MD compared to the C1-2 level.
D
Figure 1.
Patient with grade II/moderate central spinal canal stenosis at C5-6 level shows decrease of FA and increase of MD compared to the C1-2 level.
E
Figure 1.
Patient with grade II/moderate central spinal canal stenosis at C5-6 level shows decrease of FA and increase of MD compared to the C1-2 level.
A
Figure 2.
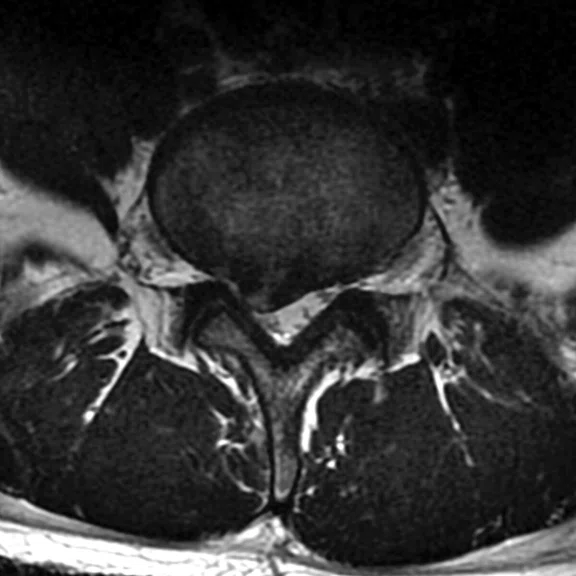
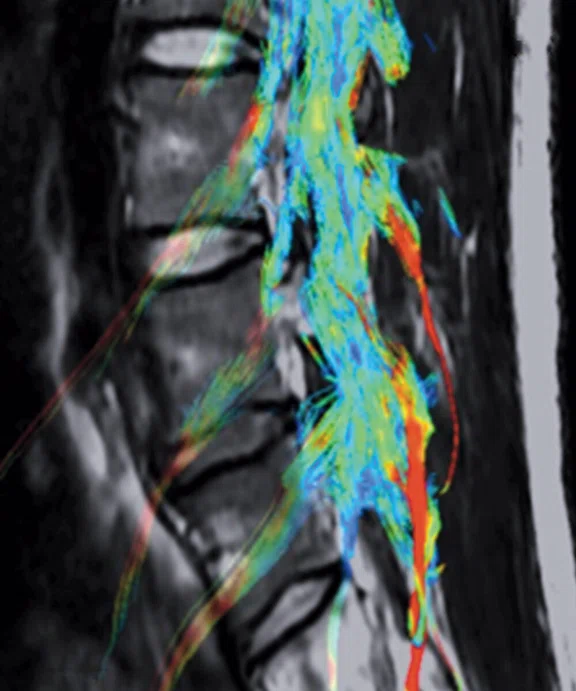
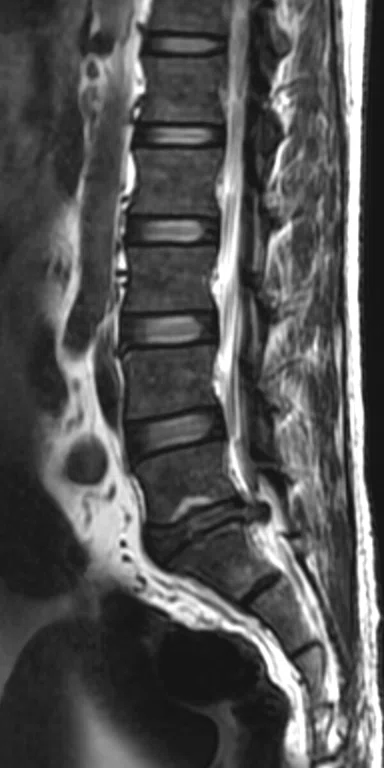
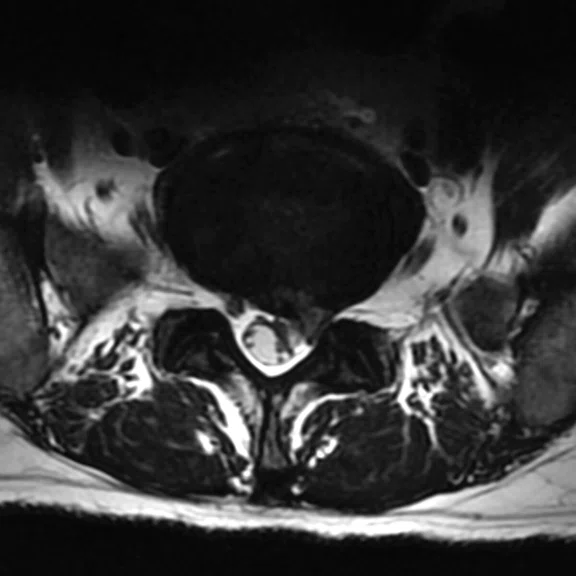
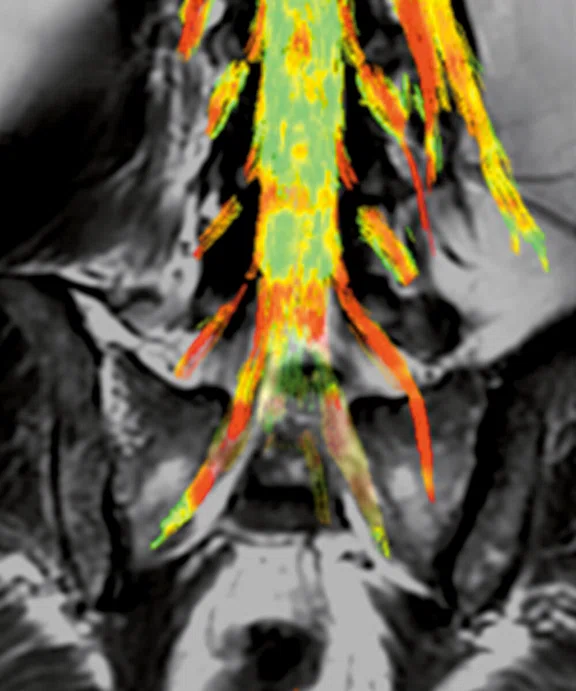
Patient with right radicular pain. (A, B) Sagittal and axial T2 images demonstrate disk extrusion to the right paracentral with indentation of L5 right traversing the nerve root. (C) DTI with tractography shows the indentation of the right L5 traversing the nerve root.
B
Figure 2.
Patient with right radicular pain. (A, B) Sagittal and axial T2 images demonstrate disk extrusion to the right paracentral with indentation of L5 right traversing the nerve root. (C) DTI with tractography shows the indentation of the right L5 traversing the nerve root.
C
Figure 2.
Patient with right radicular pain. (A, B) Sagittal and axial T2 images demonstrate disk extrusion to the right paracentral with indentation of L5 right traversing the nerve root. (C) DTI with tractography shows the indentation of the right L5 traversing the nerve root.
A
Figure 3.
Patient with left radicular pain. (A, B) Sagittal and axial T2 shows L5-S1 left paracentral disk extrusion. (C) DTI with tractography shows an indentation of the left S1 traversing the ner`ve root.
B
Figure 3.
Patient with left radicular pain. (A, B) Sagittal and axial T2 shows L5-S1 left paracentral disk extrusion. (C) DTI with tractography shows an indentation of the left S1 traversing the nerve root.
C
Figure 3.
Patient with left radicular pain. (A, B) Sagittal and axial T2 shows L5-S1 left paracentral disk extrusion. (C) DTI with tractography shows an indentation of the left S1 traversing the nerve root.
A
Figure 4.
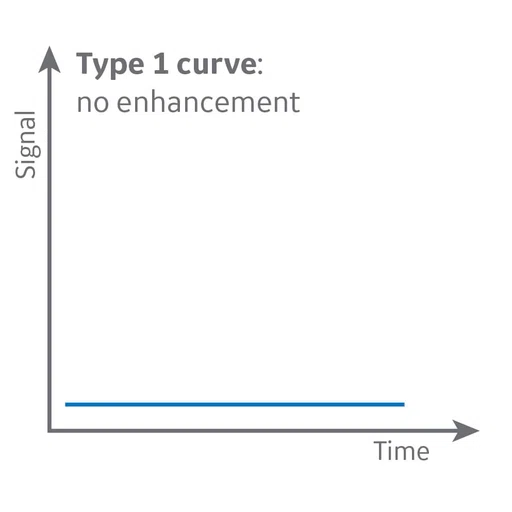
The signal intensity-time curve reflects a composition of tissue perfusion, vessel permeability and extravascular-extracellular space.
B
Figure 4.
The signal intensity-time curve reflects a composition of tissue perfusion, vessel permeability and extravascular-extracellular space.
C
Figure 4.
The signal intensity-time curve reflects a composition of tissue perfusion, vessel permeability and extravascular-extracellular space.
D
Figure 4.
The signal intensity-time curve reflects a composition of tissue perfusion, vessel permeability and extravascular-extracellular space.
E
Figure 4.
The signal intensity-time curve reflects a composition of tissue perfusion, vessel permeability and extravascular-extracellular space.
A
Figure 7.
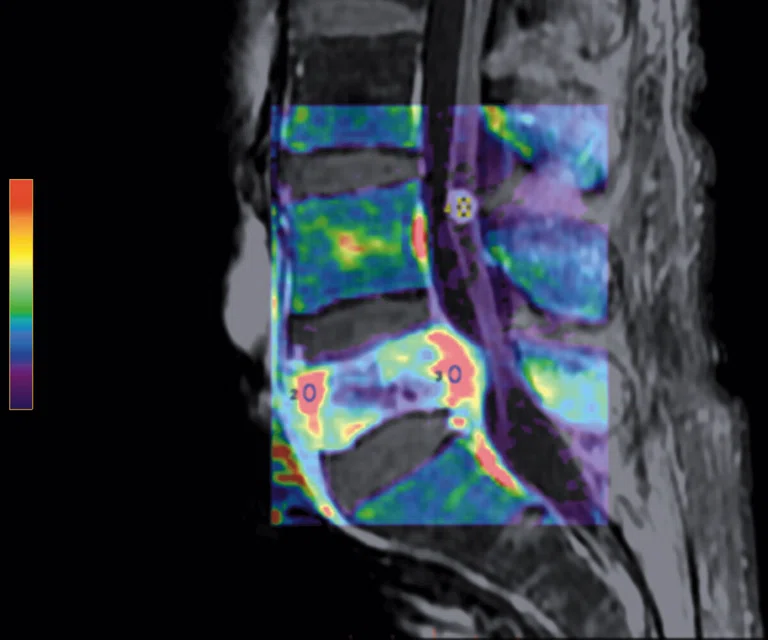
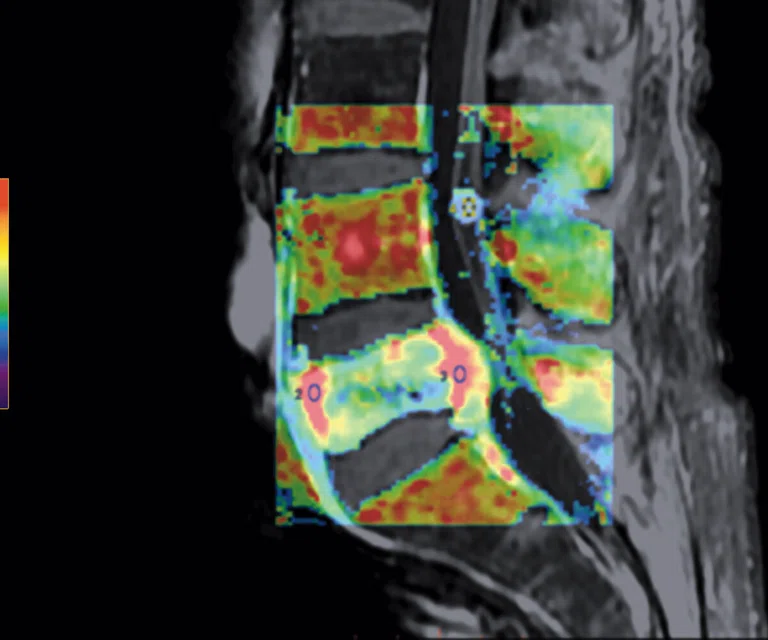
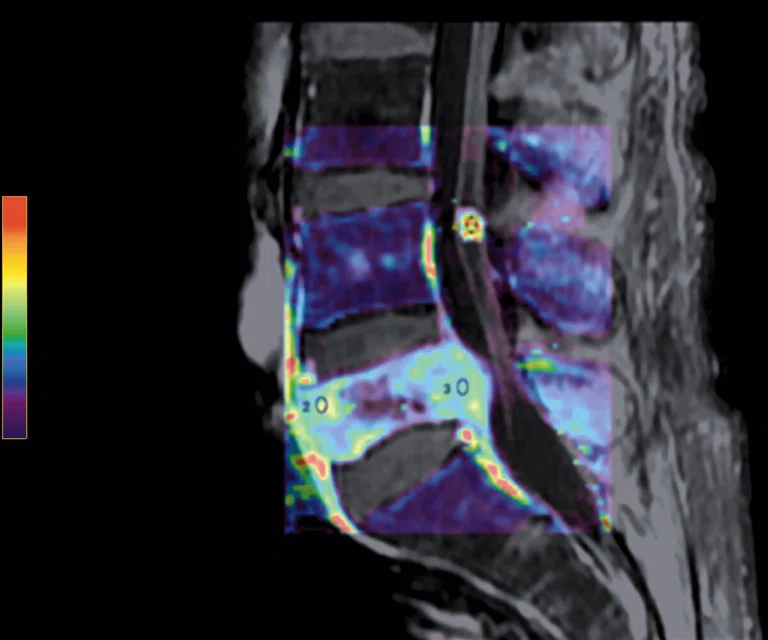
Permeability study demonstrates an increase in (A) ktrans, (B) Kep and (C) Ve at L5 level that is consistent with malignancy and no increase in ktrans, Kep, (D) IAUGC and Ve at cauda equina nodule that is consistent with a benign lesion, most likely a neurinoma.
B
Figure 7.
Permeability study demonstrates an increase in (A) ktrans, (B) Kep and (C) Ve at L5 level that is consistent with malignancy and no increase in ktrans, Kep, (D) IAUGC and Ve at cauda equina nodule that is consistent with a benign lesion, most likely a neurinoma.
C
Figure 7.
Permeability study demonstrates an increase in (A) ktrans, (B) Kep and (C) Ve at L5 level that is consistent with malignancy and no increase in ktrans, Kep, (D) IAUGC and Ve at cauda equina nodule that is consistent with a benign lesion, most likely a neurinoma.
D
Figure 7.
Permeability study demonstrates an increase in (A) ktrans, (B) Kep and (C) Ve at L5 level that is consistent with malignancy and no increase in ktrans, Kep, (D) IAUGC and Ve at cauda equina nodule that is consistent with a benign lesion, most likely a neurinoma.
A
Figure 8.
Patient with low back pain. Sagittal (A) T2 and (B) contrast-enhanced T1 FatSat images demonstrate a homogenous contrast-enhancing nodule at cauda equine L3 level that is next to the degenerative disk with central disk extrusion and grade I anterolisthesis L4-5 level. (C) Coronal T2 and (D) axial contrast-enhanced T1 FatSat.
B
Figure 8.
Patient with low back pain. Sagittal (A) T2 and (B) contrast-enhanced T1 FatSat images demonstrate a homogenous contrast-enhancing nodule at cauda equine L3 level that is next to the degenerative disk with central disk extrusion and grade I anterolisthesis L4-5 level. (C) Coronal T2 and (D) axial contrast-enhanced T1 FatSat.
C
Figure 8.
Patient with low back pain. Sagittal (A) T2 and (B) contrast-enhanced T1 FatSat images demonstrate a homogenous contrast-enhancing nodule at cauda equine L3 level that is next to the degenerative disk with central disk extrusion and grade I anterolisthesis L4-5 level. (C) Coronal T2 and (D) axial contrast-enhanced T1 FatSat.
D
Figure 8.
Patient with low back pain. Sagittal (A) T2 and (B) contrast-enhanced T1 FatSat images demonstrate a homogenous contrast-enhancing nodule at cauda equine L3 level that is next to the degenerative disk with central disk extrusion and grade I anterolisthesis L4-5 level. (C) Coronal T2 and (D) axial contrast-enhanced T1 FatSat.
A
Figure 9.
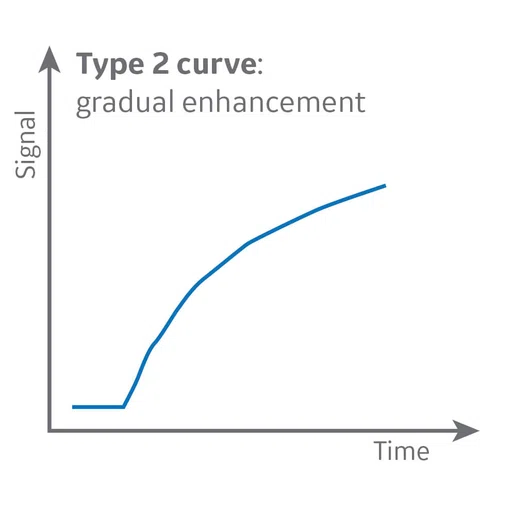
MR perfusion depicts a Type 2 curve with gradual contrast enhancement that is consistent with a benign lesion, likely a neurinoma.
B
Figure 9.
MR perfusion depicts a Type 2 curve with gradual contrast enhancement that is consistent with a benign lesion, likely a neurinoma.
A
Figure 10.
Permeability study shows no increase of (A) ktrans although there is an increase of (B) Ve. The adjacent normal soft tissue also shows an increase in Ve, which is consistent with a benign lesion that is most likely a neurinoma.
B
Figure 10.
Permeability study shows no increase of (A) ktrans although there is an increase of (B) Ve. The adjacent normal soft tissue also shows an increase in Ve, which is consistent with a benign lesion that is most likely a neurinoma.
A
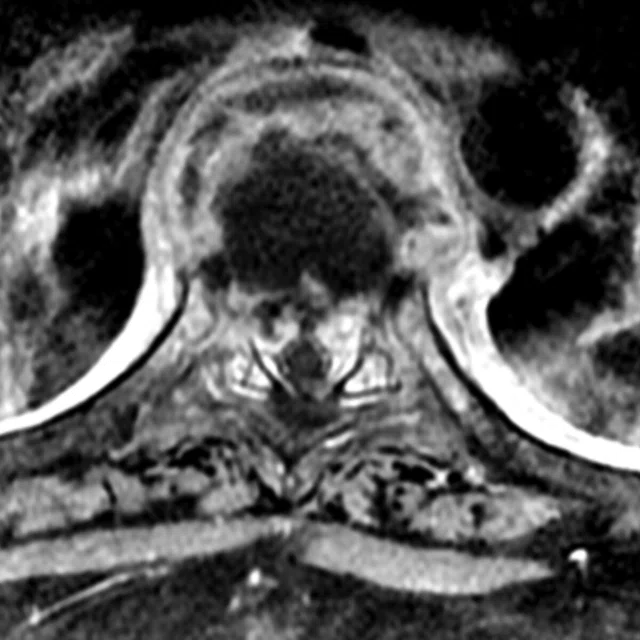
Figure 11.
Patient with low back pain and paraplegia. (A, C) Sagittal and axial T2 and (B, D) contrast enhanced T1 sagittal and axial images illustrate the destruction of T7, T8 and T9, with T8 mostly damaged due to compression, and involvement of T7-T8 disk space, likely resulting from a paravertebral, epidural granulation mixed abscess that is consistent with spondylodiscitis.
B
Figure 11.
Patient with low back pain and paraplegia. (A, C) Sagittal and axial T2 and (B, D) contrast enhanced T1 sagittal and axial images illustrate the destruction of T7, T8 and T9, with T8 mostly damaged due to compression, and involvement of T7-T8 disk space, likely resulting from a paravertebral, epidural granulation mixed abscess that is consistent with spondylodiscitis.
C
Figure 11.
Patient with low back pain and paraplegia. (A, C) Sagittal and axial T2 and (B, D) contrast enhanced T1 sagittal and axial images illustrate the destruction of T7, T8 and T9, with T8 mostly damaged due to compression, and involvement of T7-T8 disk space, likely resulting from a paravertebral, epidural granulation mixed abscess that is consistent with spondylodiscitis.
D
Figure 11.
Patient with low back pain and paraplegia. (A, C) Sagittal and axial T2 and (B, D) contrast enhanced T1 sagittal and axial images illustrate the destruction of T7, T8 and T9, with T8 mostly damaged due to compression, and involvement of T7-T8 disk space, likely resulting from a paravertebral, epidural granulation mixed abscess that is consistent with spondylodiscitis.
A
Figure 12.
DCE MR perfusion shows Type 2 curve with gradual enhancement, consistent with a benign lesion.
B
Figure 12.
DCE MR perfusion shows Type 2 curve with gradual enhancement, consistent with a benign lesion.
result


PREVIOUS
${prev-page}
NEXT
${next-page}
Subscribe Now
Manage Subscription
FOLLOW US
Contact Us • Cookie Preferences • Privacy Policy • California Privacy PolicyDo Not Sell or Share My Personal Information • Terms & Conditions • Security
© 2024 GE HealthCare. GE is a trademark of General Electric Company. Used under trademark license.
IN PRACTICE
Advanced MR imaging in spine lesions
Advanced MR imaging in spine lesions
By Sri Andreani Utomo, MD, Neuroradiology Consultant, Department of Radiology, Dr. Soetomo Hospital, Faculty of Medicine, Airlangga University and New Brain Clinic, Surabaya, Indonesia
Spine imaging can be challenging due to the small size of the anatomy and the potential for respiratory- and cardiac-induced motion. Applying the same techniques used in neuroimaging with high-field MR can provide the information needed for a confident diagnosis and assist with surgical planning.
Spine imaging can be challenging due to the small size of the anatomy and the potential for respiratory- and cardiac-induced motion. Applying the same techniques used in neuroimaging with high-field MR can provide the information needed for a confident diagnosis and assist with surgical planning.
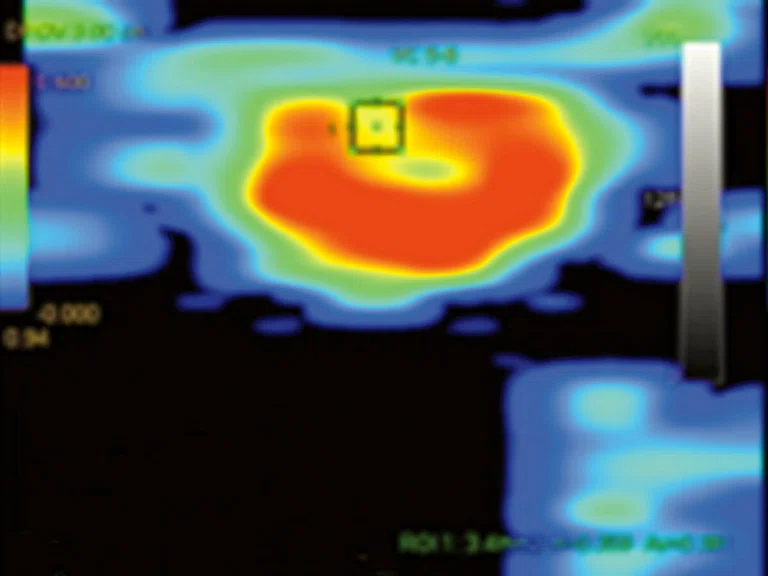
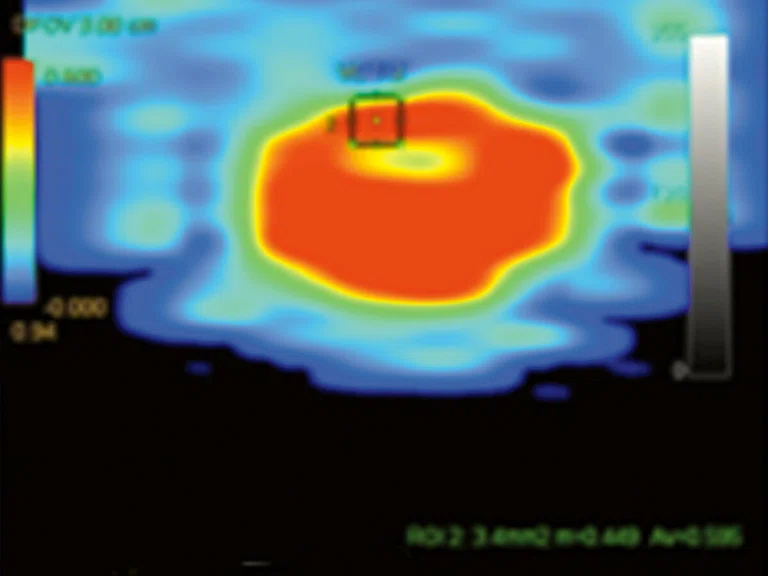
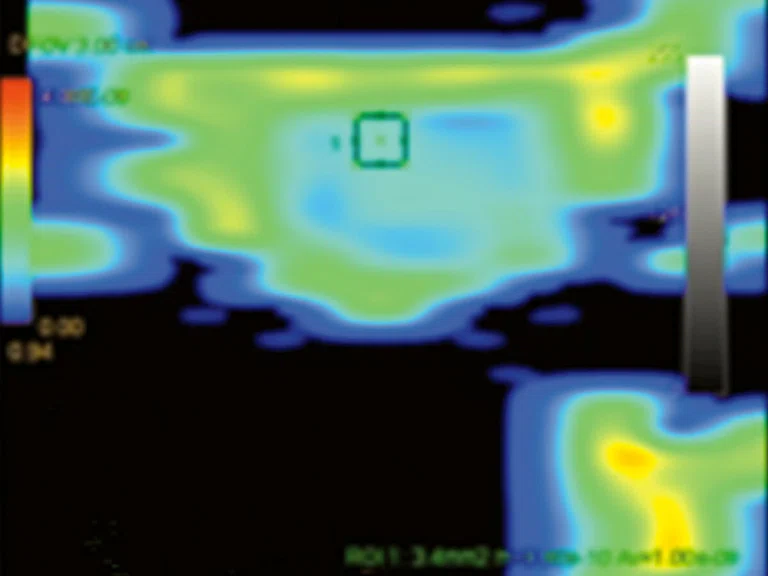
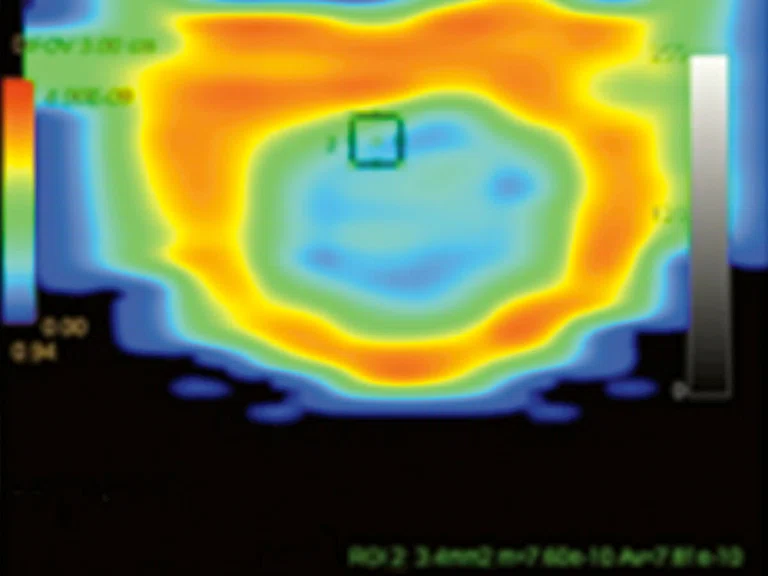
With 3.0T MR, we can now perform advanced imaging of the spine and spinal cord lesions. In our daily clinical practice, we are utilizing advanced high-field MR imaging techniques to aid in our diagnosis and provide more precise details to help guide the neurosurgeon and orthopedic surgeon in their pre-surgical planning, as well as during the procedure. These advanced techniques include: diffusion tensor imaging (DTI) with fractional anisotropy (FA), mean diffusivity (MD) and tractography, dynamic contrast enhanced (DCE) MR perfusion with permeability study.
Diffusion-weighted imaging and diffusion tensor imaging
DWI and DTI are challenging techniques in spinal imaging for several reasons, including the small size of the spinal cord relative to the brain and respiratory and cardiac motion artifacts. Therefore, spine diffusion imaging requires high spatial resolution that should be combined with distortion reduction techniques and homogeneous fat saturation. However, these goals are difficult to achieve with the single shot fast spin echo (SSFSE) EPI diffusion sequence, especially when image acquisition is in the sagittal plane, which is preferred for evaluating the spine. Specific aspects of these techniques include fat saturation, image distortion and b values and directions.
DTI is a newer technique that can assess water movement, called Brownian motion, and water diffusion in three dimensions based on the spatial location. DTI can help the clinician detect microstructures of the central nervous system and abnormalities that may not be visible using conventional MR sequences such as SSFSE.
DTI shows the magnitude, degree of anisotropy and orientation of diffusion anisotropy. In estimating the connectivity patterns of white matter in the brain, white matter tractography can be used to assess diffusion anisotropy and diffusion direction. In the central nervous system, diffusion of water is more anisotropic in white matter and more isotropic in gray matter and cerebrospinal fluid.
Diffusion from water in biological tissues occur inside, outside, around and through cellular structures. Diffusion is a picture of directional dependent anisotropy of the white matter where the myelin sheath and axonal membrane become barriers to the movement of water molecules in a random direction. The maximum MD value describes the direction of nerve fibers.
Broadly speaking, tensors are abstract mathematical entities that can help describe complex physical phenomena. The latest terminology states that tensors are simple matrix values obtained from diffusion measurements in different directions. The diffusivity value can be estimated in each direction or used to determine the direction of the maximum diffusivity. Tensor matrix is easier to describe in the form of an ellipsoid where the diameter in each direction predicts diffusivity in that direction and has a major axis that describes the direction of the maximum diffusivity. This concept is the basis for diffusion tensor, which is a mathematical model of diffusion in the three-dimensional space. By using DTI, both anisotropy degree and direction of fibers in the white matter can be assessed in each voxel.
The same principle of DTI that is performed in the brain can also be used in the spinal cord, including measuring FA and MD. Measurements can be obtained by marking the region of interest (ROI) on sagittal and axial images; however, it is possible to be more precise when marking an ROI on an axial image, potentially making these measurements more reliable.
Dynamic contrast-enhanced (DCE) MR perfusion
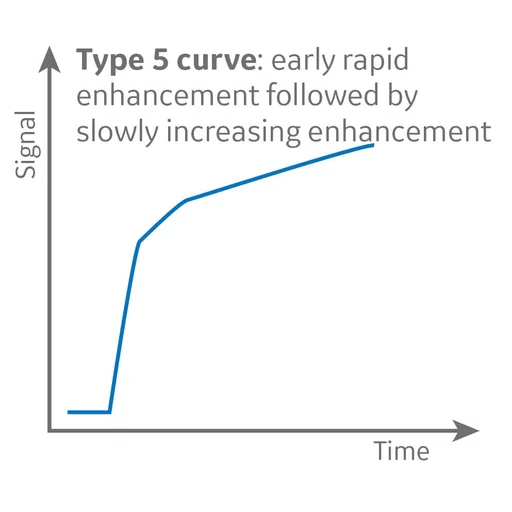
DCE MR perfusion, also widely referred to as permeability MR, is based on the acquisition of serial T1-weighted images before, during and after administration of extracellular low-molecular-weight MR contrast media, such as a gadolinium-based contrast agent. The resulting signal intensity-time curve reflects a composite of tissue perfusion, vessel permeability and extravascular-extracellular space.
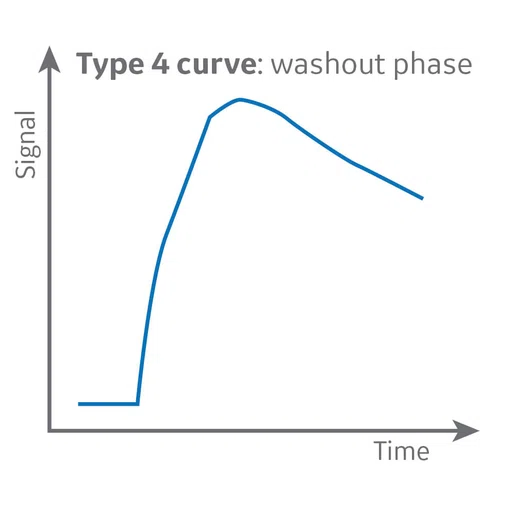
In contrast to conventional static contrast-enhanced, T1-weighted MR imaging, which displays contrast enhancement at a single point in time, DCE MR perfusion imaging depicts the wash-in, plateau and washout contrast kinetics of the tissue, thereby providing insight into the nature of the bulk tissue properties at the microvascular level.
Most often, DCE MR perfusion imaging is based on a two compartmental (plasma space and extravascular-extracellular space) pharmacokinetics model. The general process, in order, is:
With pharmacokinetics modeling of DCE MR perfusion data, several metrics are commonly derived: the transfer constant (ktrans), the fractional volume of the extravascular-extracellular space (ve), the rate constant (kep, where kep = ktrans /ve), and the fractional volume of the plasma space (vp).
- Perform baseline T1 mapping
- Acquire DCE MR perfusion images
- Convert signal intensity data to gadolinium concentration
- Determine the vascular input function, and
- Perform pharmacokinetics modeling.
The most frequently used metric in DCE MR perfusion is ktrans. It can have different interpretations depending on blood flow and permeability. When there is very high permeability, the flux of a gadolinium-based contrast agent is limited only by flow, and thus ktrans mainly reflects blood flow. In situations in which there is very low permeability, the gadolinium-based contrast agent cannot leak easily into the extravascular-extracellular space, and thus ktrans mainly reflects permeability.
Advanced MR techniques such as DCE MR perfusion with permeability, DWI and DTI with FA, MD and tractography are very useful when evaluating whether a lesion is benign or malignant and in cases where injection can mimic a tumor. Metrics derived from DCE perfusion can help depict the different behavior in a mass to identify metastases and are used to assist with pre surgical planning, including guidance for the incision site. DWI assists with differentiating an abscess formation and granulation tissue or tumor and is a useful tool in patients with chronic kidney failure who cannot tolerate the use of contrast.
Armed with these techniques, we can more clearly and confidently diagnose spinal abnormalities using DTI and DWI to positively impact patient management.
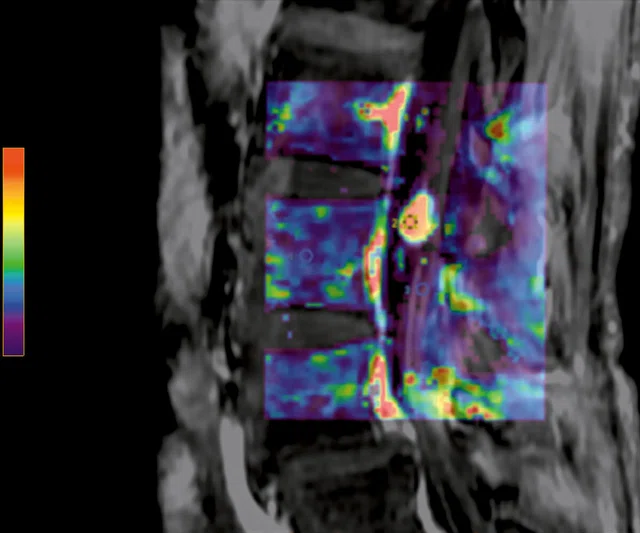
Figure 5.
Patient with low back pain. (A) Sagittal T2, (B) CE T1 FatSat sagittal and (C) coronal show damage to the L4 and L5 vertebrae resulting from compression, posterior bulging of L5 consistent with a malignancy that is highly suspicious of metastasis and contrast-enhancing nodule at cauda quine, indicating a metastasis or neurinoma.
Figure 8.
Patient with low back pain. Sagittal (A) T2 and (B) contrast-enhanced T1 FatSat images demonstrate a homogenous contrast-enhancing nodule at cauda equine L3 level that is next to the degenerative disk with central disk extrusion and grade I anterolisthesis L4-5 level. (C) Coronal T2 and (D) axial contrast-enhanced T1 FatSat.
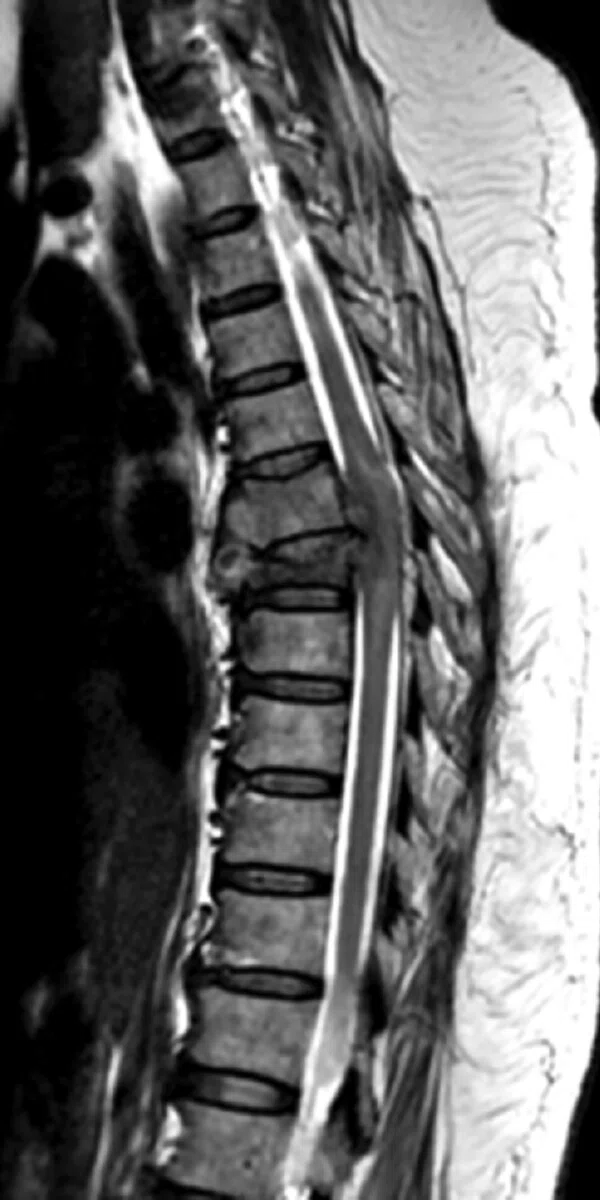
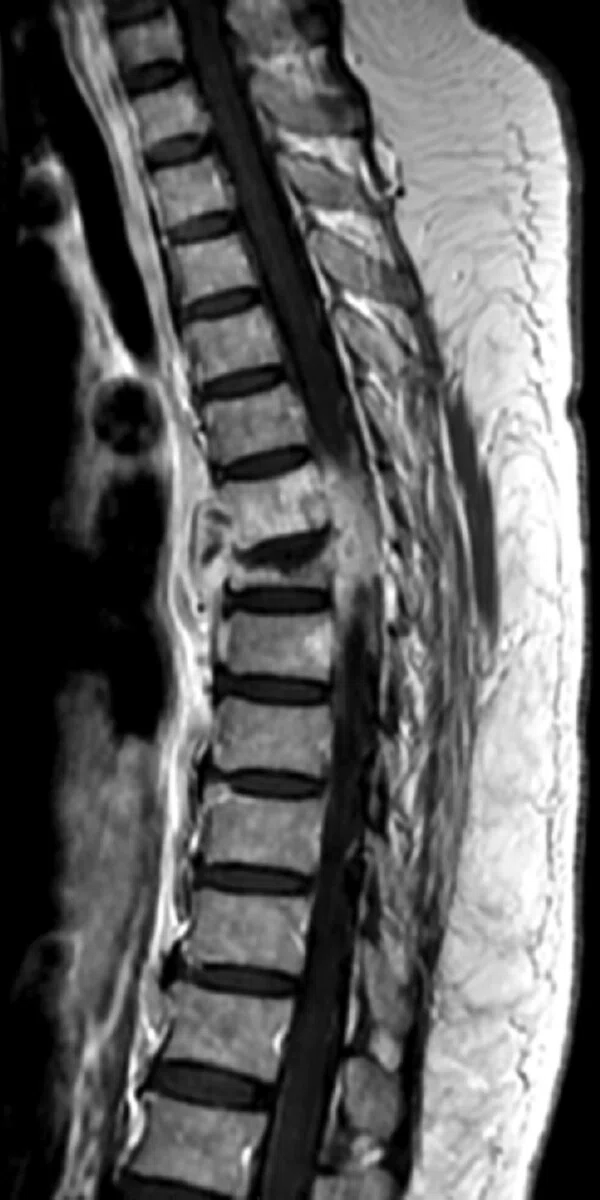
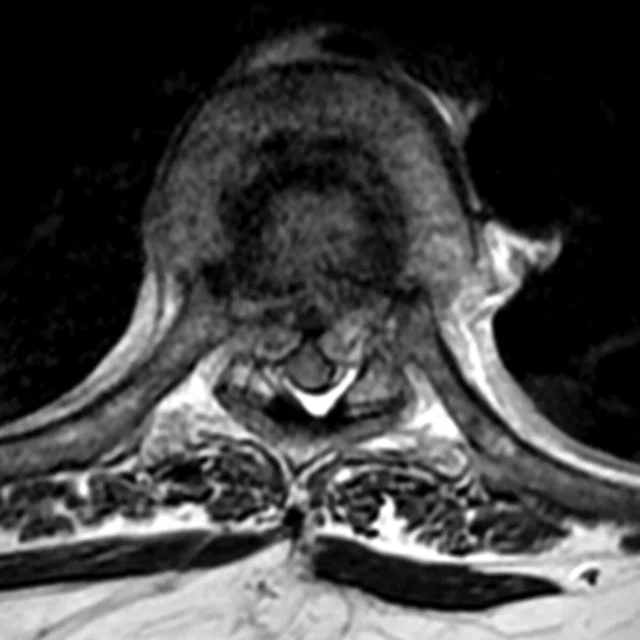
Figure 11.
Patient with low back pain and paraplegia. (A, C) Sagittal and axial T2 and (B, D) contrast enhanced T1 sagittal and axial images illustrate the destruction of T7, T8 and T9, with T8 mostly damaged due to compression, and involvement of T7-T8 disk space, likely resulting from a paravertebral, epidural granulation mixed abscess that is consistent with spondylodiscitis.
A
B
Figure 12.
DCE MR perfusion shows Type 2 curve with gradual enhancement, consistent with a benign lesion.
References
- Kang Y, Lee JW, Koh YH, et al. New MRI grading system for the cervical canal stenosis. Am Roentgenol. 2011;197(1):134–40.
- Young WF. Cervical Spondylotic Myelopathy: A Common Cause of Spinal Cord Dysfunction in Older Persons. Am Fam Physician. 2000;62(5):1064–70.
- Wu JC, Ko CC, Yen YS, et al. Epidemiology of cervical spondylotic myelopathy and its risk of causing spinal cord injury: a national cohort study. Neurosurg Focus. 2013;35(1):E10.
- Gulraiz, Quratulain, Afzal F, Manzoor S. Chronic Neck Pain and how to Prevent Chronic Neck Pain in Bankers by Using Ergonomics. J Nov Physiother. 2017;7:364.
- Ahmadli U, Ulrich NH, Yuqiang Y, Nanz D, Sarnthein J, Kollias SS. Early detection of cervical spondylotic myelopathy using diffusion tensor imaging: Experiences in 1.5-tesla magnetic resonance imaging. Neuroradiol J. 2015;28(5):508–14.
- Kara B, Celik A, Karadereler S, et al. The role of DTI in early detection of cervical spondylotic myelopathy: A preliminary study with 3-T MRI. Neuroradiology. 2011;53(8):609–16.
- Bammer R, Holdsworth SJ, Veldhuis WB, Skare ST. New Methods in Diff usion-Weighted and Diffusion Tensor Imaging. Magn Reson Imaging Clin N Am. 2009;17(2):175–204.
- Shedid D, Benzel EC. Cervical spondylosis anatomy: Pathophysiology and biomechanics. Neurosurgery. 2007;60(1 SUPPL.):7–13.
- Tracy JA, Bartleson JD. Cervical Spondylotic Myelopathy. Neurologist. 2010;16(3):176–87.
- Northover JR, Wild JB, Braybrooke J, Blanco J. The epidemiology of cervical spondylotic myelopathy. Skeletal Radiol. 2012;41(12):1543–6.
- Lacout A, Mompoint D, Vallee CA, Carlier RY. Posterior subluxation of bilateral discoid lateral menisci in a child. Indian J Radiol Imaging. 2008;18(2):130-131.
- DaSilva AFM, Tuch DS, Wiegell MR, Hadjikhani N. A primer on diffusion tensor imaging of anatomical substructures. Neurosurg Focus. 2003;15(1):1–4.
- Vilanova A, Zhang S, Kindlmann G, Laidlaw D. An Introduction to Visualization of Diffusion Tensor Imaging and Its Applications. Vis Process Tensor Fields. 2006;121–53.
- Mamata H, Jolesz FA, Maier SE. Apparent diffusion coefficient and fractional anisotropy in spinal cord: age and cervical spondylosis-related changes. J Magn Reson Imaging. 2005;22(1):38–43.
- Wheeler-kingshott CA, Hickman SJ, Parker GJ, et al. Investigating cervical spinal cord structure using axial diffusion tensor imaging. Neuroimage. 2002;16(1):93–102.
- Rajasekaran S, Kanna RM, Shetty AP. Diffusion tensor imaging of the spinal cord and its clinical applications. J Bone Joint Surg Br. 2012;94(8):1024–31.
- de Figueiredo EH, Borgonovi AF,Doring TM. Basic concepts of MR imaging, diffusion MR imaging, and diffusion tensor imaging. Magn Reson Imaging Clin N Am. 2011;19(1):1–22.
- Fujiyoshi K, Konomi T, Yamada M, et al. Diffusion tensor imaging and tractography of the spinal cord: From experimental studies to clinical application. Exp Neurol. 2013;242:74–82.
- Vargas MI, Delattre BMA, Boto J, et al. Advanced magnetic resonance imaging (MRI) techniques of the spine and spinal cord in children and adults. Insights Imaging. 2018;9(4):549-55


