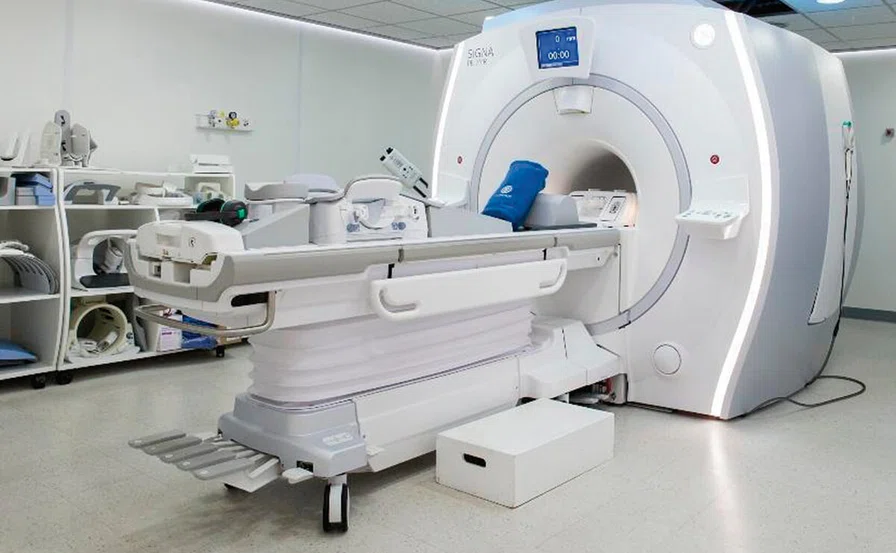
Figure 2.
SIGNA™ PET/MR installed at INTECNUS.
A
Figure 6.
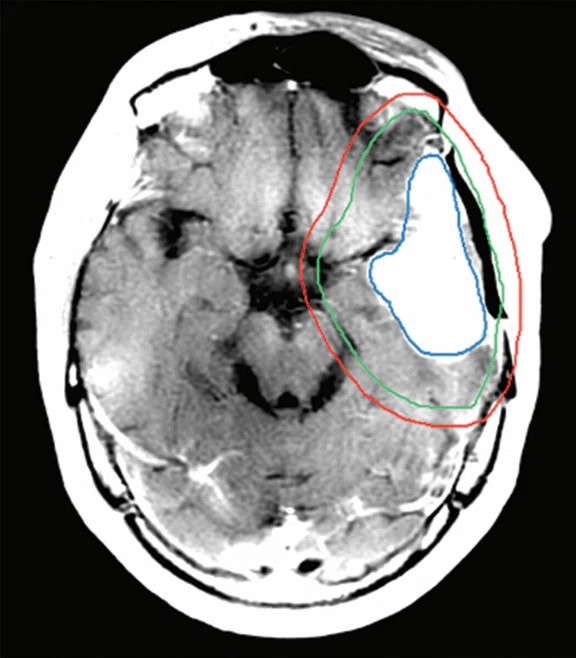
Clinical case 2. (A) T1w with contrast MR image, (B) CT planning image, (C) MR image fused with CT image and (D) radiation dose distribution. (A–C) CTV (green line), GTV (blue line) and PTV (red line).
B
Figure 6.
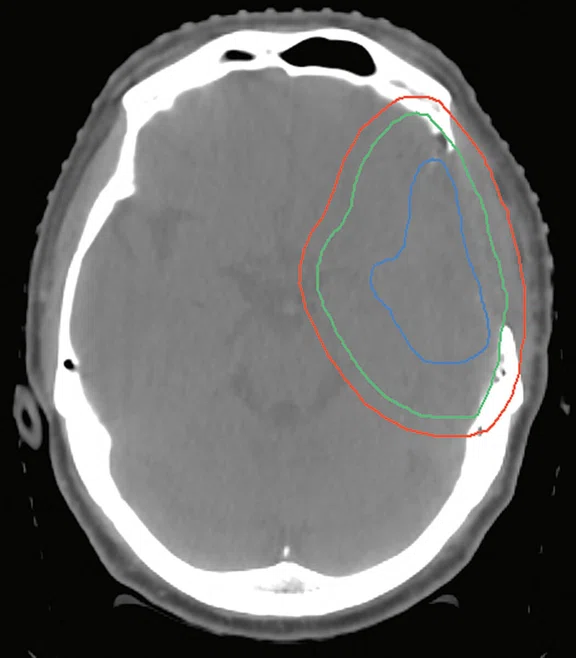
Clinical case 2. (A) T1w with contrast MR image, (B) CT planning image, (C) MR image fused with CT image and (D) radiation dose distribution. (A–C) CTV (green line), GTV (blue line) and PTV (red line).
C
Figure 6.
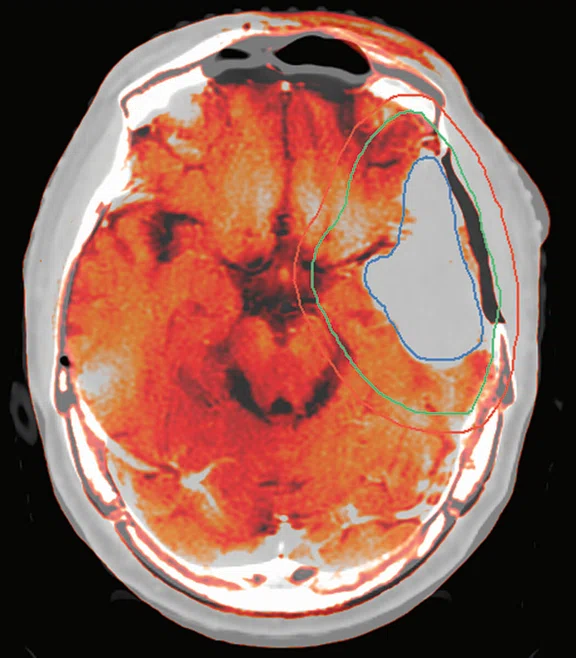
Clinical case 2. (A) T1w with contrast MR image, (B) CT planning image, (C) MR image fused with CT image and (D) radiation dose distribution. (A–C) CTV (green line), GTV (blue line) and PTV (red line).
D
Figure 6.
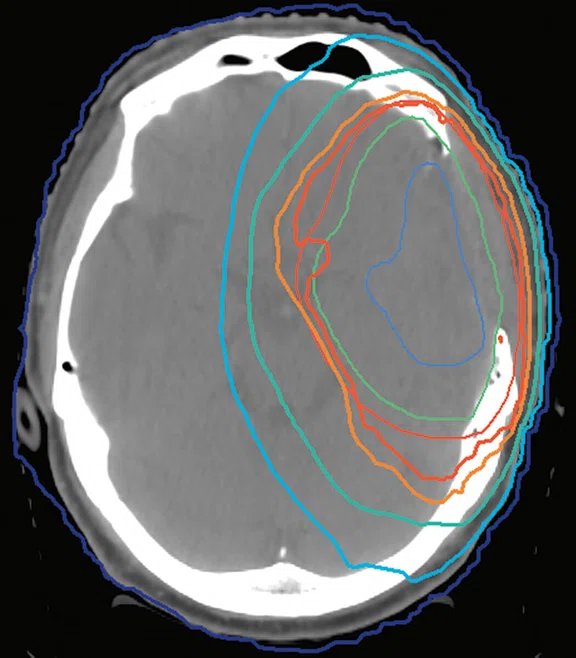
Clinical case 2. (A) T1w with contrast MR image, (B) CT planning image, (C) MR image fused with CT image and (D) radiation dose distribution. (A–C) CTV (green line), GTV (blue line) and PTV (red line).
‡ 18F-choline is not cleared or approved by the US FDA or any other global regulation for clinical use.
1. Chandarana H, Wang H, Tijssen RHN, Das IJ. Emerging role of MRI in radiation therapy. J Magn Reson Imaging. 2018;48(6):1468-1478. doi:10.1002/jmri.26271.
2. Otazo R, Lambin P, Pignol JP, Ladd ME, Schlemmer HP, Baumann M, Hricak H. MRI-guided Radiation Therapy: An Emerging Paradigm in Adaptive Radiation Oncology. Radiology. 2021 Feb;298(2):248-260.
A
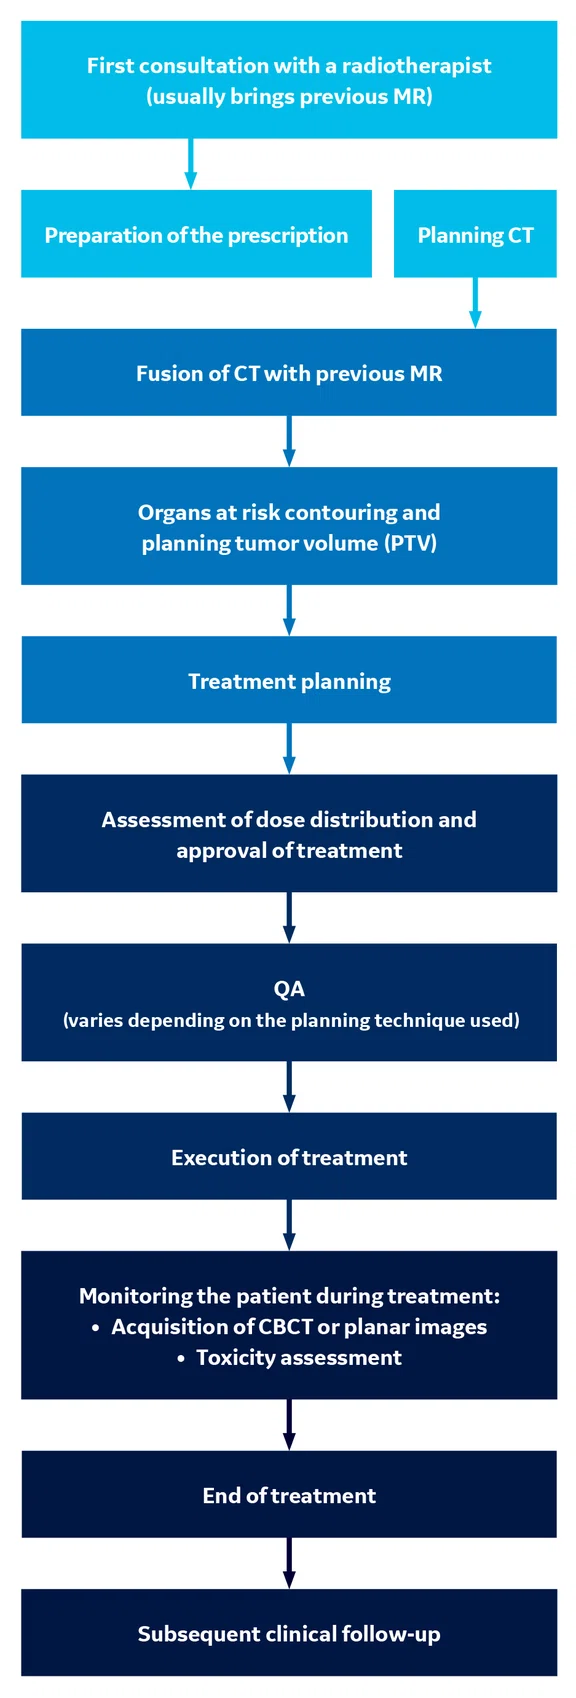
Figure 1.
MR-guided radiotherapy planning workflow at INTECNUS.
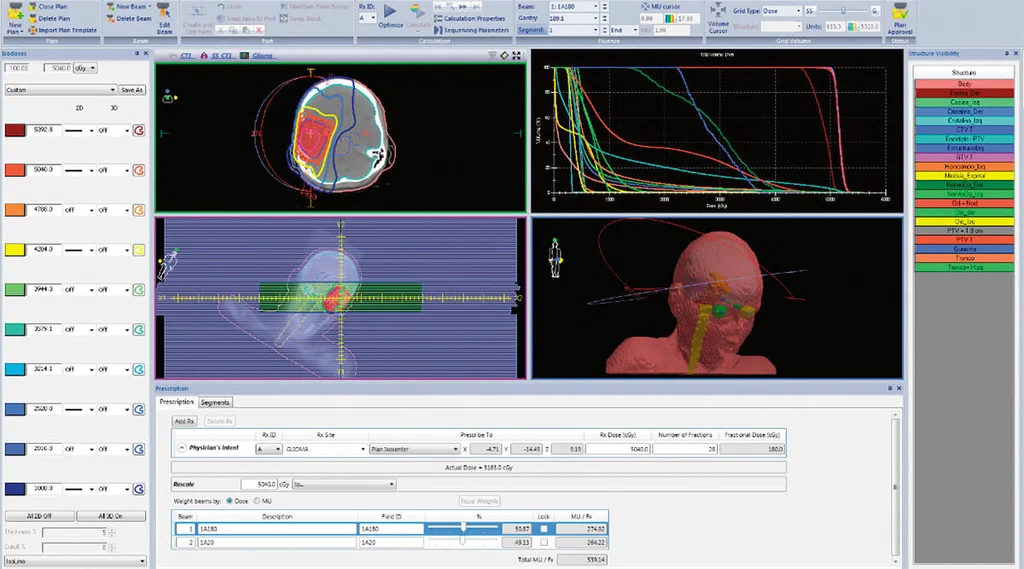
Figure 3.
MR images imported into the TPS, Monaco™, version 5.11.02 (Elekta, Stockholm, Sweden) used by INTECNUS.
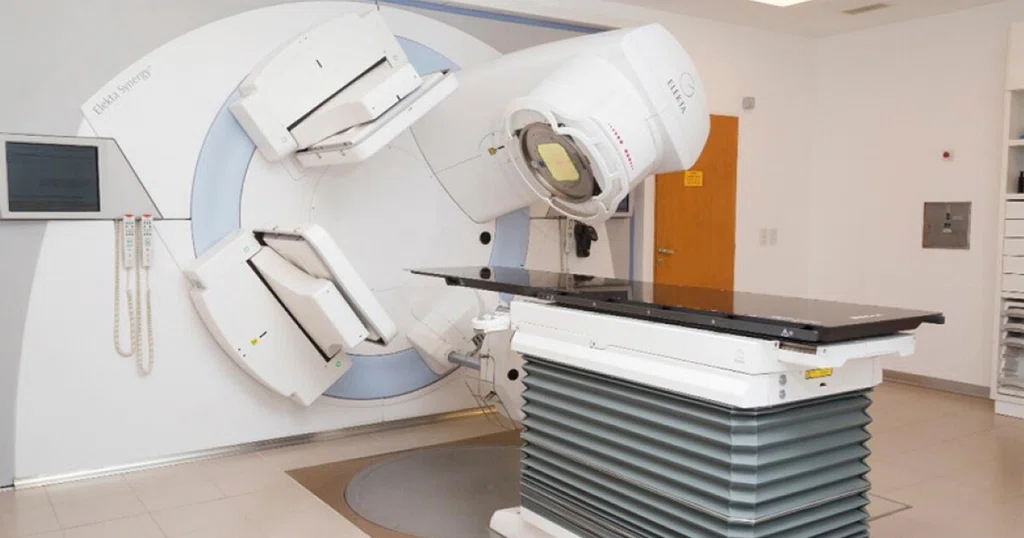
Figure 4.
Elekta Synergy® linear accelerator installed at INTECNUS.
A
Figure 5.
Clinical case 1. (A) FLAIR MR image, (B) CT planning image, (C) MR image fused with CT image and (D) radiation dose distribution. (A–C) CTV (blue line), GTV (magenta line) and PTV (red line).
B
Figure 5.
Clinical case 1. (A) FLAIR MR image, (B) CT planning image, (C) MR image fused with CT image and (D) radiation dose distribution. (A–C) CTV (blue line), GTV (magenta line) and PTV (red line).
C
Figure 5.
Clinical case 1. (A) FLAIR MR image, (B) CT planning image, (C) MR image fused with CT image and (D) radiation dose distribution. (A–C) CTV (blue line), GTV (magenta line) and PTV (red line).
D
Figure 5.
Clinical case 1. (A) FLAIR MR image, (B) CT planning image, (C) MR image fused with CT image and (D) radiation dose distribution. (A–C) CTV (blue line), GTV (magenta line) and PTV (red line).
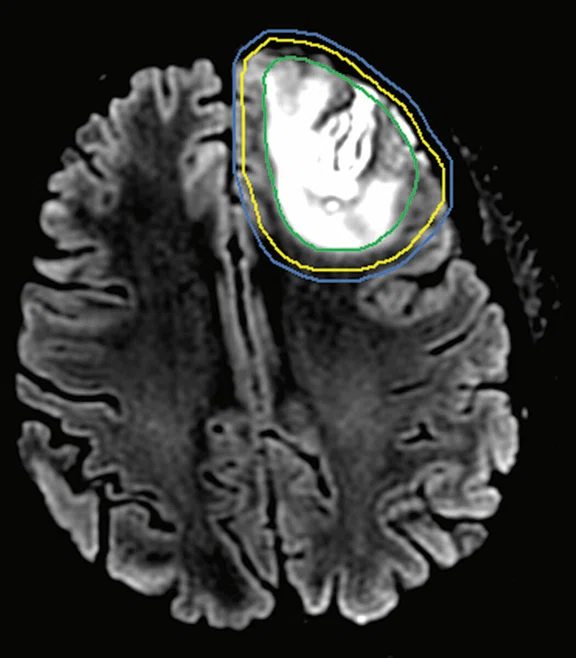
A
Figure 7.
Clinical case 3. (A) FLAIR MR image, (B) CT planning image and (C) MR image fused with CT image. (A–C) CTV (yellow line), GTV (green line) and PTV (blue line).
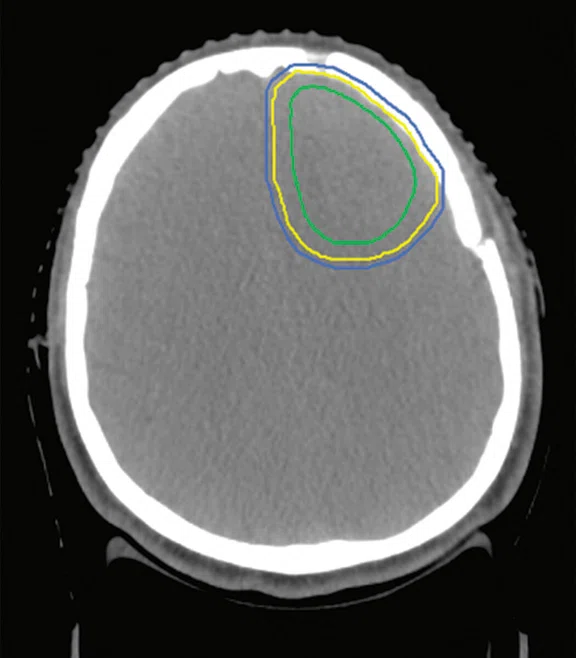
B
Figure 7.
Clinical case 3. (A) FLAIR MR image, (B) CT planning image and (C) MR image fused with CT image. (A–C) CTV (yellow line), GTV (green line) and PTV (blue line).
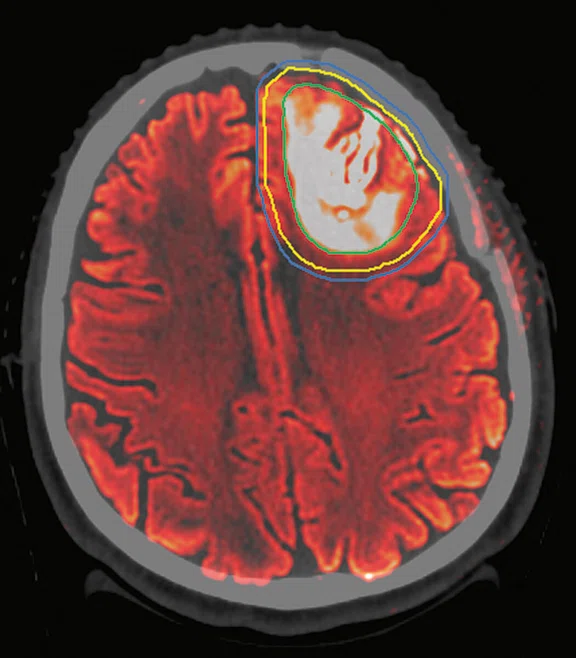
C
Figure 7.
Clinical case 3. (A) FLAIR MR image, (B) CT planning image and (C) MR image fused with CT image. (A–C) CTV (yellow line), GTV (green line) and PTV (blue line).
result


PREVIOUS
${prev-page}
NEXT
${next-page}
Subscribe Now
Manage Subscription
FOLLOW US
Contact Us • Cookie Preferences • Privacy Policy • California Privacy PolicyDo Not Sell or Share My Personal Information • Terms & Conditions • Security
© 2024 GE HealthCare. GE is a trademark of General Electric Company. Used under trademark license.
IN PRACTICE
Clinical implementation of PET/MR to help guide radiotherapy
Clinical implementation of PET/MR to help guide radiotherapy
by Romina Rita Ventimiglia, MD, radiotherapist, nuclear medicine physician, INTECNUS, Bariloche, Argentina Institutional Collaborators: Alejandro Alvarez, MD, radiotherapist, Rocío Brezán, medical physicist, Santiago Salazar, MD, radiologist, and Humberto Romano, medical physicist
One of the main objectives of the radiation therapy (RT) team is to delineate tumor targets and adjacent critical normal structures, called organs at risk (OARs), as accurately as possible. This way, an optimal dose coverage of the tumor and a reduced dose as low as reasonably achievable to the surrounding healthy tissues is guaranteed.
One of the main objectives of the radiation therapy (RT) team is to delineate tumor targets and adjacent critical normal structures, called organs at risk (OARs), as accurately as possible. This way, an optimal dose coverage of the tumor and a reduced dose as low as reasonably achievable to the surrounding healthy tissues is guaranteed.
INTENCUS Foundation began clinical delivery of radiotherapy in January 2018, followed by the implementation of PET/ MR (SIGNA™ PET/MR) in March 2019 for both PET/MR metabolic studies and morphological MR. In PET/MR imaging, we are utilizing FDG for oncology cases, 18F-choline‡ for prostate cancer cases and 18F-DOPA for the diagnosis of Parkinson’s disease.
In addition to providing radiotherapy services to the local residents in Bariloche, our institution has become a regional referral center. Approximately 1,000 patients have received radiotherapy in the four years since we opened our center.
The introduction of accurate dose calculation algorithms, intensity modulated radiation therapy (IMRT), image-guided radiation therapy (IGRT), stereotactic body radiation therapy (SBRT) and stereotactic radiosurgery (SRS) have impacted the clinical practice. To improve the accuracy of the treatment, the delineation of tumor targets is performed using the appropriate set of images for each particular case.
Computed tomography (CT) is essential in radiation treatment planning (RTP), as it provides tissue-specific attenuation coefficients, which are used to calculate the radiation dosage.
We’ve introduced MR in conjunction with CT for contrast enhancement in RTP. MR provides superior soft-tissue contrast compared to CT, enabling visualization of the extent of the tumor soft-tissue infiltration into normal tissue. In certain oncological pathologies, such as tumors of the central nervous system (CNS), MR and PET imaging are often used because of the anatomical and metabolic information that they provide. The fusion of these images with the planning CT can improve the accuracy of target delineation. Of the total patients treated thus far, 30 CNS cases – both primary and metastatic tumors – have involved fusing CT images with MR images.
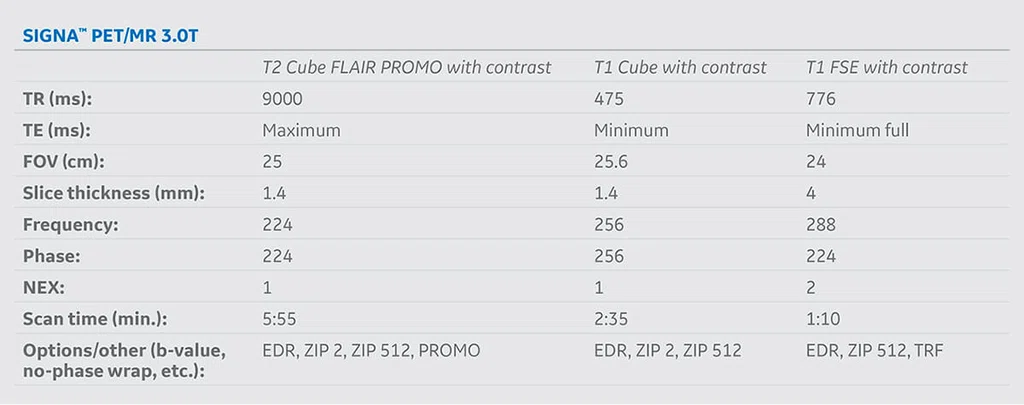
The clinical value of merging MR images with CT images is well understood.1,2 We use MR to contour both the tumor and the adjacent OARs in the CNS for the best anatomical detail, enabling better delineation of the tumor for more precise and effective radiotherapy treatments for both curative or palliative purposes, and for reducing toxicity and other adverse effects. Several oncological pathologies generate brain metastases in advanced stages of the disease. In those patients with life expectancy greater than one year, hippocampal sparing becomes essential to avoid cognitive deterioration/memory alterations. This technique requires fusing the planning CT with MR images to irradiate the entire brain and protect the sensitive structures. In primary tumors of the CNS, high doses of radiation are typically used, which are not well tolerated by critical structures such as the optic chiasm. The higher radiation dose also requires greater anatomical definition as provided by the MR images. Therefore, MR is essential to achieve precise and effective radiotherapy treatments, reduce margins in the target volume and protect the OARs and their function. The key MR sequences utilized for RTP of CNS tumors include T1 with contrast and T2/FLAIR.
Beyond CNS cases, we are planning to start using MR for pelvis RTP. In 3D gynecological brachytherapy cases, we have started fusing MR and CT images for planning and anticipate that it will become routine in both cervical and prostate cancer patients. Additionally, in tumor recurrences, the possibility to use imaging biomarkers in MR and PET/MR to evaluate treatment response increases the impact of these modalities for the adaptation of efficient treatment planning.
Current planning systems are able to accurately register CT and MR images in order to precisely delineate gross tumor volume (GTV), clinical target volume (CTV) and OARs, crucial to successfully executing IMRT, volumetric modulated arc therapy (VMAT), a type of IMRT technique, and SRS treatments. We are currently not performing RTP with MR-only or PET/MR-only imaging.
In the near future, we will be incorporating SRS and, therefore, fusing MR and CT images will be required in every case due to the high doses that are typically delivered in a single fraction, requiring the therapeutic dose to be sculpted around the OARs with great accuracy.
Workflow
The workflow and the integration of CT and MR with the TPS and LINAC are described in Figure 1. The following cases demonstrate the value of using MR to help guide RTP for tumor delineation and subsequent accurate radiation dose delivery.
Clinical case 1
Female patient diagnosed with WHO II low-grade glial tumor. Six months after surgical resection of the tumor, the patient manifested a right temporal headache, radiating to the homolateral auricle of the ear. The clinical oncology team evaluated the contrastenhanced brain MR, demonstrating surgical modifications with right temporo/sphenoidal craniotomy. Cortical/subcortical lesion was detected in the right frontal convexity, superior frontal gyrus. Adjuvant RT was recommended with concurrent chemotherapy. In this case, the MR images were used to draw the GTV.
Radiation therapy plan: VMAT treatment, 5040/180 cGy.
A
B
C
D
Figure 5.
Clinical case 1. (A) FLAIR MR image, (B) CT planning image, (C) MR image fused with CT image and (D) radiation dose distribution. (A–C) CTV (blue line), GTV (magenta line) and PTV (red line).
Clinical case 2
Male patient diagnosed with glioblastoma multiforme using MR and confirmed with biopsy. Treatment was performed with maximum resection. Subsequent monitoring of the patient two months after surgery with MR, the following were diagnosed: persistence of the tumor, left temporo-spheno-parietal craniotomy and left temporal chronic stage hematoma, for which he was referred for definitive radiotherapy and adjuvant chemotherapy.
Radiation therapy plan: VMAT treatment, 4600/200 cGy + sequential boost 1400/200 cGy.
Clinical case 3
Male patient with a history of non-ulcerated nodular melanoma and surgery in the dorsal region in 2017, after which the disease metastasized and he was treated with immunotherapy and chemotherapy. In 2019, he suffered conduct disorders and seizures. Melanoma metastasis was diagnosed in a brain MR, corroborated by biopsy. Post-biopsy MR was performed for RTP where partial resection was seen at the left frontal level, multiple nodular images with bi-hemispheric distribution predominantly frontal, parietal, and an impression of leptomeningeal reinforcement as well as left frontal parameningeal.
Radiation therapy plan: IMRT treatment, holocraneal 4000/200 cGy + simultaneous integrated boost 5000/250 cGy.


