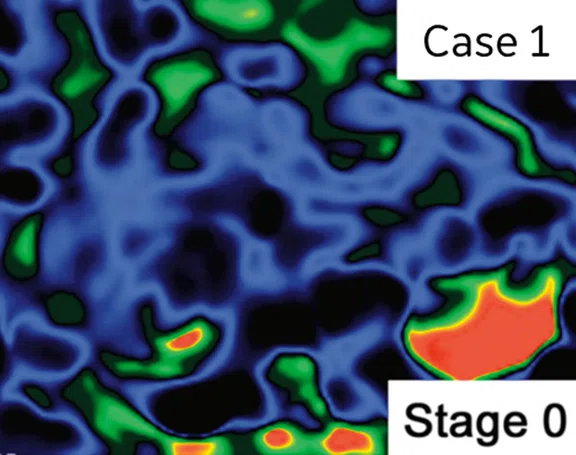
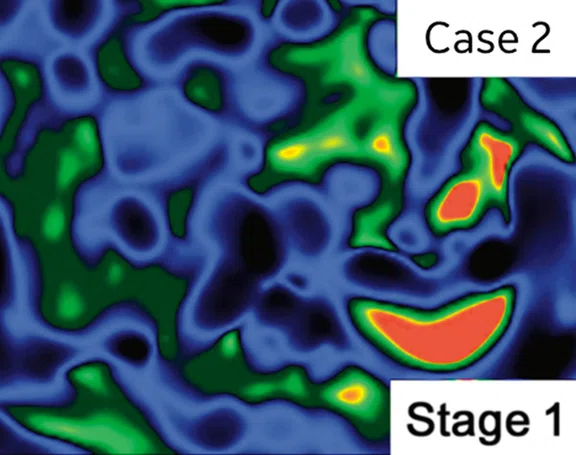
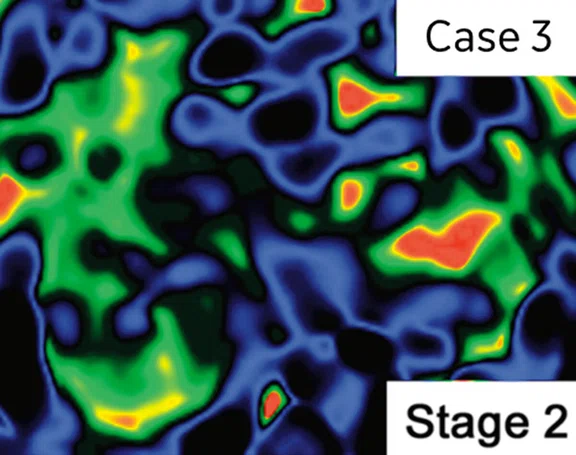
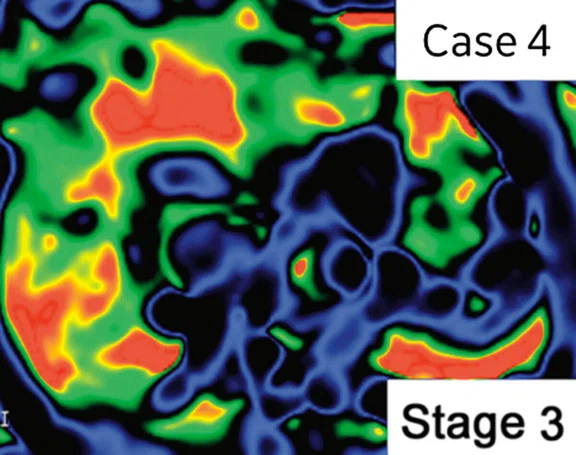
Figure 2.
Exacerbation of liver disease due to iron overload.
1. Paik JM, Golabi P, Younossi Y, Mishra A, Younossi ZM. Changes in the Global Burden of Chronic Liver Diseases From 2012 to 2017: The Growing Impact of NAFLD. Hepatology. 2020 Nov;72(5):1605-1616.
2. Imajo K, Kessoku T, Honda Y, et al. Magnetic Resonance Imaging More Accurately Classifies Steatosis and Fibrosis in Patients With Nonalcoholic Fatty Liver Disease Than Transient Elastography. Gastroenterology. 2016 Mar;150(3):626-637.e7.
3. Hsu C, Caussy C, Imajo K, et al. Magnetic Resonance vs Transient Elastography Analysis of Patients With Nonalcoholic Fatty Liver Disease: A Systematic Review and Pooled Analysis of Individual Participants. Clin Gastroenterol Hepatol. 2019 Mar;17(4):630-637.e8.
4. Imajo K, Honda Y, Kobayashi T, et al. Direct Comparison of US and MR Elastography for Staging Liver Fibrosis in Patients With Nonalcoholic Fatty Liver Disease. Clin Gastroenterol Hepatol. 2020 Dec 17:S1542-3565(20)31673-6.
4. Imajo K, Honda Y, Kobayashi T, et al. Direct Comparison of US and MR Elastography for Staging Liver Fibrosis in Patients With Nonalcoholic Fatty Liver Disease. Clin Gastroenterol Hepatol. 2020 Dec 17:S1542-3565(20)31673-6.
A
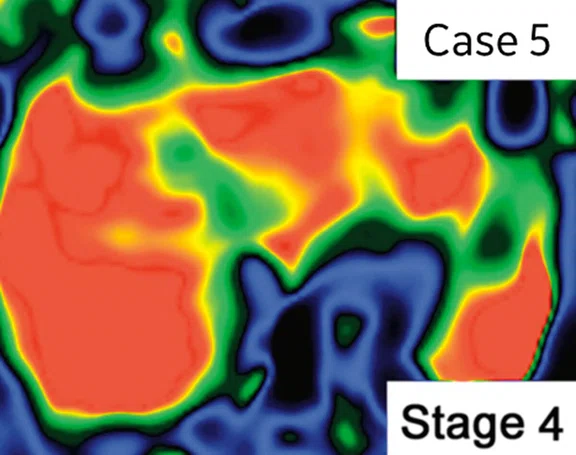
Figure 1.
MRE by fibrosis stage in NAFLD patients.
B
Figure 1.
MRE by fibrosis stage in NAFLD patients.
C
Figure 1.
MRE by fibrosis stage in NAFLD patients.
D
Figure 1.
MRE by fibrosis stage in NAFLD patients.
E
Figure 1.
MRE by fibrosis stage in NAFLD patients.
5. Pitisuttithum P, Chan WK, Goh GB, et al. Gamma-glutamyl transferase and cardiovascular risk in nonalcoholic fatty liver disease: The Gut and Obesity Asia initiative. World J Gastroenterol. 2020;26(19):2416-2426.
6. Yoneda M, Yamamoto T, Honda Y, et al.. Risk of cardiovascular disease in patients with fatty liver disease as defined from the metabolic dysfunction associated fatty liver disease or nonalcoholic fatty liver disease point of view: a retrospective nationwide claims database study in Japan. J Gastroenterol. 2021 Nov;56(11):1022-1032.
7. Kawamura N, Imajo K, Kalutkiewicz KJ, et al. Influence of liver stiffness heterogeneity on staging fibrosis in patients with nonalcoholic fatty liver disease. Hepatology. 2021 Dec 24. Epub ahead of print.
8. Imajo K, Kessoku T, Honda Y, et al. MRI-Based Quantitative R2* Mapping at 3 Tesla Reflects Hepatic Iron Overload and Pathogenesis in Nonalcoholic Fatty Liver Disease Patients. J Magn Reson Imaging. 2022 Jan;55(1):111-125.
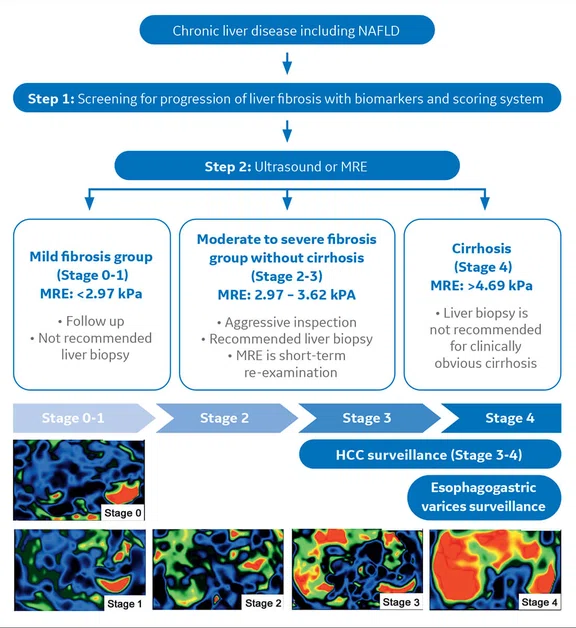
Figure 4.
Two-step algorithm for diagnosing liver fibrosis. Yoneda M, Imajo K, et al. J Gastroentelogy 2017. Modification.
2. Imajo K, Kessoku T, Honda Y, et al. Magnetic Resonance Imaging More Accurately Classifies Steatosis and Fibrosis in Patients With Nonalcoholic Fatty Liver Disease Than Transient Elastography. Gastroenterology. 2016 Mar;150(3):626-637.e7.
3. Hsu C, Caussy C, Imajo K, et al. Magnetic Resonance vs Transient Elastography Analysis of Patients With Nonalcoholic Fatty Liver Disease: A Systematic Review and Pooled Analysis of Individual Participants. Clin Gastroenterol Hepatol. 2019 Mar;17(4):630-637.e8.
4. Imajo K, Honda Y, Kobayashi T, et al. Direct Comparison of US and MR Elastography for Staging Liver Fibrosis in Patients With Nonalcoholic Fatty Liver Disease. Clin Gastroenterol Hepatol. 2020 Dec 17:S1542-3565(20)31673-6.
4. Imajo K, Honda Y, Kobayashi T, et al. Direct Comparison of US and MR Elastography for Staging Liver Fibrosis in Patients With Nonalcoholic Fatty Liver Disease. Clin Gastroenterol Hepatol. 2020 Dec 17:S1542-3565(20)31673-6.
9. Ozaki A, Yoneda M, Kessoku T, et al. Effect of tofogliflozin and pioglitazone on hepatic steatosis in non-alcoholic fatty liver disease patients with type 2 diabetes mellitus: A randomized, open-label pilot study (ToPiND study). Contemp Clin Trials Commun. 2019 Dec 31;17:100516.
10. Nishimiya N, Tajima K, Imajo K, et al. Effects of Canagliflozin on Hepatic Steatosis, Visceral Fat and Skeletal Muscle among Patients with Type 2 Diabetes and Non-alcoholic Fatty Liver Disease. Intern Med. 2021;60(21):3391-3399.
11. Nakajima A, Eguchi Y, Yoneda M, et al. Randomised clinical trial: Pemafibrate, a novel selective peroxisome proliferatoractivated receptor a modulator (SPPARMa), versus placebo in patients with non-alcoholic fatty liver disease. Aliment Pharmacol Ther. 2021 Nov;54(10):1263-1277.
8. Imajo K, Kessoku T, Honda Y, et al. MRI-Based Quantitative R2* Mapping at 3 Tesla Reflects Hepatic Iron Overload and Pathogenesis in Nonalcoholic Fatty Liver Disease Patients. J Magn Reson Imaging. 2022 Jan;55(1):111-125.
12. Jung J, Loomba RR, Imajo K, et al. MRE combined with FIB-4 (MEFIB) index in detection of candidates for pharmacological treatment of NASH-related fibrosis. Gut. 2021 Oct;70(10):1946-1953.
13. Tamaki N, Imajo K, Sharpton SR, et al. Two-Step Strategy, FIB-4 Followed by Magnetic Resonance Elastography, for Detecting Advanced Fibrosis in NAFLD. Clin Gastroenterol Hepatol. 2022 Feb 2:S1542-3565(22)00077-5.
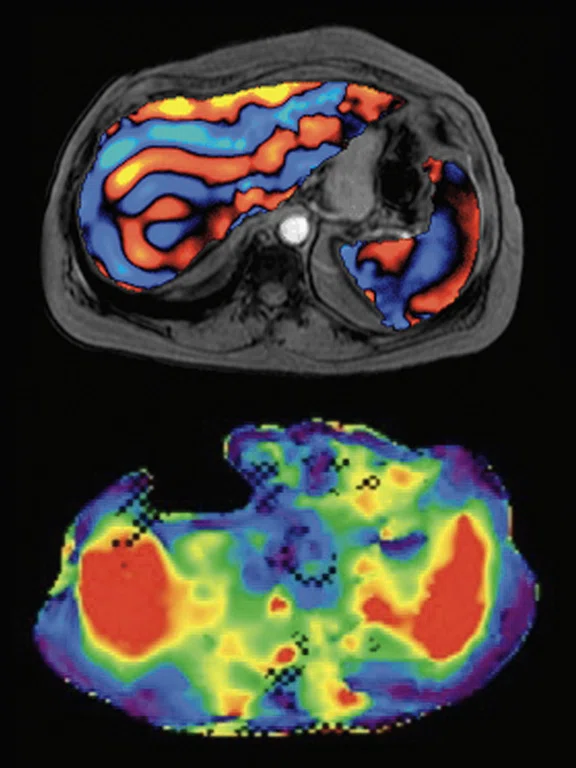
Figure 5.
Liver stiffness measurement (LSM) or spleen stiffness measurement (SSM).
14. Imajo K, Tetlow L, Dennis A, et al. Quantitative multiparametric magnetic resonance imaging can aid nonalcoholic steatohepatitis diagnosis in a Japanese cohort. World J Gastroenterol. 2021 Feb 21;27(7):609-623.
15. Andersson A, Kelly M, Imajo K, et al. Clinical Utility of Magnetic Resonance Imaging Biomarkers for Identifying Nonalcoholic Steatohepatitis Patients at High Risk of Progression: A Multicenter Pooled Data and Meta- Analysis. Clin Gastroenterol Hepatol. 2021 Oct 7:S1542- 3565(21)01056-9.
17. Resoundant, Inc. 2020. MREplus+. Available at https://www.
resoundant.com/mreplus. Accessed March 1, 2022.
18. Hernando D, Cook RJ, Qazi N, Longhurst CA, Diamond CA, Reeder SB. Complex confounder-corrected R2* mapping for liver iron quantification with MRI. Eur Radiol. 2021 Jan;31(1):264-275.
19. Matsui N, Imajo K, Yoneda M, Kessoku T, Honda Y, Ogawa Y, Tomeno W, Fujisawa N, Misumi T, Kazumi K, Saito S, Nakajima A. Magnetic resonance elastography increases usefulness and safety of non-invasive screening for esophageal varices. J Gastroenterol Hepatol. 2018 Dec;33(12):2022-2028.
‡ Technology in development that represents ongoing research and development efforts. These technologies are not products and may never become products. Not for sale. Not cleared or approved by the US FDA or any other global regulator for commercial availability.
16. Leclerc GE, Charleux F, Robert L, et al. Analysis of liver viscosity behavior as a function of multifrequency magnetic resonance elastography (MMRE) postprocessing. J Magn Reson Imaging. 2013 Aug;38(2):422-8.
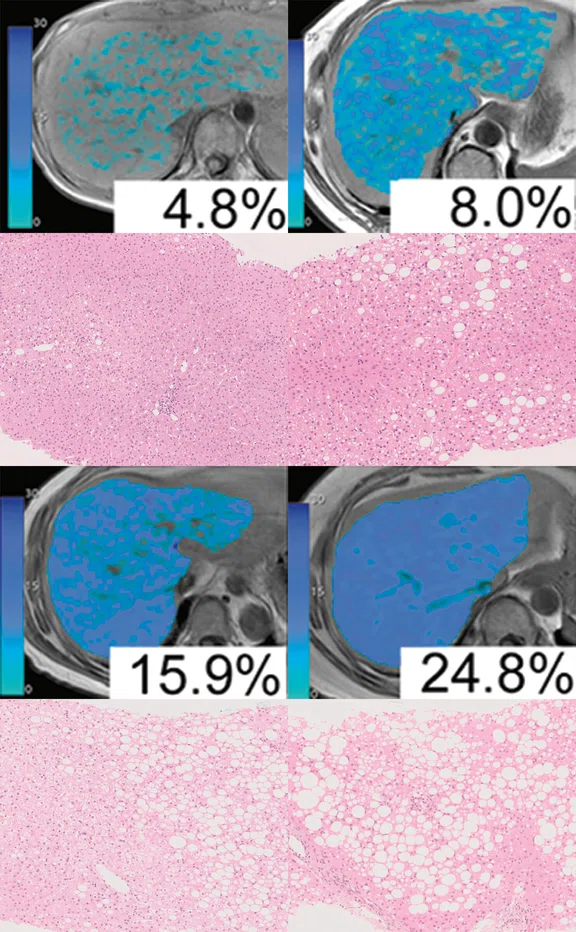
Figure 3.
Comparison of proton density fat fraction map using IDEAL IQ and biopsy by grade in fatty liver.
result
PREVIOUS
${prev-page}
NEXT
${next-page}


Subscribe Now
Manage Subscription
FOLLOW US
contact us • privacy policy • terms & conditions
© 2023 GE HealthCare. GE is a trademark of the General Electric Company used under trademark license.


IN PRACTICE
Developing an evidence-based liver MR imaging service
Developing an evidence-based liver MR imaging service
by Kento Imajo, MD, PhD, Director, Department of Gastroenterological Medicine, Shin-Yurigaoka General Hospital, Kawasaki, Japan and Atsushi Nakajima, MD, PhD, Professor, Department of Gastroenterology and Hepatology, Yokohama City University Graduate School of Medicine, Yokohama, Japan
The global burden of liver disease is steadily increasing, with nonalcoholic fatty liver disease (NAFLD) the largest contributor to liver mortality.1 Fatty liver, also referred to as steatosis, is a common liver histological finding in patients with obesity, hepatitis C, alcohol intake and exposure to certain drugs, such as corticosteroids.
The global burden of liver disease is steadily increasing, with nonalcoholic fatty liver disease (NAFLD) the largest contributor to liver mortality.1 Fatty liver, also referred to as steatosis, is a common liver histological finding in patients with obesity, hepatitis C, alcohol intake and exposure to certain drugs, such as corticosteroids.
Liver biopsy remains the gold standard for accurate diagnosis of liver fat content, however, it is an invasive procedure and difficult to repeat. Furthermore, the diagnosis of fatty liver disease using B-mode in ultrasound is simple and non-invasive, yet the quantification is poor and the diagnosis of mild steatosis is difficult.
MR elastography (MRE) has been reported to have a high diagnostic ability for detecting liver fibrosis in various chronic liver diseases. We have been using MRE since the end of 2014 and have specifically investigated its usefulness for the diagnosis of liver fibrosis in patients with NAFLD (Figure 1).2-4
Our current MRE and IDEAL IQ exams average 20 cases per month. While most of the MRE orders are from gastroenterologists, other departments, such as nephrology, are considering applying MRE to diagnose nephrosclerosis in the kidney.
Institutional experience
Clinical orders for evaluating a patient for fatty liver disease often arise from a routine medical check-up, particularly for patients who are obese or have a history of alcohol consumption. The percent of steatosis cases in our hospitals are approximately 80% from NAFLD, 10% from alcoholic fatty liver and 10% from other causes.
Most patients referred to the Gastroenterology Department are due to an abnormal liver function test (blood test) from a routine medical exam. In addition, many patients with steatosis have diabetes as an underlying disease, so there are many requests from the Department of Diabetology. Patients with steatosis are often at a higher risk for heart disease, such as angina, and patients with both heart and fatty liver disease should have the condition of their liver regularly checked.5,6
MRE is performed during an MR exam of the liver and is safe and inexpensive to use.7 It is easily repeatable, enabling the collection of important data for patient follow-up to evaluate treatment and disease progression. Unlike MRE, liver biopsy is prone to sampling errors and complications that may make repeated tests difficult.
The decision to perform a biopsy is typically based on vibration-controlled transient elastography (VCTE) results (e.g., FibroScan®), although in the future it is anticipated that MR will be increasingly utilized for this purpose. A biopsy is also prioritized when the diagnosis of liver disease is uncertain based on other tests or exams. In addition, a biopsy is required when diagnosing cell infiltration of autoimmune hepatitis or when conducting a clinical trial. However, in our experience, the liver segment that should be biopsied for pathology already has an impression that it is hard or stiff. Further, segment IV in the liver is difficult to safely biopsy due to the location of the lung and the risk of perforating or injuring it. MRE is a useful alternative for liver segments where a biopsy sample is difficult to obtain.
In addition, MRE is useful for the evaluation of fibrosis in routine medical care. Even in cases where the liver has less fat, a high MRE score indicates that liver fibrosis is progressing.
Liver protocol
In our hospitals, MRE is performed on a Discovery™ MR750w 3.0T system. We also utilize IDEAL IQ to obtain fat fraction and also R2* values for the diagnosis of iron deposits, which is important in evaluating liver disease (Figure 2).8
We have reported a direct comparison between MRE and VCTE.2-4 VCTE is most commonly used in an ultrasound elastogram exam. Liver fibrosis in NAFLD patients increases the liver stiffness obtained by MRE and VCTE as the stage progresses. Furthermore, it was reported that the capability to diagnose liver fibrosis with MRE was equivalent to or higher than VCTE at each stage of the disease. Particularly remarkable with MRE is the difference in AUROC values between stage 2 and above, as well as the clearly superior MRE diagnostic ability in stage 4. In addition, MRE was able to measure liver stiffness even in patients who are severely obese or have a narrow intercostal space and cannot be measured with VCTE.
The most important factor is the high accuracy of MRE for diagnosing fatty liver disease. Also, we have found MRE to be less dependent on the operator than a biopsy or ultrasound elastogram. Often, fibrosis cannot be diagnosed in the liver locally using only biopsy. Conversely, it’s easy to see in an MRE image that the liver isn’t evenly stiff, which is often the cause of sampling errors with biopsy. MRE has few sampling errors and provides similar results across different types of patients. Further, MRE is also useful for making decisions regarding patient inclusion and evaluating emerging treatments when conducting clinical trials.9-11 We hope that MRE will replace biopsy as a gold standard in the future for this purpose.
As previously noted, we also utilize IDEAL IQ in our fatty liver patient workup, as it is very useful for diagnosing NAFLD (Figure 3). In a patient with steatosis, it is important to diagnose the presence or absence of fibrosis. Survival in NAFLD patients correlates with liver fibrosis and, therefore, MRE and IDEAL IQ should be performed together.
In addition, IDEAL IQ can measure R2*, which also assists in diagnosing liver disease.8 It is also important to evaluate hemochromatosis and determine the effect of treatment once a patient is diagnosed with fatty liver disease or hepatitis. The accuracy of PDFF and R2* is well known — the measurement is reproducible and the entire liver can be evaluated.
To verify the existence of hepatocellular carcinoma (HCC), DWI, T2 and T1 sequences are included in the protocol. Contrast media is rarely used in an MR exam for fatty liver disease. However, in the case of a patient with a known liver mass or severe cirrhosis, contrast enhancement sequences may be performed.
Creating a comprehensive liver imaging program
In developing our comprehensive MR liver imaging program and to identify high-risk NAFLD patients, we use a two-step diagnostic algorithm (Figure 4). All patients with liver disease are screened to rule out hepatitis (A/B/C type, autoimmune hepatitis, etc.). Also, patients referred to gastroenterology from a medical exam have already undergone an ultrasound elastogram. After blood tests have ruled out diseases other than fatty liver, the liver stiffness must be confirmed. To some extent, the fibrosis marker of the blood test can provide some information, however, liver stiffness does not exactly match fibrosis and thus a MRE exam is ordered.12-13
With MRE it is possible to distinguish between liver viscosity and elasticity. Corrected T1 values using multiparametric MR are useful for diagnosing liver inflammation and fibrosis.14-15 There is also the possibility that elasticity and viscosity can be separated by multifrequency MRE (MMRE)‡.16
There are several considerations to keep in mind. The region of interest for the MRE stiffness measurement is set manually, so there may be some bias due to the operator. However, this bias will be reduced by automating the ROI setting using AI.17 Also, iron deposition can only be evaluated by R2*, which requires a different solution (IDEAL IQ).18
A disadvantage of MRE is the long breath-holding time. Patients are tired after the MRE portion of the MR exam, so hopefully future developments can improve this.
Additionally, it has been reported that liver stiffness measurement is important for diagnosing the presence of esophageal varices.19 It is also reported that spleen stiffness measurement (SSM) can diagnose portal hypertension with higher accuracy than liver stiffness measurement (Figure 5). While our hospitals are currently not performing these exams, it is an area we would like to pursue.
Summary
In our institutions, we have been using MRE and IDEAL IQ clinically for some time, but there are not many exams and patients at present. Also, there are few facilities that perform MRE in a clinical setting. However, MRE and IDEAL IQ are highly accurate when used to examine a patient with steatosis, so it is reasonable to utilize them both when evaluating liver disease. Because MRE is part of an MR exam, it is possible to also diagnose malignant tumors using other MR sequences.
An MR exam is very useful because it is non-invasive and has a low risk of complications for the patient. Unlike ultrasound that is dependent on the skill of the operator, MR protocols can be standardized across operators. MR has the advantage of enabling additional analyses and the data and exam results can be quantified.
Currently, biopsy is the gold standard for a liver exam, however, we expect that liver diagnosis will be relegated to MR and MRE in the future.
Currently, biopsy is the gold standard for a liver exam, however, we expect that liver diagnosis will be relegated to MR and MRE in the future.


