‡Not licensed in accordance with Canadian law. Not available for sale in Canada. Not CE marked. Not available for sale in all regions.
‡Not licensed in accordance with Canadian law. Not available for sale in Canada. Not CE marked. Not available for sale in all regions.
Not licensed in accordance with Canadian law. Not available for sale in Canada. Not CE marked. Not available for sale in all regions.
‡Drug products should be used in accordance with their approved labeling. Gadolinium-based contrast agents have not been approved for cardiac use in all regions.
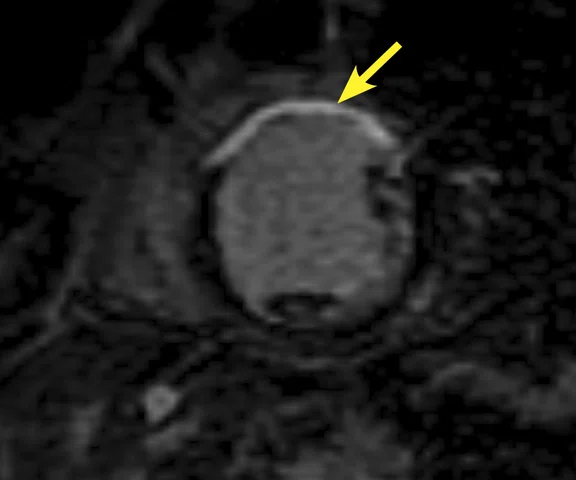
A
Figure 1.
Comparison of 2D MDE and PS MDE. PS MDE provides better visualization of the fibrosis and better suppression of healthy myocardium signal even with non-optimal TI values. (A) 2D MDE SA, 2:06 min; (B) magnitude PS MDE; (C) phase PS MDE SA. Yellow arrows indicate ischemia induced fibrosis; (B-C) red arrows depict a healthy myocardium signal not suppressed on magnitude PS MDE with suboptimal TI value; using the phase sensitive image from the same acquisition helped to fix this issue.
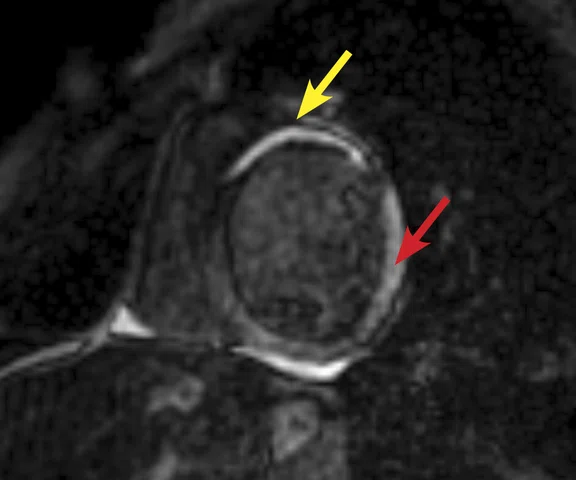
B
Figure 1.
Comparison of 2D MDE and PS MDE. PS MDE provides better visualization of the fibrosis and better suppression of healthy myocardium signal even with non-optimal TI values. (A) 2D MDE SA, 2:06 min; (B) magnitude PS MDE; (C) phase PS MDE SA. Yellow arrows indicate ischemia induced fibrosis; (B-C) red arrows depict a healthy myocardium signal not suppressed on magnitude PS MDE with suboptimal TI value; using the phase sensitive image from the same acquisition helped to fix this issue.
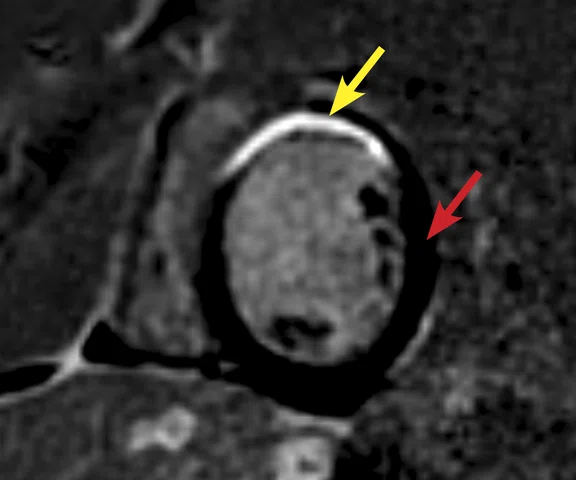
C
Figure 1.
Comparison of 2D MDE and PS MDE. PS MDE provides better visualization of the fibrosis and better suppression of healthy myocardium signal even with non-optimal TI values. (A) 2D MDE SA, 2:06 min; (B) magnitude PS MDE; (C) phase PS MDE SA. Yellow arrows indicate ischemia induced fibrosis; (B-C) red arrows depict a healthy myocardium signal not suppressed on magnitude PS MDE with suboptimal TI value; using the phase sensitive image from the same acquisition helped to fix this issue.
A
Figure 2.
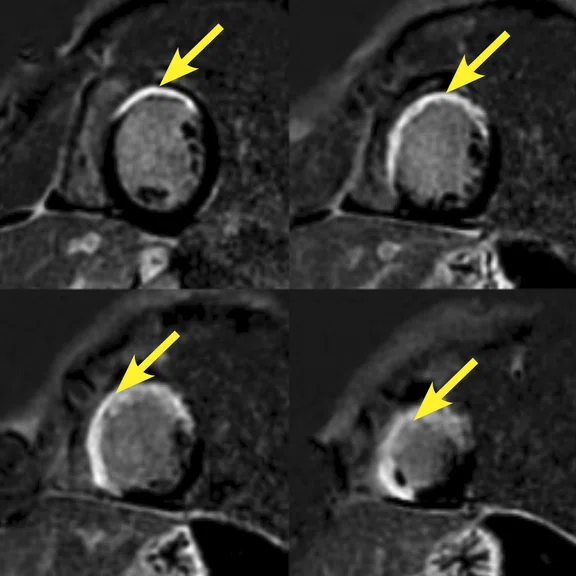
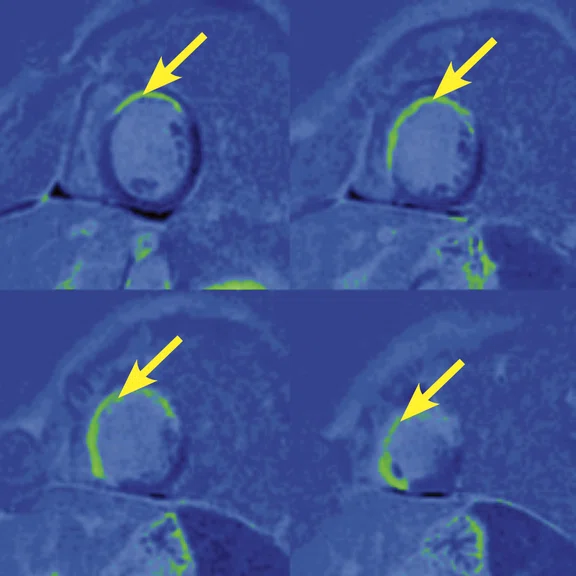
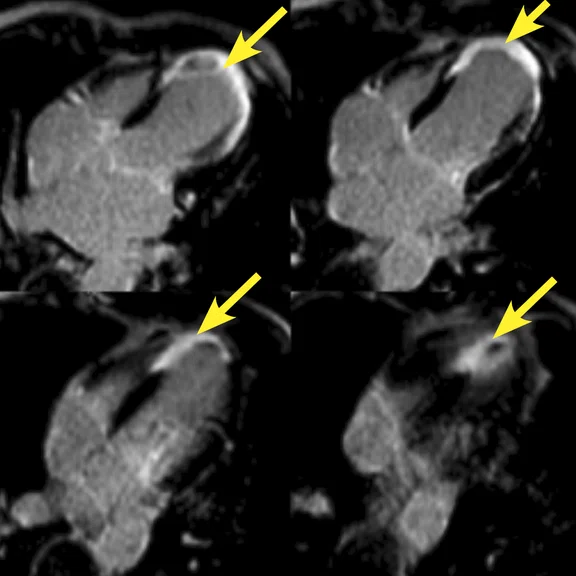
Myocardial viability study. (A, B with color map) 2D PS MDE SA, 1:59 min.; and (C) 2D MDE 4 chambers, 2 min. Yellow arrows indicate ischemia-induced fibrosis.
B
Figure 2.
Myocardial viability study. (A, B with color map) 2D PS MDE SA, 1:59 min.; and (C) 2D MDE 4 chambers, 2 min. Yellow arrows indicate ischemia-induced fibrosis.
C
Figure 2.
Myocardial viability study. (A, B with color map) 2D PS MDE SA, 1:59 min.; and (C) 2D MDE 4 chambers, 2 min. Yellow arrows indicate ischemia-induced fibrosis.
A
Figure 3.
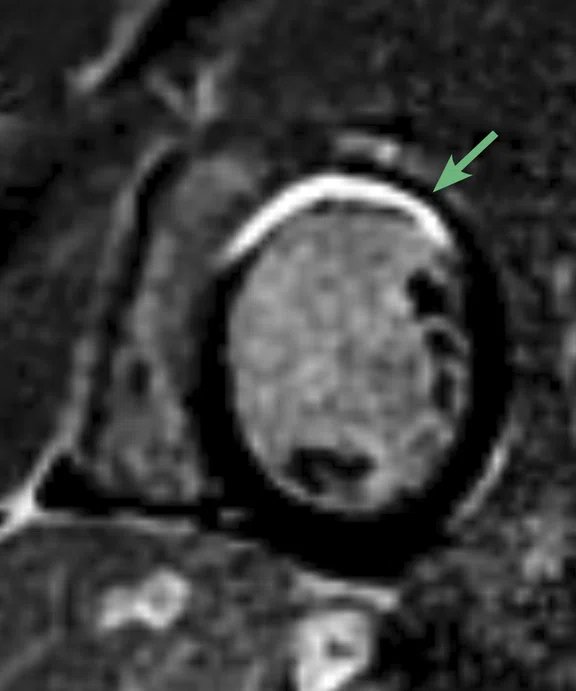
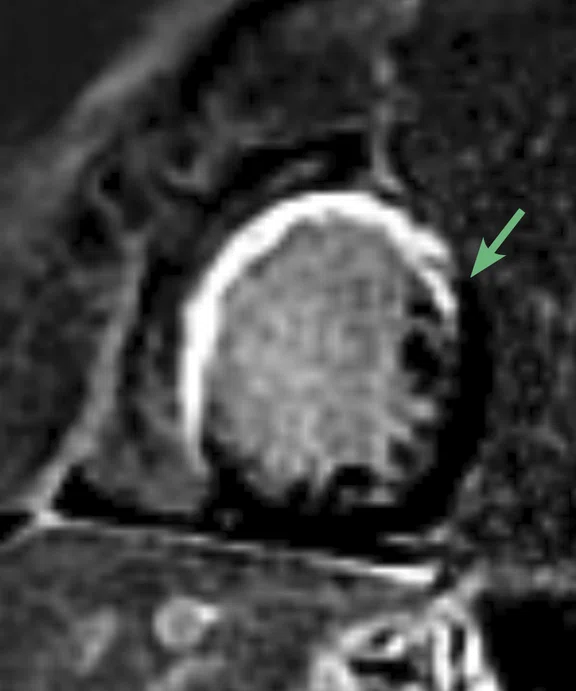
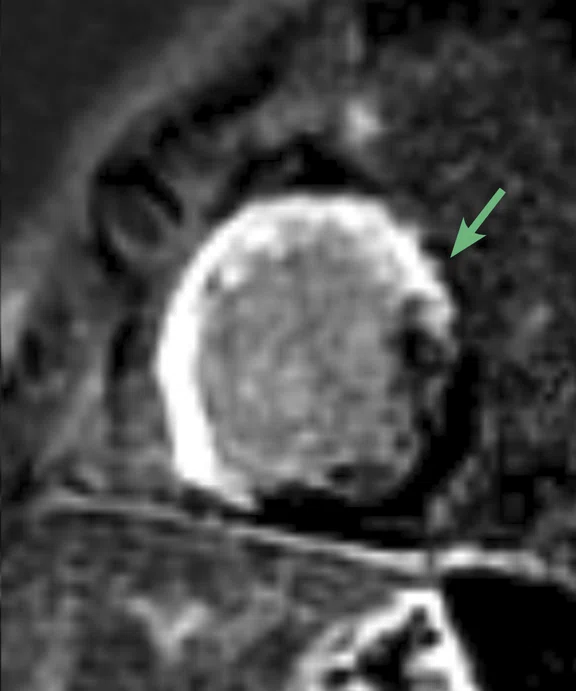
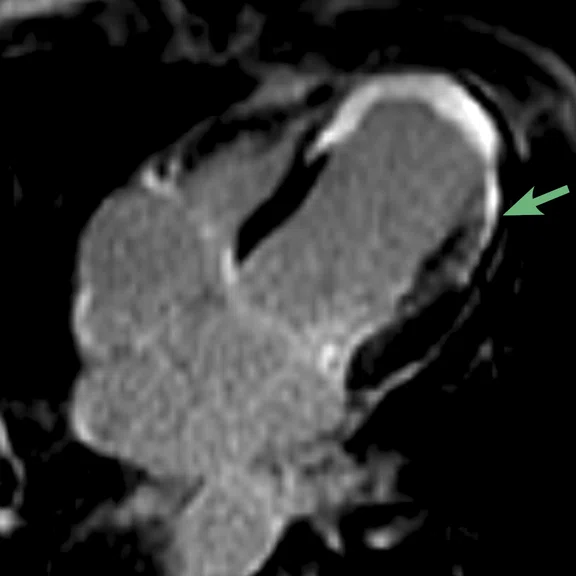
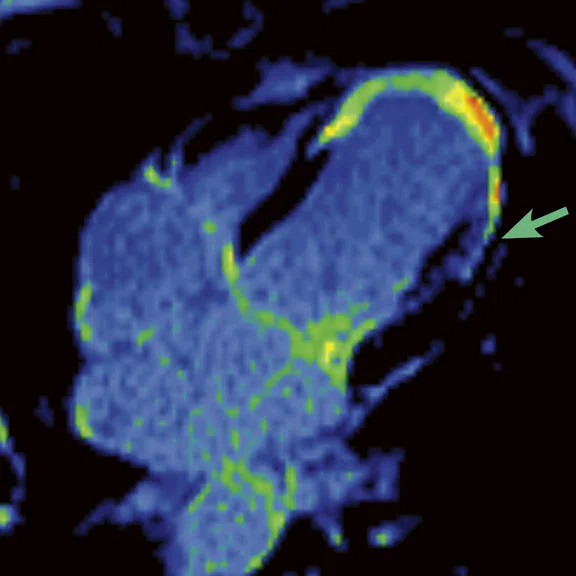
Myocardial viability study. (A-C) PS MDE SA, 2 min.; (D, E with color map) 2D MDE 4 chambers, 1:59 min. Green arrows demonstrate midventricular anterior segment of LAD coronary territory showing viability criteria.
B
Figure 3.
Myocardial viability study. (A-C) PS MDE SA, 2 min.; (D, E with color map) 2D MDE 4 chambers, 1:59 min. Green arrows demonstrate midventricular anterior segment of LAD coronary territory showing viability criteria.
C
Figure 3.
Myocardial viability study. (A-C) PS MDE SA, 2 min.; (D, E with color map) 2D MDE 4 chambers, 1:59 min. Green arrows demonstrate midventricular anterior segment of LAD coronary territory showing viability criteria.
D
Figure 3.
Myocardial viability study. (A-C) PS MDE SA, 2 min.; (D, E with color map) 2D MDE 4 chambers, 1:59 min. Green arrows demonstrate midventricular anterior segment of LAD coronary territory showing viability criteria.
E
Figure 3.
Myocardial viability study. (A-C) PS MDE SA, 2 min.; (D, E with color map) 2D MDE 4 chambers, 1:59 min. Green arrows demonstrate midventricular anterior segment of LAD coronary territory showing viability criteria.
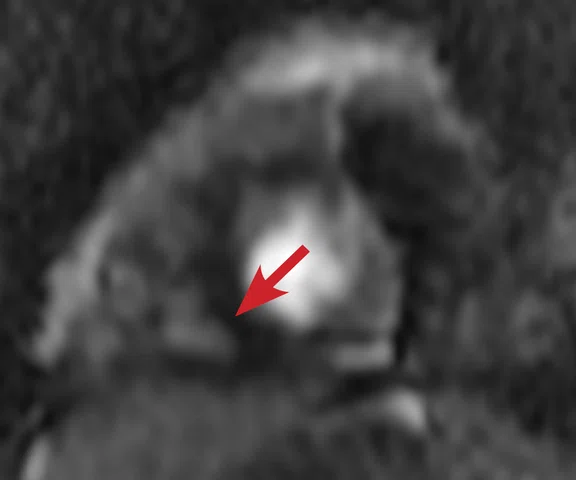
A
Figure 4.
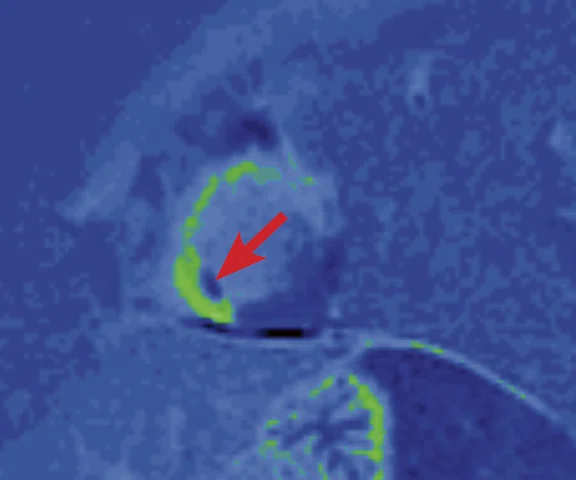
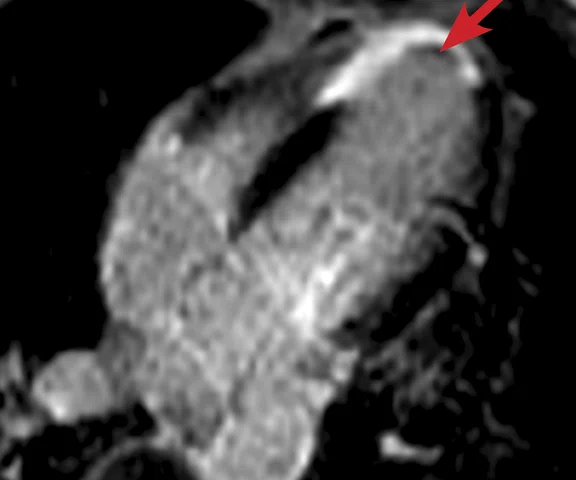
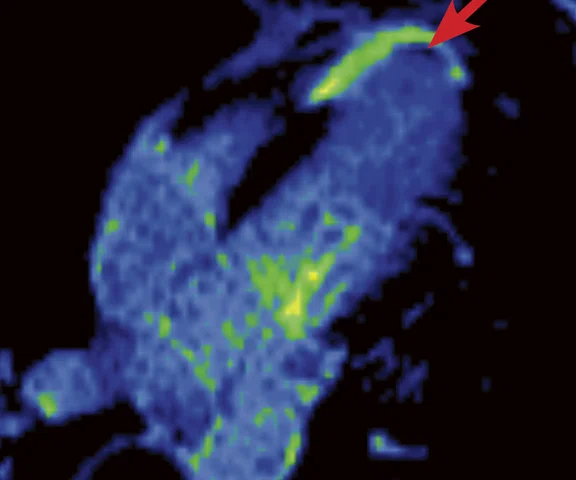
(A) Perfusion FGRE TC SA, 1:04 min.; (B) PS MDE SA with color map, 2 min.; and (C, D with color map) 2D MDE 4 chambers, 1:59 min.
Red arrows show the sub-endocardial no-refl ow phenomenon on the inferoseptal region of the apex.
B
Figure 4.
(A) Perfusion FGRE TC SA, 1:04 min.; (B) PS MDE SA with color map, 2 min.; and (C, D with color map) 2D MDE 4 chambers, 1:59 min.
Red arrows show the sub-endocardial no-refl ow phenomenon on the inferoseptal region of the apex.
C
Figure 4.
(A) Perfusion FGRE TC SA, 1:04 min.; (B) PS MDE SA with color map, 2 min.; and (C, D with color map) 2D MDE 4 chambers, 1:59 min.
Red arrows show the sub-endocardial no-refl ow phenomenon on the inferoseptal region of the apex.
D
Figure 4.
(A) Perfusion FGRE TC SA, 1:04 min.; (B) PS MDE SA with color map, 2 min.; and (C, D with color map) 2D MDE 4 chambers, 1:59 min.
Red arrows show the sub-endocardial no-refl ow phenomenon on the inferoseptal region of the apex.
‡Drug products should be used in accordance with their approved labeling. Gadolinium-based contrast agents have not been approved for cardiac use in all regions.
D
Figure 3.
Myocardial viability study. (A-C) PS MDE SA, 2 min.; (D, E with color map) 2D MDE 4 chambers, 1:59 min. Green arrows demonstrate midventricular anterior segment of LAD coronary territory showing viability criteria.
E
Figure 3.
Myocardial viability study. (A-C) PS MDE SA, 2 min.; (D, E with color map) 2D MDE 4 chambers, 1:59 min. Green arrows demonstrate midventricular anterior segment of LAD coronary territory showing viability criteria.
A
Figure 3.
Myocardial viability study. (A-C) PS MDE SA, 2 min.; (D, E with color map) 2D MDE 4 chambers, 1:59 min. Green arrows demonstrate midventricular anterior segment of LAD coronary territory showing viability criteria.
B
Figure 3.
Myocardial viability study. (A-C) PS MDE SA, 2 min.; (D, E with color map) 2D MDE 4 chambers, 1:59 min. Green arrows demonstrate midventricular anterior segment of LAD coronary territory showing viability criteria.
C
Figure 3.
Myocardial viability study. (A-C) PS MDE SA, 2 min.; (D, E with color map) 2D MDE 4 chambers, 1:59 min. Green arrows demonstrate midventricular anterior segment of LAD coronary territory showing viability criteria.
result


PREVIOUS
${prev-page}
NEXT
${next-page}
Subscribe Now
Manage Subscription
FOLLOW US
Contact Us • Cookie Preferences • Privacy Policy • California Privacy PolicyDo Not Sell or Share My Personal Information • Terms & Conditions • Security
© 2024 GE HealthCare. GE is a trademark of General Electric Company. Used under trademark license.
CASE STUDIES
Detecting ischemia-induced cardiac fibrosis with phase sensitive MDE
Detecting ischemia-induced cardiac fibrosis with phase sensitive MDE
By Abdelhamid Derriche, MD, site radiologist, and Orkia Ferdagha, MR technologist, PRIISM, EHP Kara
In cardiac patients, particularly those who have a history of ischemia, determining myocardial viability is critical for planning the patient care pathway as it allows us to identify patients who would not benefit from angioplasty. Myocardial delayed enhancement (MDE) sequences are typically employed for these studies.
A strong saturation of healthy myocardium signal on MDE sequences allows for a better delineation and assessment of ischemic induced cardiac fibrosis. However, the most optimal inversion time value (TI) is needed for acquiring a reliable and clinically useful MDE study. Cine IR allows us to obtain this value even though the TI time continually changes as the contrast washes out.‡
The introduction of a phase sensitive MDE (PS MDE) sequence now allows for better suppression of healthy myocardium signal even with non-optimal TI values. Additionally, we can avoid rescanning patients in cases of poorly suppressed healthy myocardium signal due to incorrect TI value selection by only evaluating the PS MDE sequence (see Figure 1).
Figure 1.
Comparison of 2D MDE and PS MDE. PS MDE provides better visualization of the fibrosis and better suppression of healthy myocardium signal even with non-optimal TI values. (A) 2D MDE SA, 2:06 min; (B) magnitude PS MDE; (C) phase PS MDE SA. Yellow arrows indicate ischemia induced fibrosis; (B-C) red arrows depict a healthy myocardium signal not suppressed on magnitude PS MDE with suboptimal TI value; using the phase sensitive image from the same acquisition helped to fix this issue.
Patient history
A 60-year-old male with a history of cardiac ischemia referred for a myocardial viability MR exam including function, perfusion and the qualitative analysis of the myocardial viability. The patient has ischemia-induced fibrosis on diseased heart tissues.
MR findings
The left ventricular (LV) function study provides an estimated fractional ejection of 24% and depicts a diffuse akinetic apical contraction with midventricular hypokinesia with anteroseptal predominance.
Perfusion study shows an anomaly with delayed and reduced contrast enhancement with predominance on the subendocardial antero-septo-lateral midventricular region.
MDE demonstrates a systematic myocardial fibrosis belonging to the left anterior descending (LAD) coronary territory (see Figure 2).
With contrast uptake we found:
- Transmural on apical anteroseptal;
- Transmural on midventricular septal;
- Inferior to 50% of myocardial thickness on subendocardial anterior midventricular region;
- Sub-endocardial no-reflow phenomenon on the infero-septal region of the apex (also observed on perfusion sequence);
- No regional myocardial parietal thinning of less than 6 mm.
Discussion
Using PS MDE, it was possible to assess myocardial necrosis with systematized transmural fibrosis on the LAD coronary territory in the apical anteroseptal region and midventricular septal region as non-viability criteria. Additionally, we determined myocardial ischemia with subendocardial fibrosis inferior to 50% of parietal thickness of the anterior segment of the midventricular region with viability criteria as well as hypokinesia of apical and midventricular regions with diminution of LV fractional ejection.
PS MDE provides very good contrast and good delineation of fibrosis, especially in cases where determining the optimal TI value is complicated. We now have an alternative with PS MDE that appears to be as efficient as the traditional MDE sequence.
Cardiac MR (CMR) brings a new level of detail and depth to our diagnosis and management of coronary disease. In particular, it supports management of hypertrophic cardiomyopathy patients and post-operative follow-up in Tetralogy of Fallot cases. With CMR and an advanced 1.5T MR system such as SIGNA™ Explorer, we have higher clinical confidence due to excellent imaging capabilities that assists us in myocardium viability studies as well as diagnosing difficult-to-detect conditions, such as myocarditis and arrhythmogenic right ventricular dysplasia. CMR on the SIGNA™ Explorer adds real value to patient care.


