A
Figure 1.
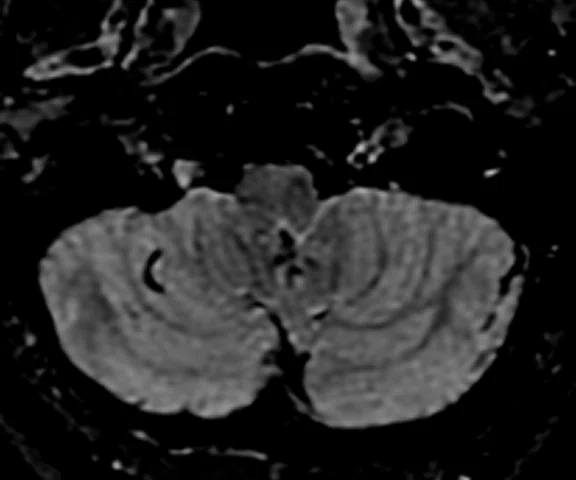
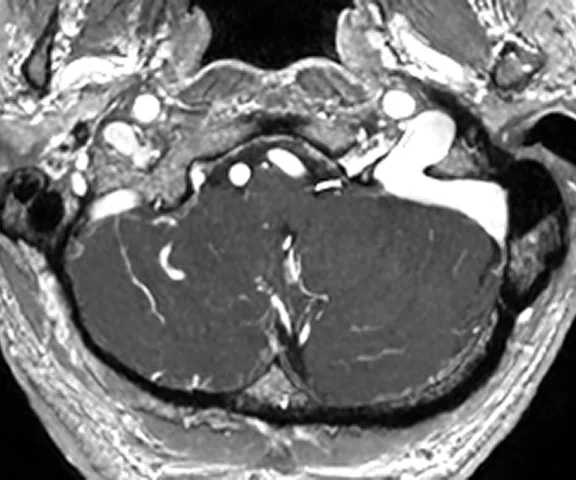
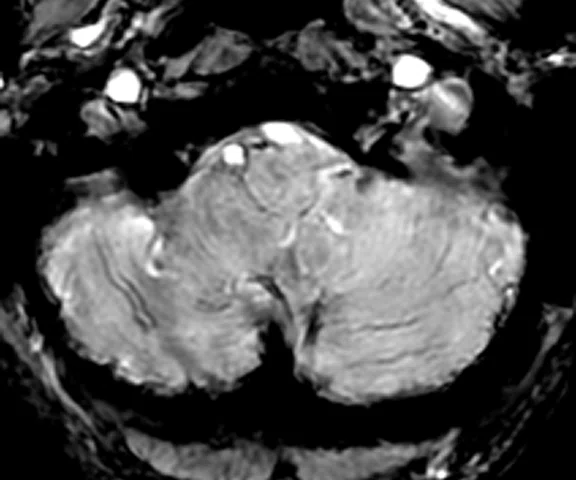
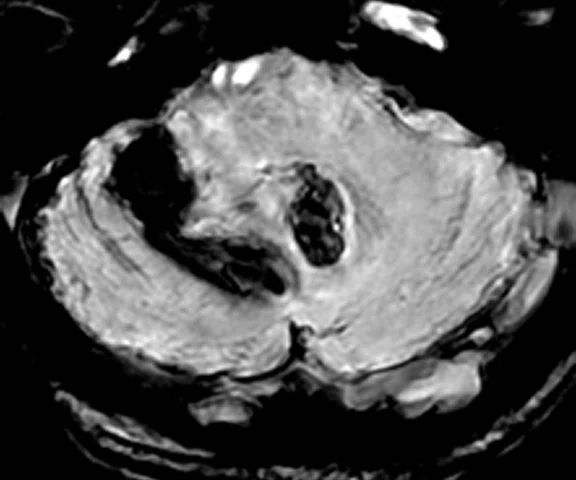
(A) 3D Cube T2 FLAIR FatSat with AIR™ Recon DL 3D, 1 x 1 x 1.2 mm, 3:40 min.; (B) 3D FSPGR, 0.75 x 0.75 x 1 mm, 2:04 min.; (C) 3D SWAN with HyperSense, 0.6 x 0.6 x 2.5 mm, 3:16 min.; (D) TRICKS.
B
Figure 1.
(A) 3D Cube T2 FLAIR FatSat with AIR™ Recon DL 3D, 1 x 1 x 1.2 mm, 3:40 min.; (B) 3D FSPGR, 0.75 x 0.75 x 1 mm, 2:04 min.; (C) 3D SWAN with HyperSense, 0.6 x 0.6 x 2.5 mm, 3:16 min.; (D) TRICKS.
C
Figure 1.
(A) 3D Cube T2 FLAIR FatSat with AIR™ Recon DL 3D, 1 x 1 x 1.2 mm, 3:40 min.; (B) 3D FSPGR, 0.75 x 0.75 x 1 mm, 2:04 min.; (C) 3D SWAN with HyperSense, 0.6 x 0.6 x 2.5 mm, 3:16 min.; (D) TRICKS.
D
Figure 1.
(A) 3D Cube T2 FLAIR FatSat with AIR™ Recon DL 3D, 1 x 1 x 1.2 mm, 3:40 min.; (B) 3D FSPGR, 0.75 x 0.75 x 1 mm, 2:04 min.; (C) 3D SWAN with HyperSense, 0.6 x 0.6 x 2.5 mm, 3:16 min.; (D) TRICKS.
A
Figure 3.
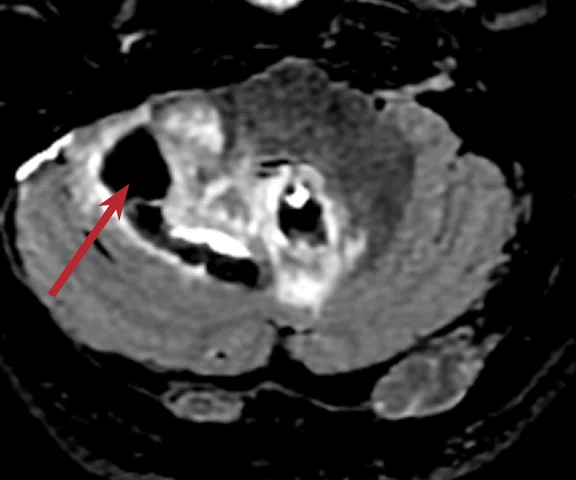
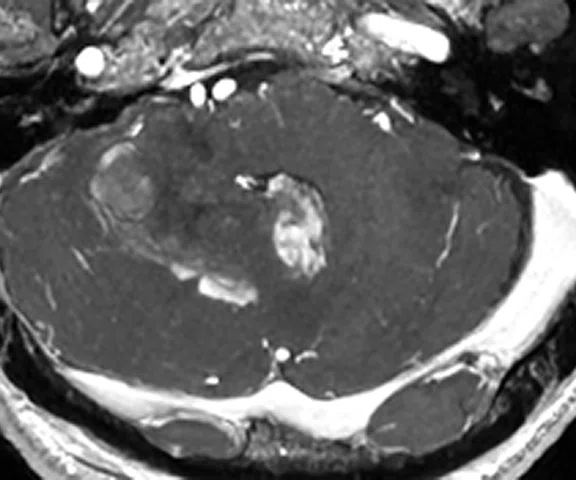
(A) 3D Cube T2 FLAIR FatSat, 1 x 1 x 1.2 mm, 3:40 min. depicting the hematoma (arrow); (B) 3D SWAN with HyperSense, 0.6 x 0.6 x 2.5 mm3, 3:16 min.; (C) 3D T1 FSPGR, 0.75 x 0.75 x 1 mm, 2:04 min.; (D, E) 3D ASL PLD 2525 ms plus labeling duration of (D) 1800 ms and (E) 2500 ms.
B
Figure 3.
(A) 3D Cube T2 FLAIR FatSat, 1 x 1 x 1.2 mm, 3:40 min. depicting the hematoma (arrow); (B) 3D SWAN with HyperSense, 0.6 x 0.6 x 2.5 mm3, 3:16 min.; (C) 3D T1 FSPGR, 0.75 x 0.75 x 1 mm, 2:04 min.; (D, E) 3D ASL PLD 2525 ms plus labeling duration of (D) 1800 ms and (E) 2500 ms.
C
Figure 3.
(A) 3D Cube T2 FLAIR FatSat, 1 x 1 x 1.2 mm, 3:40 min. depicting the hematoma (arrow); (B) 3D SWAN with HyperSense, 0.6 x 0.6 x 2.5 mm3, 3:16 min.; (C) 3D T1 FSPGR, 0.75 x 0.75 x 1 mm, 2:04 min.; (D, E) 3D ASL PLD 2525 ms plus labeling duration of (D) 1800 ms and (E) 2500 ms.
D
Figure 3.
(A) 3D Cube T2 FLAIR FatSat, 1 x 1 x 1.2 mm, 3:40 min. depicting the hematoma (arrow); (B) 3D SWAN with HyperSense, 0.6 x 0.6 x 2.5 mm3, 3:16 min.; (C) 3D T1 FSPGR, 0.75 x 0.75 x 1 mm, 2:04 min.; (D, E) 3D ASL PLD 2525 ms plus labeling duration of (D) 1800 ms and (E) 2500 ms.
E
Figure 3.
(A) 3D Cube T2 FLAIR FatSat, 1 x 1 x 1.2 mm, 3:40 min. depicting the hematoma (arrow); (B) 3D SWAN with HyperSense, 0.6 x 0.6 x 2.5 mm3, 3:16 min.; (C) 3D T1 FSPGR, 0.75 x 0.75 x 1 mm, 2:04 min.; (D, E) 3D ASL PLD 2525 ms plus labeling duration of (D) 1800 ms and (E) 2500 ms.
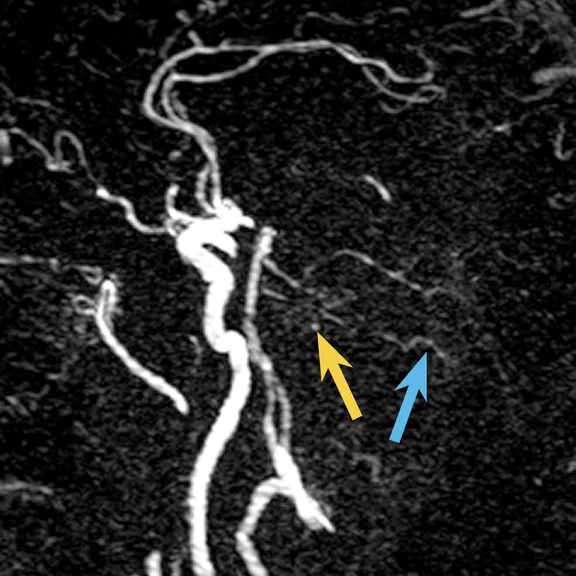
A
Figure 5.
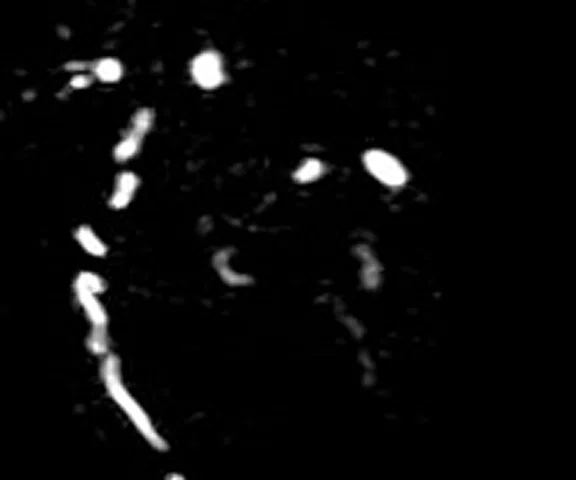
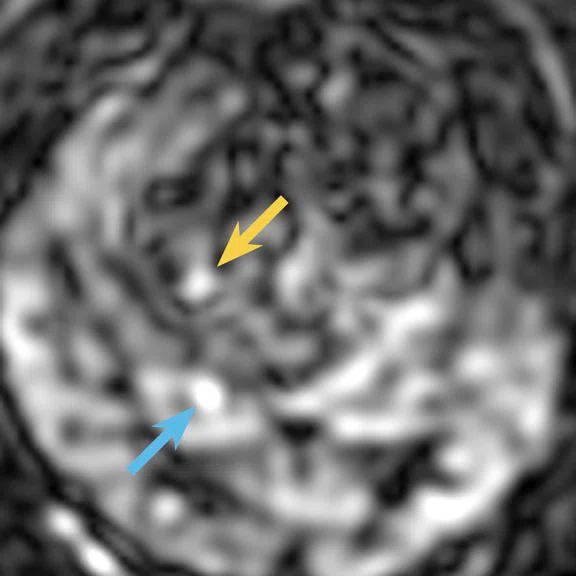
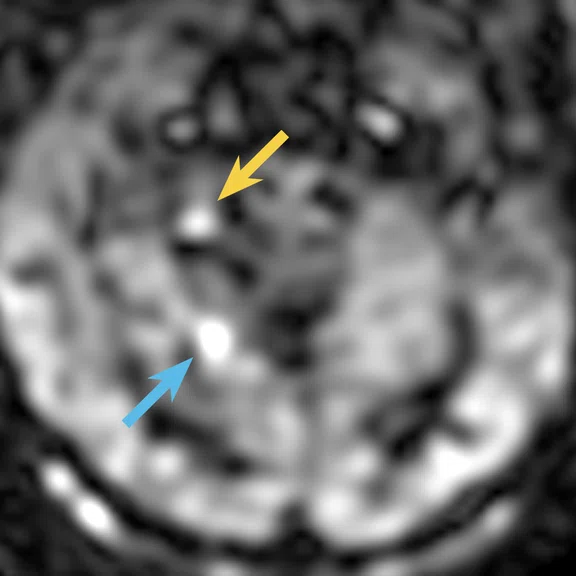
(A) TRICKS and (B, C) 3D ASL with post labeling delay of 2525 ms and labeling duration of (B) 1800 ms and (C) 2500 ms, depicting the aneurysm (yellow arrows) and abnormal venous flow (blue arrows).
B
Figure 5.
(A) TRICKS and (B, C) 3D ASL with post labeling delay of 2525 ms and labeling duration of (B) 1800 ms and (C) 2500 ms, depicting the aneurysm (yellow arrows) and abnormal venous flow (blue arrows).
C
Figure 5.
(A) TRICKS and (B, C) 3D ASL with post labeling delay of 2525 ms and labeling duration of (B) 1800 ms and (C) 2500 ms, depicting the aneurysm (yellow arrows) and abnormal venous flow (blue arrows).
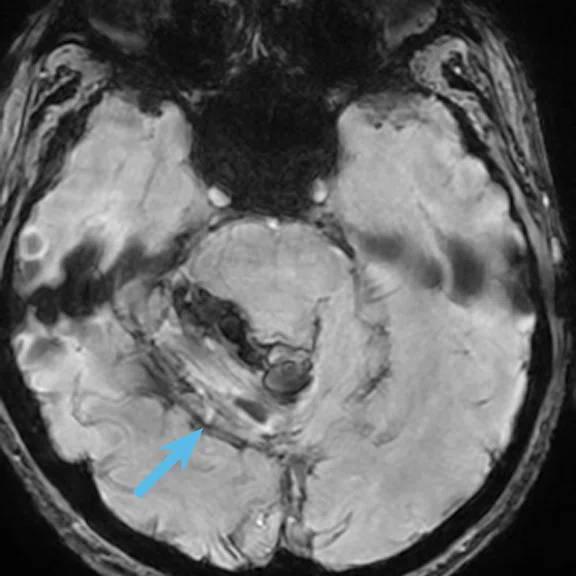
A
Figure 4.
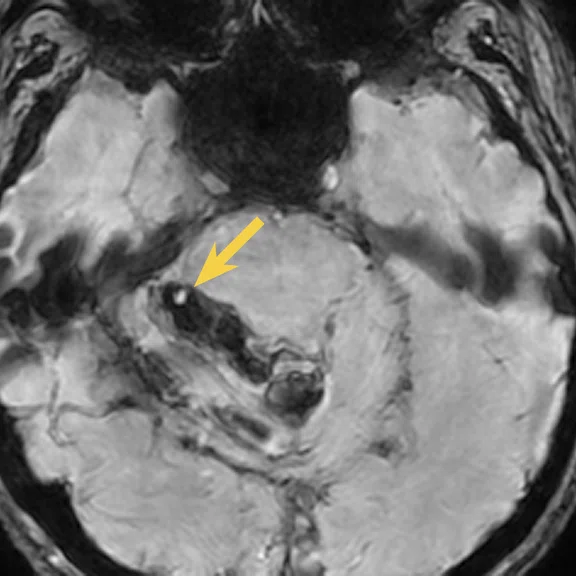
(A, B) 3D SWAN with HyperSense, 0.6 x 0.6 x 2.5 mm, 3:16 min., and (C, D) 3D T1 FSPGR, depicting the aneurysm (yellow arrows) and abnormal venous flow (blue arrows).
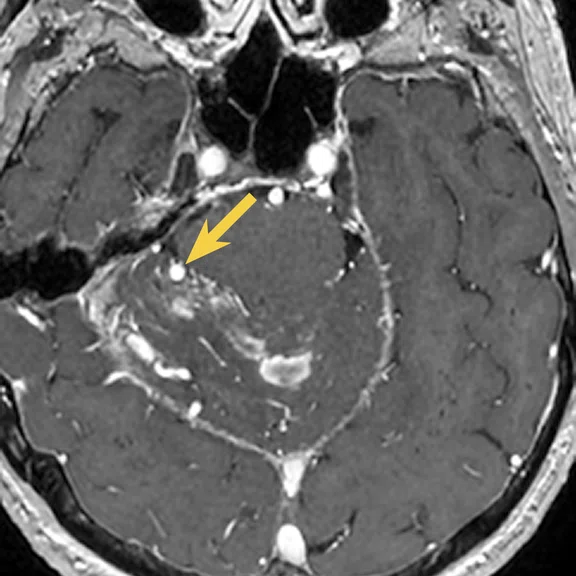
B
Figure 4.
(A, B) 3D SWAN with HyperSense, 0.6 x 0.6 x 2.5 mm, 3:16 min., and (C, D) 3D T1 FSPGR, depicting the aneurysm (yellow arrows) and abnormal venous flow (blue arrows).
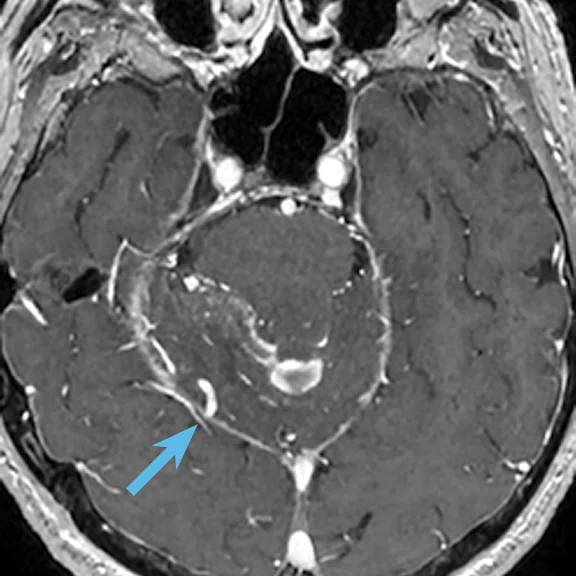
C
Figure 4.
(A, B) 3D SWAN with HyperSense, 0.6 x 0.6 x 2.5 mm, 3:16 min., and (C, D) 3D T1 FSPGR, depicting the aneurysm (yellow arrows) and abnormal venous flow (blue arrows).
D
Figure 4.
(A, B) 3D SWAN with HyperSense, 0.6 x 0.6 x 2.5 mm, 3:16 min., and (C, D) 3D T1 FSPGR, depicting the aneurysm (yellow arrows) and abnormal venous flow (blue arrows).
A
Figure 2.
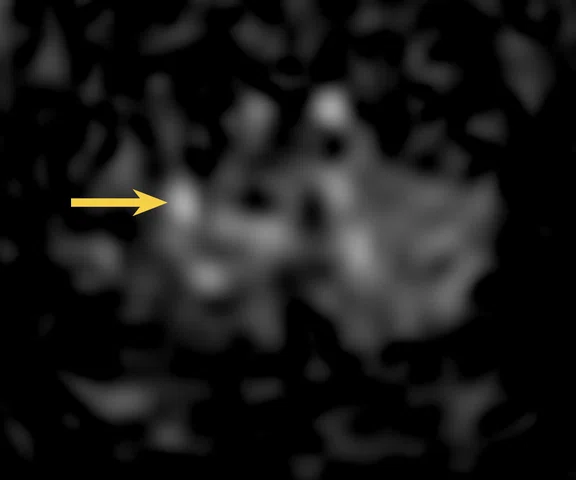
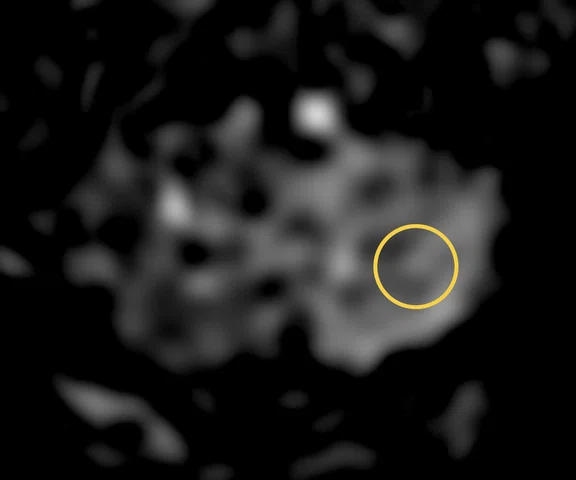
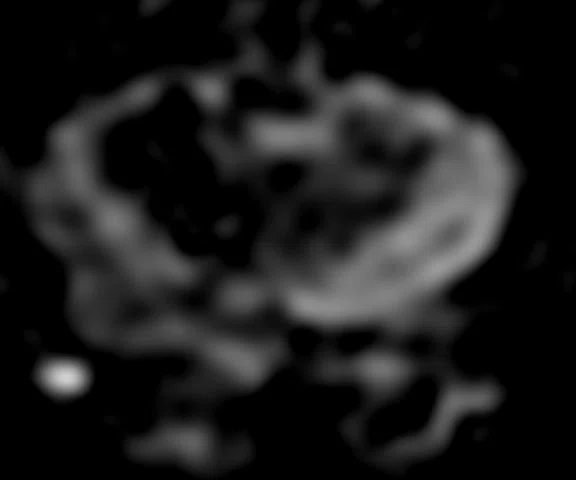
3D ASL PLD 2525 ms with labeling duration of (A, C) 1800 ms versus (B, D) 2500 ms. In (B), note the bright spot detection (arrow) and (D) SNR improvement (circle).
B
Figure 2.
3D ASL PLD 2525 ms with labeling duration of (A, C) 1800 ms versus (B, D) 2500 ms. In (B), note the bright spot detection (arrow) and (D) SNR improvement (circle).
C
Figure 2.
3D ASL PLD 2525 ms with labeling duration of (A, C) 1800 ms versus (B, D) 2500 ms. In (B), note the bright spot detection (arrow) and (D) SNR improvement (circle).
D
Figure 2.
3D ASL PLD 2525 ms with labeling duration of (A, C) 1800 ms versus (B, D) 2500 ms. In (B), note the bright spot detection (arrow) and (D) SNR improvement (circle).
result


PREVIOUS
${prev-page}
NEXT
${next-page}
Subscribe Now
Manage Subscription
FOLLOW US
Contact Us • Cookie Preferences • Privacy Policy • California Privacy PolicyDo Not Sell or Share My Personal Information • Terms & Conditions • Security
© 2024 GE HealthCare. GE is a trademark of General Electric Company. Used under trademark license.
CASE STUDIES
Leveraging flexible label duration to improve ASL SNR performance for brain posterior fossa imaging
Leveraging flexible label duration to improve ASL SNR performance for brain posterior fossa imaging
By Mathieu Rodallec, MD, radiologist, Saint-Joseph Hospital, Paris, France
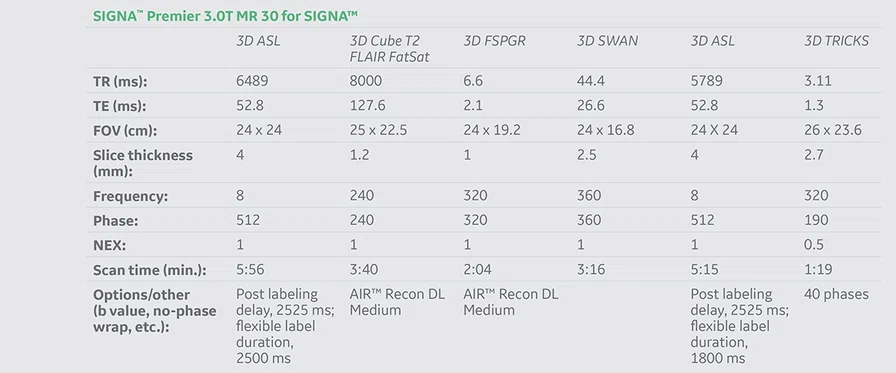
Posterior fossa arteriovenous malformation complicated with cerebellar hematoma is rare in elderly patients. Presented is an interesting case of spontaneous cerebellar hematoma in a 82-year-old male with positive findings using 3D arterial spin labeling (ASL).
3D ASL is a non-contrast, whole brain, quantitative perfusion assessment that is ideal for assessing stroke, transient ischemic attacks (TIAs), stenoses, and cerebrovascular and neurodegenerative diseases. However, ASL imaging of the posterior fossa is often challenging due to low signal and, therefore, does not often change the pathway in terms of the patient’s clinical management. With MR 30 for SIGNA™, a new option called Flexible Label Duration allows the ASL labeling pulse duration to go beyond the value of 1800 ms (the standard on previous software releases), up to 4000 ms. This capability helps improve perfusion signal-to-noise ratio (SNR) in ASL imaging, especially in the geriatric population who typically have a slower blood flow. Also, AIR™ Recon DL is now compatible with 3D sequences, providing an additional increase in SNR and image sharpness.
In this clinical case, the technologist acquired two different labeling durations of 1800 ms (default) and 2500 ms. With the 2500 ms acquisition, the amount of magnetized vascular protons increases in the imaging volume, which is converted into improved SNR and better visualization of the perfusion of the brain parenchyma, especially in the cerebellum area.
Patient history
An 82-year-old male was referred to MR after diagnosis of a right cerebellum hemorrhagic stroke. The patient had no obvious underlying cause of the stroke (no history of aneurysm or vascular disease).
Acquisition
The acquisition consisted of:
- 3D Cube FLAIR + 3D T1 FSPGR pre- and post-contrast with
- AIR™ Recon DL
- 3D SWAN & 3D TOF with HyperSense
- 3D ASL with Flexible Label Duration
Results
The ASL with labeling duration set at 2500 ms was positive and showed some bright spots that led us to suspect a brain arteriovenous malformation underlying the hematoma in the non-contrast sequence. This suspicion was confirmed with the contrast-enhanced T1 sequence. These sequences show an intracranial venous aneurysm (Figures 2B and 5C, yellow arrow) associated with brain arteriovenous malformation (Figures 2B and 5C, blue arrow) showing abnormal venous blood flow.
Discussion
The new flexible labeling duration of 3D ASL and ability to attain 2500 ms improved the image quality of the fossa posterior and helped us visualize bright spots that were missed on the ASL with 1800 ms labeling duration (default value). The excellent correlation between ASL with increased labeling duration and the 3D T1 post-contrast provided the information needed to change patient management strategy. The patient was sent to the angiography room for embolization of the arteriovenous malformation.


