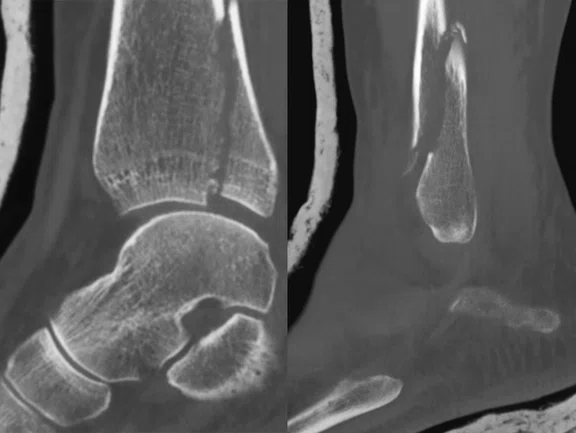
Figure 2.
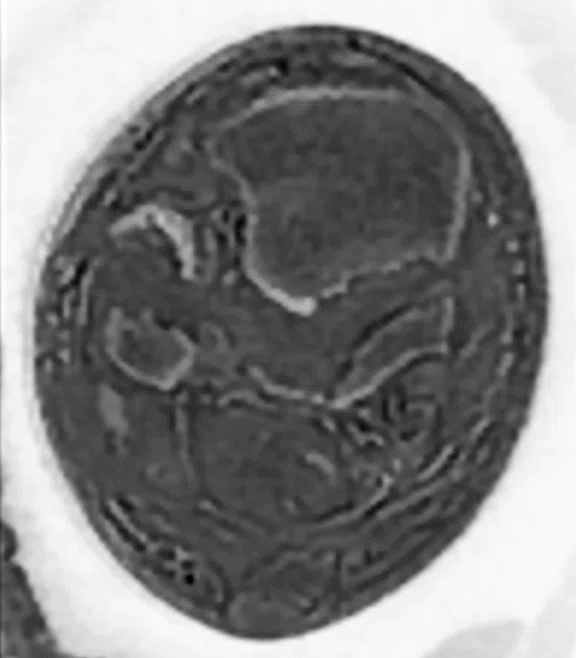
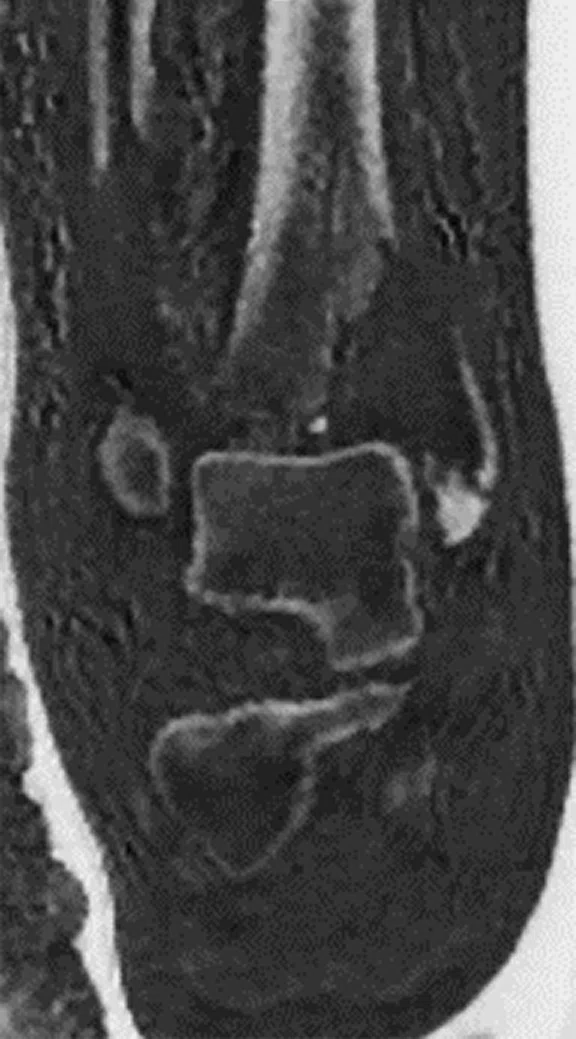
Reformatted sagittal CT with 1.5 mm slice thickness.
A
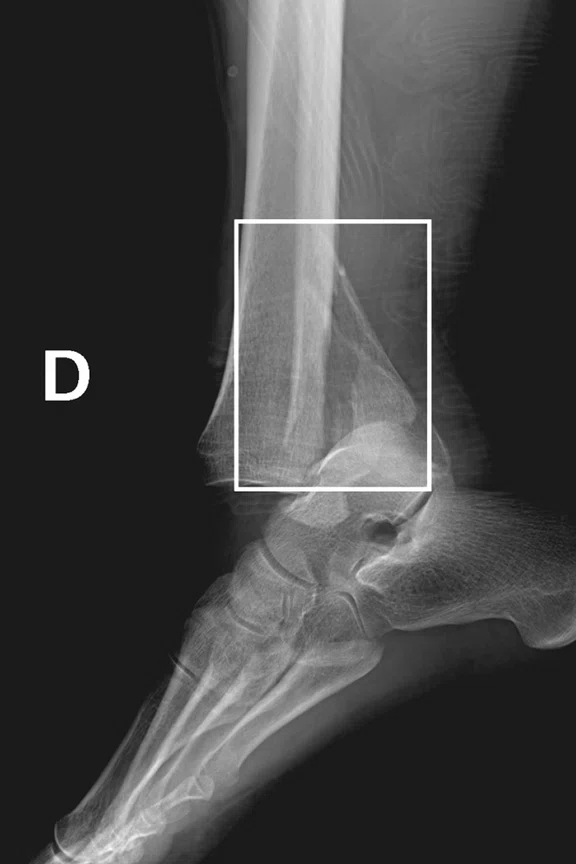
Figure 1.
(A) X-ray in emergency room and (B) after closed reduction.
B
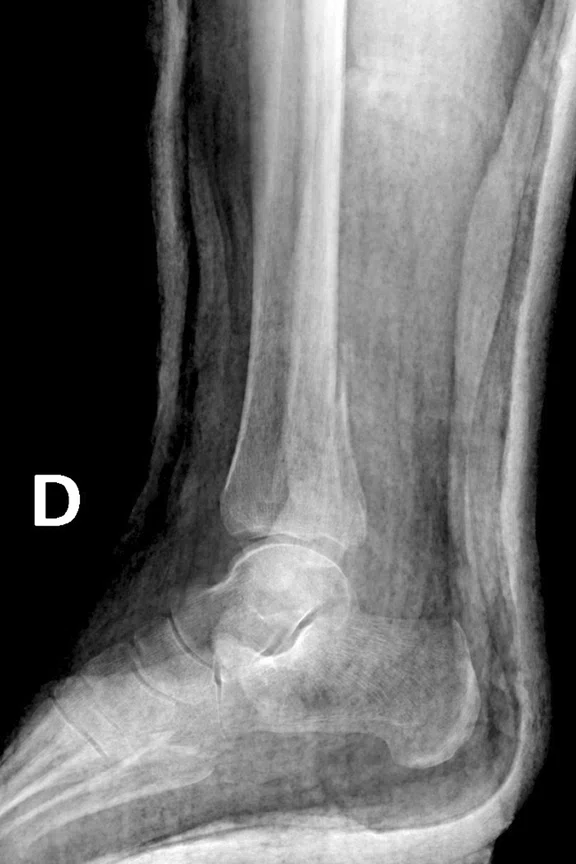
Figure 1.
(A) X-ray in emergency room and (B) after closed reduction.


result
A
Figure 3.
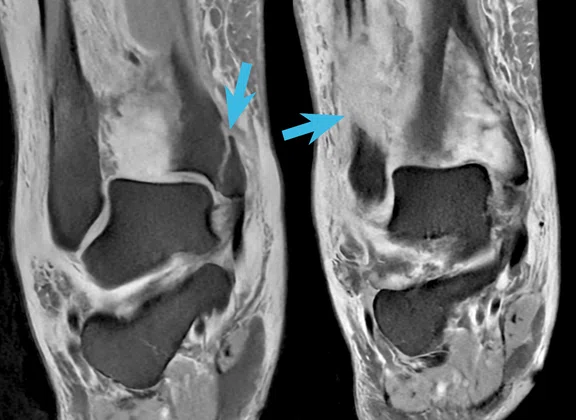
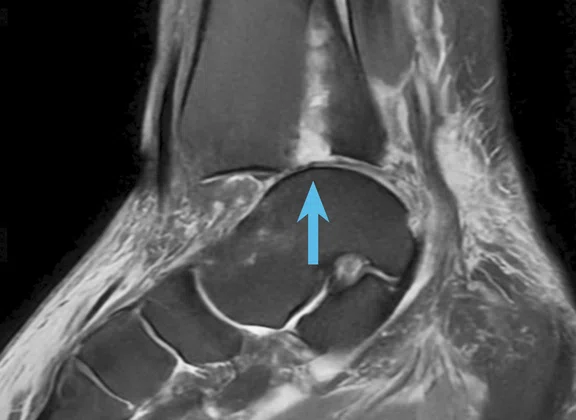
All images acquired with AIR™ Recon DL High. (A) coronal PD FSE FatSat, 0.4 x 0.5 x 3 mm, 1:10 min. and (B) sagittal PD FSE FatSat, 0.5 x 0.6 x 3 mm, 1:35 min. demonstrating fractures (blue arrows) (C) axial PD FSE FatSat, 0.5 x 0.5 x 3 mm, 1:34 min. depicting ligament tear (yellow arrow); and (D) axial PD FSE, 0.45 x 0.45 x 3 mm, 1:31 min. showing separation and fluid in the interosseous membrane (red arrow).
B
Figure 3.
All images acquired with AIR™ Recon DL High. (A) coronal PD FSE FatSat, 0.4 x 0.5 x 3 mm, 1:10 min. and (B) sagittal PD FSE FatSat, 0.5 x 0.6 x 3 mm, 1:35 min. demonstrating fractures (blue arrows) (C) axial PD FSE FatSat, 0.5 x 0.5 x 3 mm, 1:34 min. depicting ligament tear (yellow arrow); and (D) axial PD FSE, 0.45 x 0.45 x 3 mm, 1:31 min. showing separation and fluid in the interosseous membrane (red arrow).
C
Figure 3.
All images acquired with AIR™ Recon DL High. (A) coronal PD FSE FatSat, 0.4 x 0.5 x 3 mm, 1:10 min. and (B) sagittal PD FSE FatSat, 0.5 x 0.6 x 3 mm, 1:35 min. demonstrating fractures (blue arrows) (C) axial PD FSE FatSat, 0.5 x 0.5 x 3 mm, 1:34 min. depicting ligament tear (yellow arrow); and (D) axial PD FSE, 0.45 x 0.45 x 3 mm, 1:31 min. showing separation and fluid in the interosseous membrane (red arrow).
D
Figure 3.
All images acquired with AIR™ Recon DL High. (A) coronal PD FSE FatSat, 0.4 x 0.5 x 3 mm, 1:10 min. and (B) sagittal PD FSE FatSat, 0.5 x 0.6 x 3 mm, 1:35 min. demonstrating fractures (blue arrows) (C) axial PD FSE FatSat, 0.5 x 0.5 x 3 mm, 1:34 min. depicting ligament tear (yellow arrow); and (D) axial PD FSE, 0.45 x 0.45 x 3 mm, 1:31 min. showing separation and fluid in the interosseous membrane (red arrow).
A
Figure 4.
(A-C) Isotropic oZTEo acquisition, 0.8 mm, 3:59 min. and (D) reformatted sagittal CT, 1.5 mm. Note the joint instability is more evident with oZTEo, showing the anterior redislocation of the tibiotalar joint (blue square) compared to CT.
B
Figure 4.
(A-C) Isotropic oZTEo acquisition, 0.8 mm, 3:59 min. and (D) reformatted sagittal CT, 1.5 mm. Note the joint instability is more evident with oZTEo, showing the anterior redislocation of the tibiotalar joint (blue square) compared to CT.
C
Figure 4.
(A-C) Isotropic oZTEo acquisition, 0.8 mm, 3:59 min. and (D) reformatted sagittal CT, 1.5 mm. Note the joint instability is more evident with oZTEo, showing the anterior redislocation of the tibiotalar joint (blue square) compared to CT.
D
Figure 4.
(A-C) Isotropic oZTEo acquisition, 0.8 mm, 3:59 min. and (D) reformatted sagittal CT, 1.5 mm. Note the joint instability is more evident with oZTEo, showing the anterior redislocation of the tibiotalar joint (blue square) compared to CT.
PREVIOUS
${prev-page}
NEXT
${next-page}
Subscribe Now
Manage Subscription
FOLLOW US
Contact Us • Cookie Preferences • Privacy Policy • California Privacy PolicyDo Not Sell or Share My Personal Information • Terms & Conditions • Security
© 2024 GE HealthCare. GE is a trademark of General Electric Company. Used under trademark license.
CASE STUDIES
#oZTEoMRboneimaging: oZTEo case competition
#oZTEoMRboneimaging: oZTEo case competition
In Spring 2022, GE Healthcare launched a customer case study competition for oZTEo, an MR application for imaging bone. Based on the radial ZTE application, oZTEo is inherently motion-insensitive and complements a conventional MR soft-tissue exam to deliver 3D isotropic imaging with familiar bright bone contrast.
More than a dozen clinical cases were posted on social media with the hashtag #oZTEoMRboneimaging. At the close of the competition on August 31, 2022, GE clinical marketing and development leaders selected the top five cases based on image quality, clinical history, novelty of use and whether oZTEo provided additional diagnostic information of the bone anatomy compared to other MR imaging techniques.
First place
Submitted by Mario Padrón, MD,
Head of Radiology Department, Clínica CEMTRO,
Madrid, Spain
See original post
Patient history
A 58-year-old female with acute indirect trauma to the right ankle. Severe pain, inflammation and joint instability at physical examination.
Results
X-ray demonstrated distal tibia fracture, including medial malleolus and fibular metaphyseal displaced fracture with tibiotalar dislocation (Figure 1). CT depicted distal fibular and tibial fractures including medial malleolus; however, no tibiotalar dislocation was noted (Figure 2).
All MR images were acquired on SIGNA™ Architect 3.0T running SIGNA™Works AIR™ IQ Edition software with the AIR™ Coil MP Large.
This examination was a routine ankle MR with AIR™ Recon DL (<10 min) and the oZTEo sequence to evaluate cortical bone structure.
- Sagittal and coronal proton density (PD) FatSat (Figure 3): Fracture line in distal tibia, displaced and anterior dislocation of the tibiotalar joint due to joint instability. Fibular metaphysis and medial malleolus fractures (blue arrows at fracture lines).
- Axial PD with and without FatSat (Figure 3): Complete tear of the anterior talofibular ligament with discontinuity of the ligament (yellow arrow), and the anterior syndesmosis with mild tibiofibular separation and fluid in the interosseous membrane (red arrow).
C
D
Figure 3.
All images acquired with AIR™ Recon DL High. (A) coronal PD FSE FatSat, 0.4 x 0.5 x 3 mm, 1:10 min. and (B) sagittal PD FSE FatSat, 0.5 x 0.6 x 3 mm, 1:35 min. demonstrating fractures (blue arrows) (C) axial PD FSE FatSat, 0.5 x 0.5 x 3 mm, 1:34 min. depicting ligament tear (yellow arrow); and (D) axial PD FSE, 0.45 x 0.45 x 3 mm, 1:31 min. showing separation and fluid in the interosseous membrane (red arrow).
- oZTEo (Figure 4): Compared to CT, there are no differences in the fracture morphology end extension; however, the joint instability is more evident, showing the anterior redislocation of the tibiotalar joint (blue square).
The oZTEo sequence provided great added value for surgical planning in this type of unstable fracture of the ankle joint. Open surgery with a posterior approach was performed with a satisfactory outcome and follow-up. Dr. Padrón confirmed that an X-ray or CT might not have been obtained if the MR had been done first.
Honorable mention
Submitted by Antony Cormont,
Imaging Center du Nord,
St. Denis, France
See original post
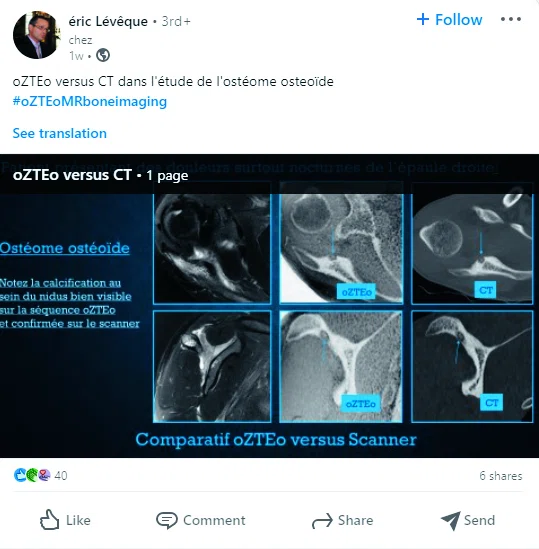
Honorable mention
Submitted by Éric Lévêque,
Ramsay Santé Group, Sports Clinic,
Paris, France
See original post
Honorable mention
Submitted by Cyril Pellen,
Selas Diamorphos, Brest,
Bretagne, France
See original post
Honorable mention
Submitted by Michael Lustig, PhD,
University of California, Berkeley
Berkeley, CA
See original post


