1. Kuhl CK, Schild HH, Morakkabati N. Dynamic bilateral contrast enhanced MR imaging of the breast: trade-off between spatial and temporal resolution. Radiology 2005; 236:789–800.
1. Kuhl CK, Schild HH, Morakkabati N. Dynamic bilateral contrast enhanced MR imaging of the breast: trade-off between spatial and temporal resolution. Radiology 2005; 236:789–800.
2. Saranathan M, Rettmann DW, Hargreaves BA, Clarke SE, Vasanawala SS. DIfferential subsampling with cartesian ordering (DISCO): a high spatio-temporal resolution Dixon imaging sequence for multiphasic contrast enhanced abdominal imaging. J Magn Reson Imaging 2012; 35:1484–1492.
3. Abe H, Mori N, Tsuchiya K, et al. Kinetic analysis of benign and malignant breast lesions with ultrafast dynamic contrast enhanced MRI: comparison with standard kinetic assessment. AJR Am J Roentgenol 2016; 207:1159–66.
4. Lebel, R.M. Performance characterization of a novel deep learning-based MR image reconstruction pipeline. August 2020. http://arxiv.org/abs/2008.06559.
5. Berg WA, Blume JD, Cormack JB, et al. Combined screening with ultrasound and mammography vs mammography alone in women at elevated risk of breast cancer. JAMA 2008;299:2151-2163.
6. Schünemann HJ, Lerda D, Quinn C, et al. European Commission Initiative on Breast Cancer (ECIBC) Contributor Group. Breast Cancer Screening and Diagnosis: A Synopsis of the European Breast Guidelines. Ann Intern Med. 2020 Jan 7;172(1):46-56. doi: 10.7326/M19-2125. Epub 2019 Nov 26. PMID: 31766052.
A
Figure 1.
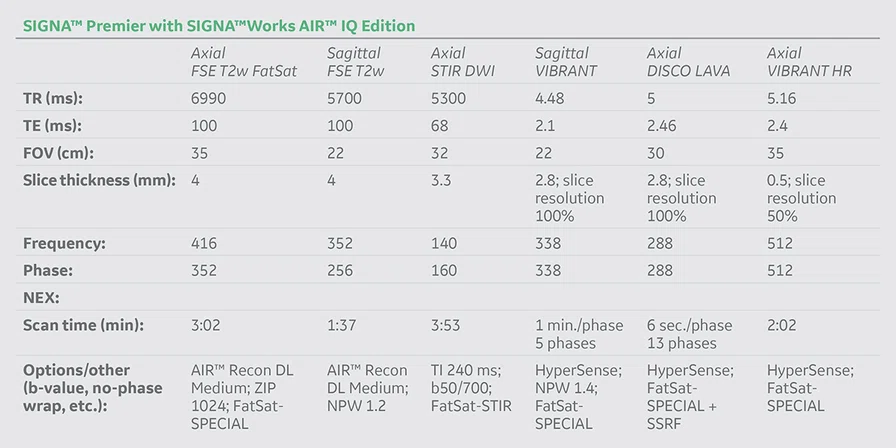
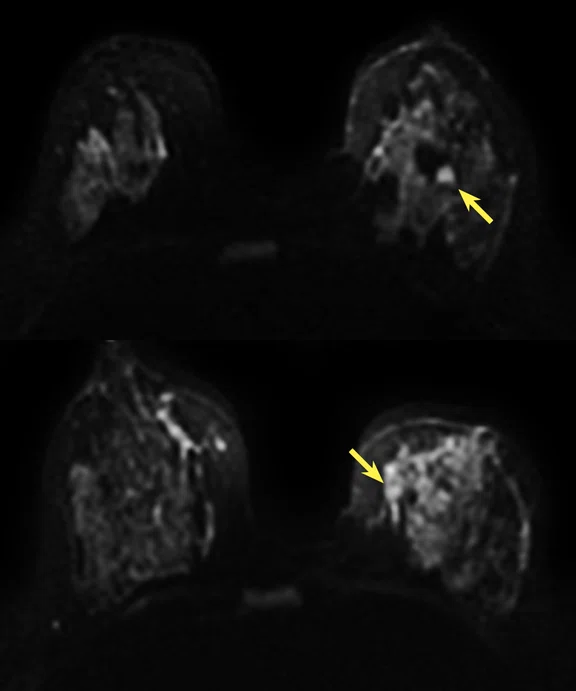
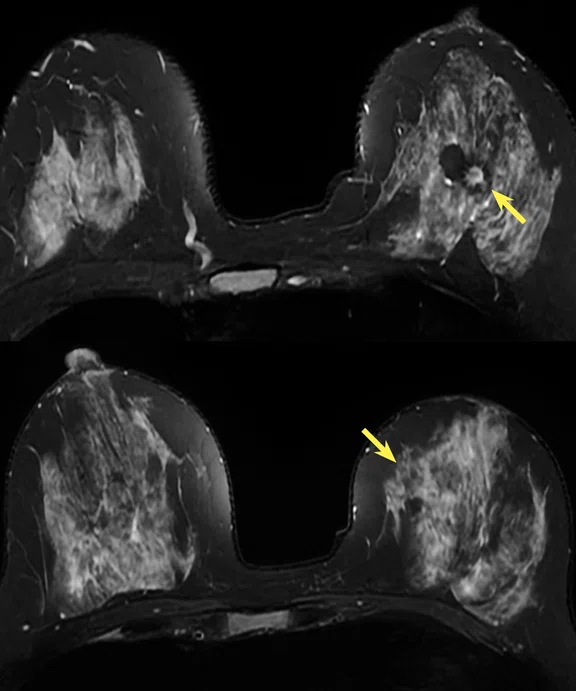
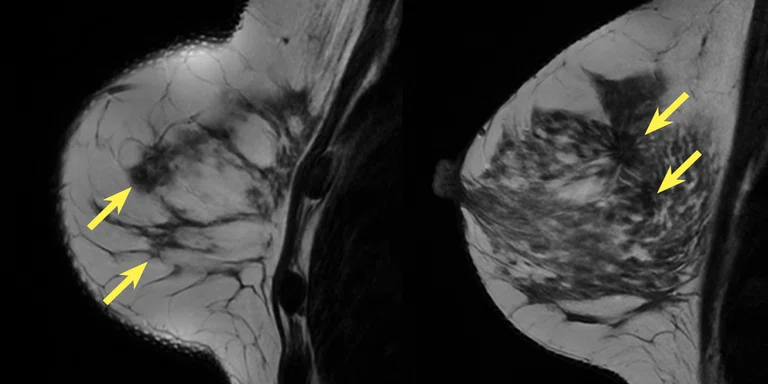
MR morphological and parametric sequences including AIR™ Recon DL images. (A) Axial STIR DWI, 2.28 x 2 x 3.3 mm, 3:53 min.; (B) axial FSE T2 FatSat with AIR™ Recon DL, 1.05 x 1.25 x 3 mm, min.; (C) sagittal FSE T2w with AIR™ Recon DL, 0.62 x 1.25 x 4 mm, 1:37 min.
B
Figure 1.
MR morphological and parametric sequences including AIR™ Recon DL images. (A) Axial STIR DWI, 2.28 x 2 x 3.3 mm, 3:53 min.; (B) axial FSE T2 FatSat with AIR™ Recon DL, 1.05 x 1.25 x 3 mm, min.; (C) sagittal FSE T2w with AIR™ Recon DL, 0.62 x 1.25 x 4 mm, 1:37 min.
C
Figure 1.
MR morphological and parametric sequences including AIR™ Recon DL images. (A) Axial STIR DWI, 2.28 x 2 x 3.3 mm, 3:53 min.; (B) axial FSE T2 FatSat with AIR™ Recon DL, 1.05 x 1.25 x 3 mm, min.; (C) sagittal FSE T2w with AIR™ Recon DL, 0.62 x 1.25 x 4 mm, 1:37 min.
A
Figure 2.
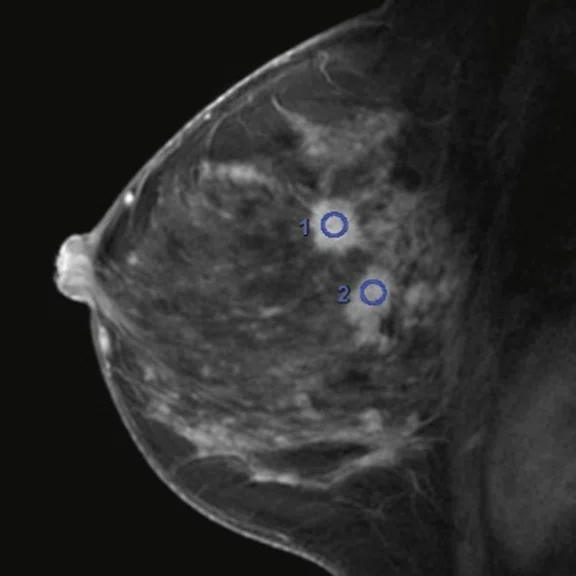
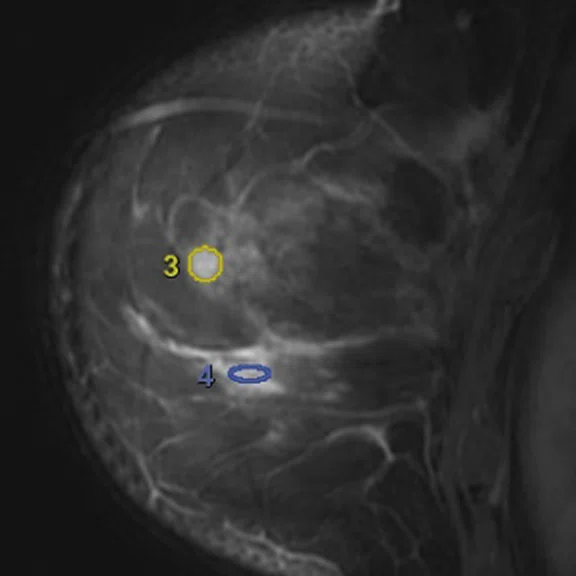
Post-contrast images from DCE sequences (DISCO with HyperSense and VIBRANT). The use of HyperSense allows a gain in both spatial and temporal resolution. Central lesions 1 and 2 and inner quadrant lesions 3 and 4 are depicted in 2B. (A) Axial DISCO LAVA ASPIR HyperSense DCE, 1 x 1 x 2.8 mm, 6 sec./phase, 13 phases; (B) sagittal VIBRANT ASPIR HS DCE, 0.65 x 0.65 x 2.8 mm, 1 min./phase, 5 phases; (C) axial VIBRANT ASPIR HS late enhancement, 0.68 x 0.68 x 1 mm, 2 min.
C
Figure 2.
Post-contrast images from DCE sequences (DISCO with HyperSense and VIBRANT). The use of HyperSense allows a gain in both spatial and temporal resolution. Central lesions 1 and 2 and inner quadrant lesions 3 and 4 are depicted in 2B. (A) Axial DISCO LAVA ASPIR HyperSense DCE, 1 x 1 x 2.8 mm, 6 sec./phase, 13 phases; (B) sagittal VIBRANT ASPIR HS DCE, 0.65 x 0.65 x 2.8 mm, 1 min./phase, 5 phases; (C) axial VIBRANT ASPIR HS late enhancement, 0.68 x 0.68 x 1 mm, 2 min.
B
Figure 2.
Post-contrast images from DCE sequences (DISCO with HyperSense and VIBRANT). The use of HyperSense allows a gain in both spatial and temporal resolution. Central lesions 1 and 2 and inner quadrant lesions 3 and 4 are depicted in 2B. (A) Axial DISCO LAVA ASPIR HyperSense DCE, 1 x 1 x 2.8 mm, 6 sec./phase, 13 phases; (B) sagittal VIBRANT ASPIR HS DCE, 0.65 x 0.65 x 2.8 mm, 1 min./phase, 5 phases; (C) axial VIBRANT ASPIR HS late enhancement, 0.68 x 0.68 x 1 mm, 2 min.
7. Shin, SU, Cho N, Kim SY, et al. Time-to-enhancement at ultrafast breast DCE-MRI: potential imaging biomarker of tumour aggressiveness. European Radiology (2020) 30: 4058–4068.
7. Shin, SU, Cho N, Kim SY, et al. Time-to-enhancement at ultrafast breast DCE-MRI: potential imaging biomarker of tumour aggressiveness. European Radiology (2020) 30: 4058–4068.
A
Figure 3.
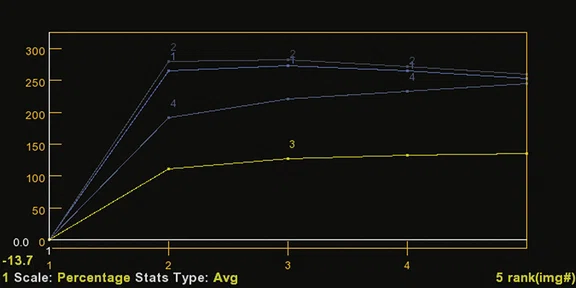
Time-related graphs of intensity time related curves of the DCE sequences (DISCO with HyperSense and VIBRANT as shown in Figure 2). The TTE relative to the aorta showed very fast enhancement of the two central lesions with a wash-out type III curve, while the two inner quadrant lesions showed slower enhancement and a continuous enhancement type I curve. (A) Graph from the ultra-fast protocol, 6 sec./phase, and (B) graph from standard DCE protocol, 1 min./phase.
B
Figure 3.
Time-related graphs of intensity time related curves of the DCE sequences (DISCO with HyperSense and VIBRANT as shown in Figure 2). The TTE relative to the aorta showed very fast enhancement of the two central lesions with a wash-out type III curve, while the two inner quadrant lesions showed slower enhancement and a continuous enhancement type I curve. (A) Graph from the ultra-fast protocol, 6 sec./phase, and (B) graph from standard DCE protocol, 1 min./phase.
A
Figure 4.
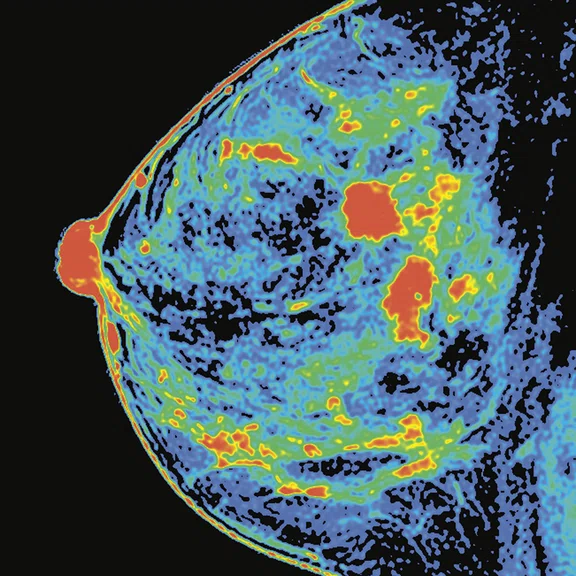
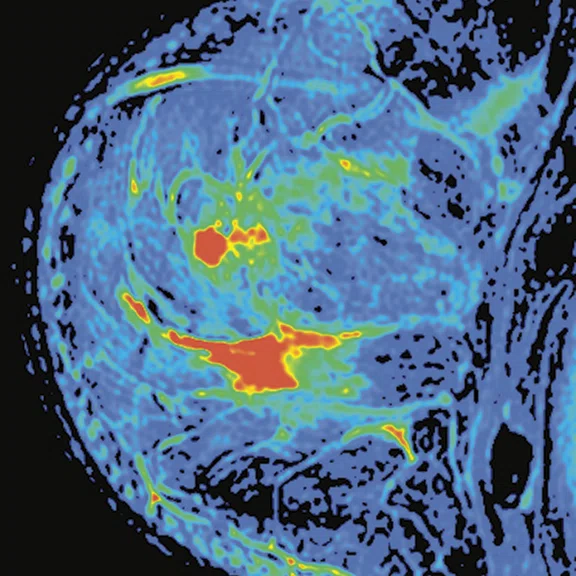
(A, B) Positive enhancement integral color maps of the four lesions, (C) ROI positions of the central lesions (1 and 2) and (D) inner quadrant lesions (3 and 4) of the intensity time related curves shown in Figure 3.
B
Figure 4.
(A, B) Positive enhancement integral color maps of the four lesions, (C) ROI positions of the central lesions (1 and 2) and (D) inner quadrant lesions (3 and 4) of the intensity time related curves shown in Figure 3.
C
Figure 4.
(A, B) Positive enhancement integral color maps of the four lesions, (C) ROI positions of the central lesions (1 and 2) and (D) inner quadrant lesions (3 and 4) of the intensity time related curves shown in Figure 3.
D
Figure 4.
(A, B) Positive enhancement integral color maps of the four lesions, (C) ROI positions of the central lesions (1 and 2) and (D) inner quadrant lesions (3 and 4) of the intensity time related curves shown in Figure 3.
7. Shin, SU, Cho N, Kim SY, et al. Time-to-enhancement at ultrafast breast DCE-MRI: potential imaging biomarker of tumour aggressiveness. European Radiology (2020) 30: 4058–4068.
5. Berg WA, Blume JD, Cormack JB, et al. Combined screening with ultrasound and mammography vs mammography alone in women at elevated risk of breast cancer. JAMA 2008;299:2151-2163.
result


PREVIOUS
${prev-page}
NEXT
${next-page}


Subscribe Now
Manage Subscription
FOLLOW US
Contact Us • Cookie Preferences • Privacy Policy • California Privacy PolicyDo Not Sell or Share My Personal Information • Terms & Conditions • Security
© 2024 GE HealthCare. GE is a trademark of General Electric Company. Used under trademark license.
CASE STUDIES
The impact of AI on diagnostic confidence in breast MR
The impact of AI on diagnostic confidence in breast MR
by Vicente Martínez de Vega, MD, Quirónsalud Madrid University Hospital, Madrid, Spain
Dynamic contrast-enhanced MR (DCE MR) is commonly used for the detection and characterization of malignancies in the breast1. However, suboptimal compromises often due to motion between phases may be made regarding temporal and spatial resolution in conventional breast DCE MR1. A high spatial resolution is required to characterize lesion morphology, whereas a high temporal resolution is required to accurately characterize contrast uptake both for semi-quantitative and quantitative analysis of contrast enhancement kinetics.
Since 2015, we have used a new variable spatiotemporal resolution DCE MR method, Differential Subsampling with Cartesian Ordering (DISCO), for imaging of breast cancer2. This sequence combines an SPGR sequence with SPECIAL fat saturation, a pseudo random variable density and a k-space segmentation. This sequence provides high spatial resolution combined with high temporal resolution.
Recently, the ability to combine DISCO with a compressed sensing technique, HyperSense, has allowed us to reach a faster temporal resolution to achieve first-pass perfusion.
DISCO with HyperSense is an ultrafast MR sequence that utilizes kinetic information of the very early enhancement phase, within 90 seconds after contrast injection, with an achieved temporal resolution of 6 seconds per phase. A previous study reported that these ultrafast protocols were useful for distinguishing benign from malignant lesions3.
Moreover, artificial intelligence (AI), particularly deep-learning (DL) techniques, have recently been introduced to improve image quality (specifically, SNR and sharpness) as well as enable scan time reductions. This includes the introduction of AIR™ Recon DL, which also removes noise and Gibbs ringing artifacts prior to final image formation4.
AIR™ Recon DL is embedded in the MR image reconstruction pipeline, requiring access to raw data. The neural network employs a cascade of over 100,000 unique pattern recognitions for noise and low resolution to reconstruct only the ideal object image. Users have the freedom to select their own level of SNR improvement through a user interface that provides a low, medium or high setting. The result is an image with higher SNR and spatial resolution.
The combination of both fast and ultrafast DCE techniques drastically improves our clinical diagnostic confidence in our daily practice because in some cases, especially in pre-menopausal women, the fibro glandular tissue enhancement (background parenchymal enhancement) can be very intense even in the first minute. This can make it difficult to differentiate breast cancer from the overall enhancement of adjacent tissue.
Patient history
A 40-year-old woman underwent initial mammographic screening and additional ultrasound as recommended for dense breasts in our institution5,6. The mammography and ultrasound exams showed two adjacent lesions located in the central region of the left breast. Both were considered BI-RADS® 5.
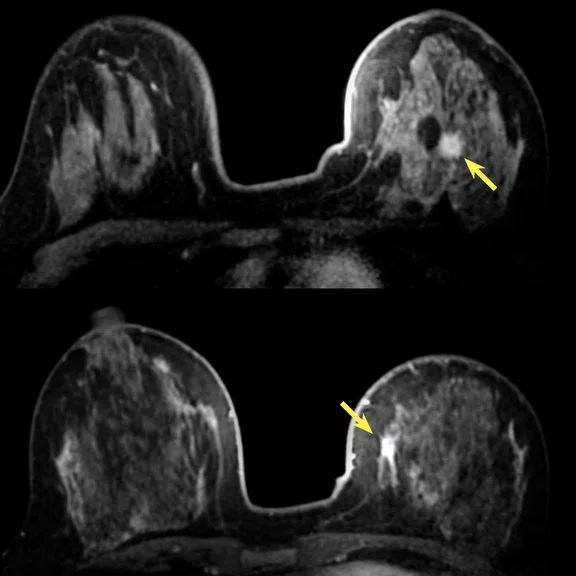
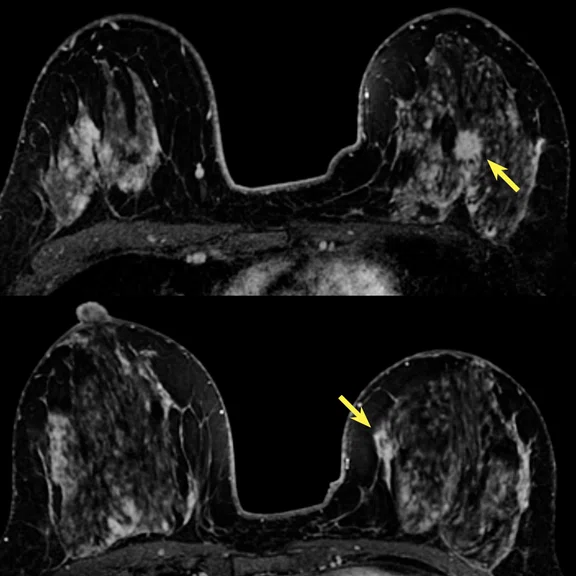
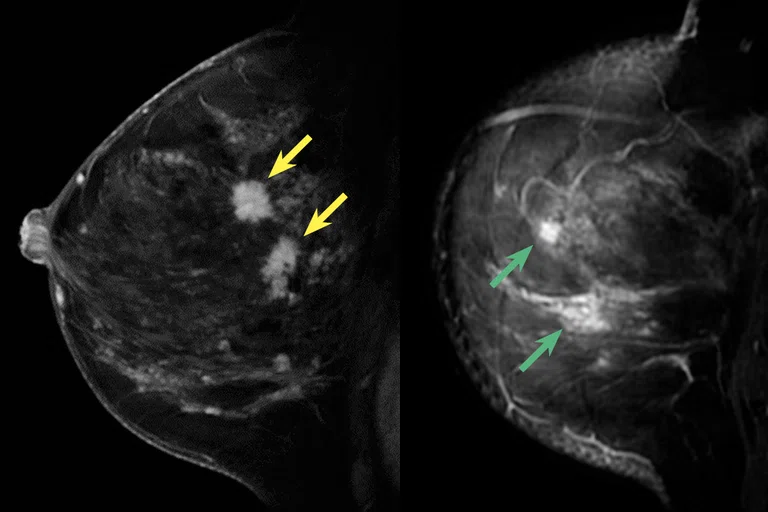
MR was indicated for staging the two suspicious lesions in the central region (16 mm and 15 mm) and two other uptake areas were identified: one in the inner quadrant junction (6 mm nodule with slightly irregular margins) and another in the inferior-internal quadrant (12 mm non-mass uptake) (Figures 1 and 2).
Figure 2.
Post-contrast images from DCE sequences (DISCO with HyperSense and VIBRANT). The use of HyperSense allows a gain in both spatial and temporal resolution. Central lesions 1 and 2 and inner quadrant lesions 3 and 4 are depicted in 2B. (A) Axial DISCO LAVA ASPIR HyperSense DCE, 1 x 1 x 2.8 mm, 6 sec./phase, 13 phases; (B) sagittal VIBRANT ASPIR HS DCE, 0.65 x 0.65 x 2.8 mm, 1 min./phase, 5 phases; (C) axial VIBRANT ASPIR HS late enhancement, 0.68 x 0.68 x 1 mm, 2 min.
Results
A total of four lesions were found with MR.
The combination of standard and ultra-fast DCE sequences allows for the acquisition of multiparametric information of the lesion enhancement pattern. The ultra-fast sequence provides information on early enhancement characteristics, while the standard DCE sequence provides information on the entire perfusion sequence.
The initial enhancement phase was defined as the first appearance of tumor enhancement on the post-contrast images7 and were around 12 seconds for the two central suspicious lesions and more than 25 seconds for the two inner quadrant lesions.
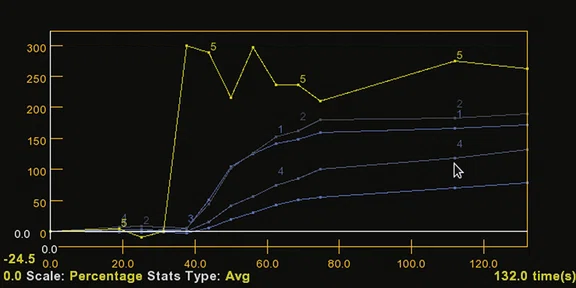
Tumor enhancement was identified when the signal intensity within the region of interest (ROI) in the tumor became more than 1.5 times the average signal intensity of the three unenhanced images within the same ROI7. The two central lesions showed a fast uptake on the DISCO with HyperSense sequence of less than 30 seconds compared to the aorta, while the two inner quadrant lesions were markedly slower at more than 90 seconds (Figure 3).
Figure 3.
Time-related graphs of intensity time related curves of the DCE sequences (DISCO with HyperSense and VIBRANT as shown in Figure 2). The TTE relative to the aorta showed very fast enhancement of the two central lesions with a wash-out type III curve, while the two inner quadrant lesions showed slower enhancement and a continuous enhancement type I curve. (A) Graph from the ultra-fast protocol, 6 sec./phase, and (B) graph from standard DCE protocol, 1 min./phase.
Patient was referred for ultrasoundguided biopsy of the two central region lesions previously visualized in the initial ultrasound screening, and the lesions were classified as infiltrating ductal carcinomas (estrogen and progesterone +, HER2-negative, Ki-67 at 10%).
The patient then was referred for MRguided biopsy for the two lesions in the inner quadrants that were detected through MR. The 6 mm nodule was a sclerosing adenosis. The 12 mm focal lesion was a fibrocystic disease with fibrosis and ductal dilatations.
Conservative surgery with sentinel lymph node removal was performed.
The malignant nodules were marked with ultrasound using the radioguided occult lesion localization (ROLL) technique, and the specimen confirmed the presence of two tumor foci measuring 15.4 mm and 12.9 mm.
The sentinel lymph node was negative.
Discussion
Using a rapid breast protocol, we are now able to get additional MR imaging information with high temporal resolution without the loss of spatial resolution.
Initial enhancement was significantly earlier in malignant tumors than in benign tumors, which means that the contrast agent reaches breast cancer faster than it reaches benign tumors, as previously described by Shin, et al.7.
New parameters (which need to be further evaluated) that increase specificity are: Initial enhancement phase (BAT) and Slope and Slope max, using the initial enhancement of the aorta as a reference point.
Correlation with prognostic factors indicates that5:
- The median time to enhancement (TTE) of invasive cancers is shorter than that of in situ cancers
- High histologic/nuclear grade cancers have a shorter TTE than low to intermediate grade cancers
- HER2-positive cancers demonstrate shorter TTE than HER2-negative cancers
- The median TTE of cancers with high Ki-67 is shorter than that of cancers with low Ki-67
- Shorter exam times, increased patient throughput
- Tolerance of protocol and patient variations to increase confidence in acquisition and diagnostic read
- Intelligent ringing suppression for image sharpness
- User-selectable noise reduction (increased SNR) with AIR™ Recon DL strength levels.
To summarize, the use of hybrid protocols (ultra-fast DCE plus standard DCE MR) as well as AIR™ Recon DL in the clinical routine, may increase the specificity of the breast MR technique and help avoid unnecessary biopsies.


