A
Figure 1.
Function assessment demonstrating pericardial effusion ≤10 mm. LVEF is 69% and RVEF is 69%. Acquisition: 1.6 x 1.6 x 8 mm, 20 phases, 8 sec./slice.
B
Figure 1.
Function assessment demonstrating pericardial effusion ≤10 mm. LVEF is 69% and RVEF is 69%. Acquisition: 1.6 x 1.6 x 8 mm, 20 phases, 8 sec./slice.
C
Figure 1.
Function assessment demonstrating pericardial effusion ≤10 mm. LVEF is 69% and RVEF is 69%. Acquisition: 1.6 x 1.6 x 8 mm, 20 phases, 8 sec./slice.
A
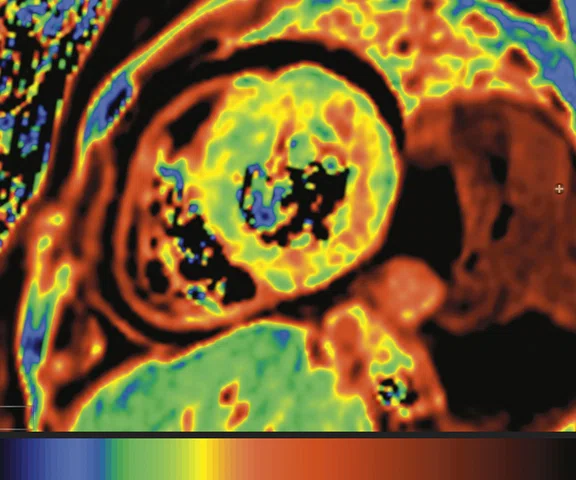
Figure 2.
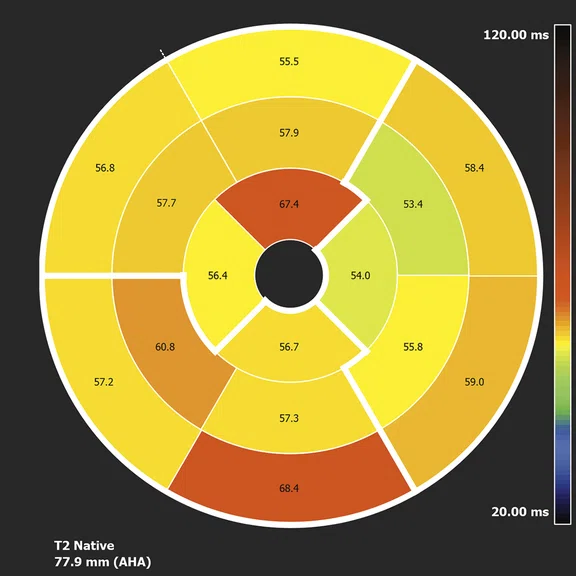
T2 map helps to detect the edema (inflammation) and acute phase. The mean T2 value of myocardium is 68 ms. (A) short axis T2 map and (B) T2 polar map.
B
Figure 2.
T2 map helps to detect the edema (inflammation) and acute phase. The mean T2 value of myocardium is 68 ms. (A) short axis T2 map and (B) T2 polar map.
A
Figure 3.
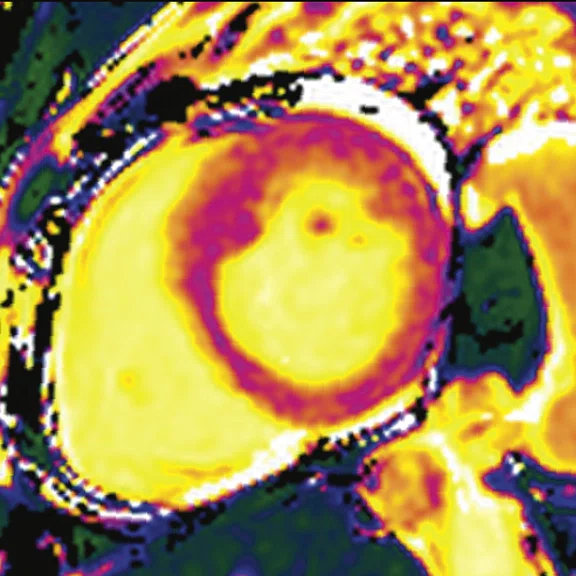
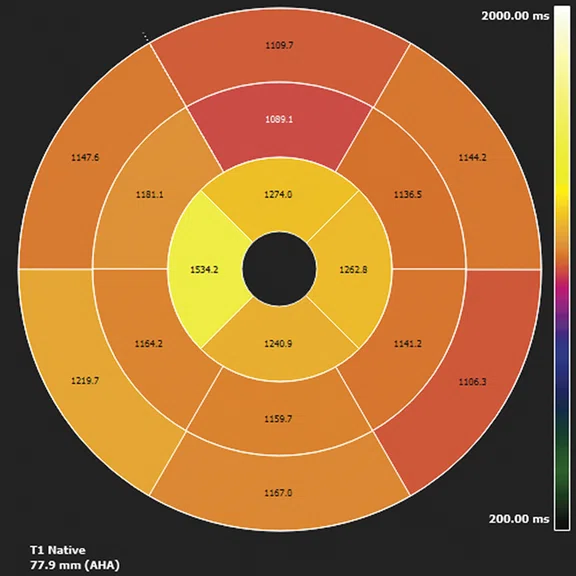
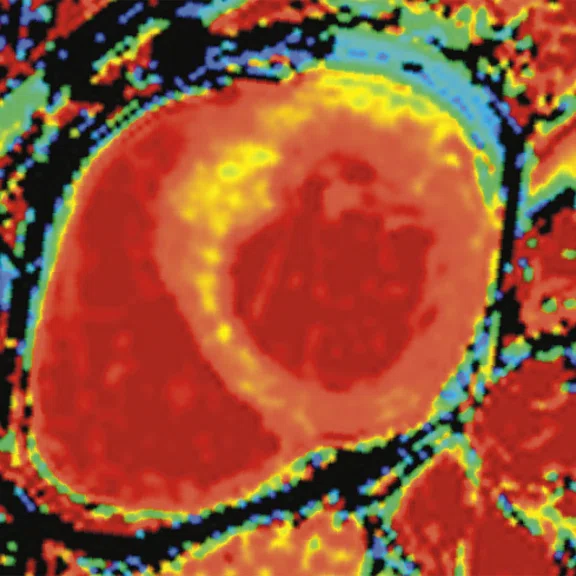
T1 native helps to detect the early modification in the myocardium structure. The mean T1 value of the myocardium is 1138 ms. (A) T1 native short axis map Molli 5(3)3, 192 x 192, 8 mm, 35 x 35 cm, 12 sec./slice and (B) T1 native polar map.
B
Figure 3.
T1 native helps to detect the early modification in the myocardium structure. The mean T1 value of the myocardium is 1138 ms. (A) T1 native short axis map Molli 5(3)3, 192 x 192, 8 mm, 35 x 35 cm, 12 sec./slice and (B) T1 native polar map.
A
Figure 4.
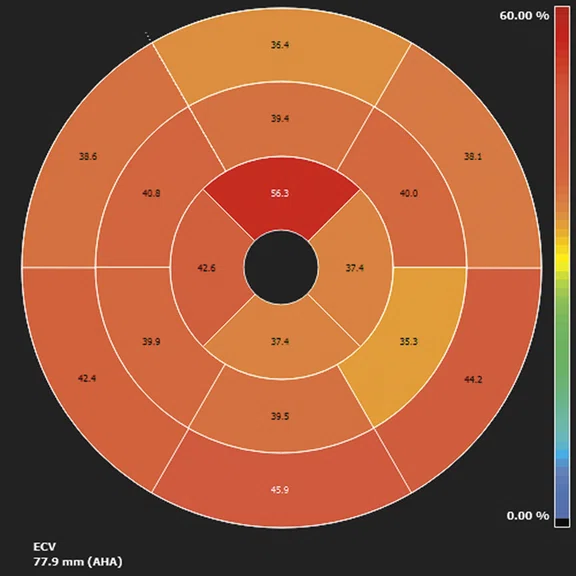
ECV is a marker of myocardial tissue remodeling and provides a physiologically intuitive unit of measurement. The mean ECV value of myocardium is 45.9%. (A) ECV map short axis and (B) ECV polar map.
B
Figure 4.
ECV is a marker of myocardial tissue remodeling and provides a physiologically intuitive unit of measurement. The mean ECV value of myocardium is 45.9%. (A) ECV map short axis and (B) ECV polar map.
A
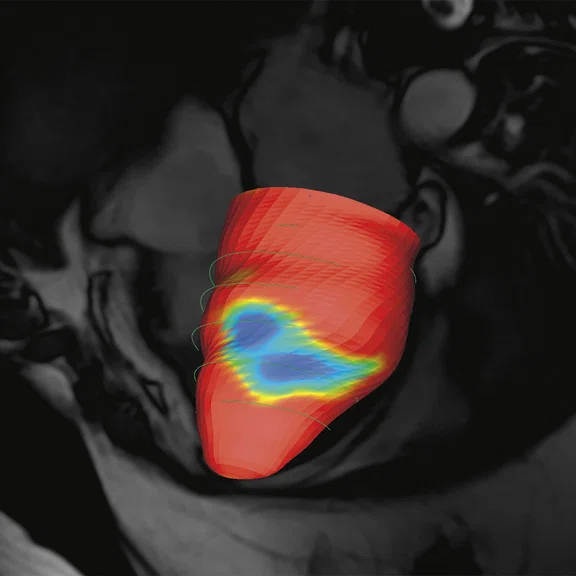
Figure 5.
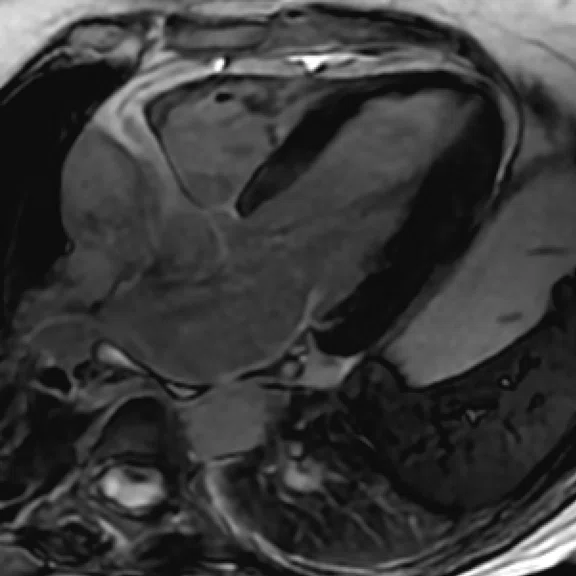
(A) Late gadolinium enhancement with AIR™ Recon DL, 1.6 x 1.6 x 8 mm, 20 phases, 8 sec./slice; (B) 3D strain analysis of LV results.
B
Figure 5.
(A) Late gadolinium enhancement with AIR™ Recon DL, 1.6 x 1.6 x 8 mm, 20 phases, 8 sec./slice; (B) 3D strain analysis of LV results.
result


PREVIOUS
${prev-page}
NEXT
${next-page}
Subscribe Now
Manage Subscription
FOLLOW US
Contact Us • Cookie Preferences • Privacy Policy • California Privacy PolicyDo Not Sell or Share My Personal Information • Terms & Conditions • Security
© 2024 GE HealthCare. GE is a trademark of General Electric Company. Used under trademark license.
CASE STUDIES
CMR for differential diagnosis of a septal mass
CMR for differential diagnosis of a septal mass
by Ahmed Al Jizeeri, MD, Consultant, Adult Cardiology and Advanced Cardiac Imaging, King Abdulaziz Cardiac Center National Guard, Riyadh, Saudi Arabia
One key advantage of cardiac MR is its ability to provide both qualitative differentiation of tissue and quantitative tissue characterization, as well as additional tissue properties such as vascularity and fibrosis with the use of contrast-enhanced sequences. Recently, our institution evaluated two new technologies, CardioMaps and AIR™ Recon DL, that are changing patient treatment models.
CardioMaps includes T1 mapping (MOLLI) for assessing inflammation, infection, amyloidosis and infarct, and T2 mapping for assessing edema and infarct. Both techniques include motion correction for accurate quantitative results. AIR™ Recon DL is a deep-learning-based reconstruction software that is applied to the raw imaging data to remove noise and ringing artifact for improved image quality.
Patient history
A 49-year-old female with scleroderma and diabetes was referred for CMR for evaluation of chest pain and shortness of breath. ECG showed normal sinus rhythm with T wave inversion in the high lateral leads. Echocardiogram showed normal left ventricular ejection fraction (LVEF) of >55% with no regional wall motion and no significant valvular pathology.
Results of CMR exam #1 — February 2017
LV and right ventricle (RV) were normal in size, wall motion and systolic function (LVEF=72%, RVEF=66%). There was no evidence of myocardial injury in either ventricle. A focal area of increased wall thickness measuring 14 mm in the mid segment of the anterolateral wall was detected, which could be a mass or early stage of focal hypertrophy due to hypertrophic cardiomyopathy (HCM). Patient was advised to follow-up for further evaluation of the mass in six months.
Results of CMR exam #2 — April 2018
Although the patient’s LVEF decreased to 63%, there were no significant changes noted.
The patient was referred for stress-rest rubidium 82 PET/CT, which depicted a small area of mild reversible perfusion defect in the mid anterior and mid anterolateral walls consistent with mild ischemia in the diagonal territory.
Results of CMR exam #3 — February 2021 (Figures 1–5)
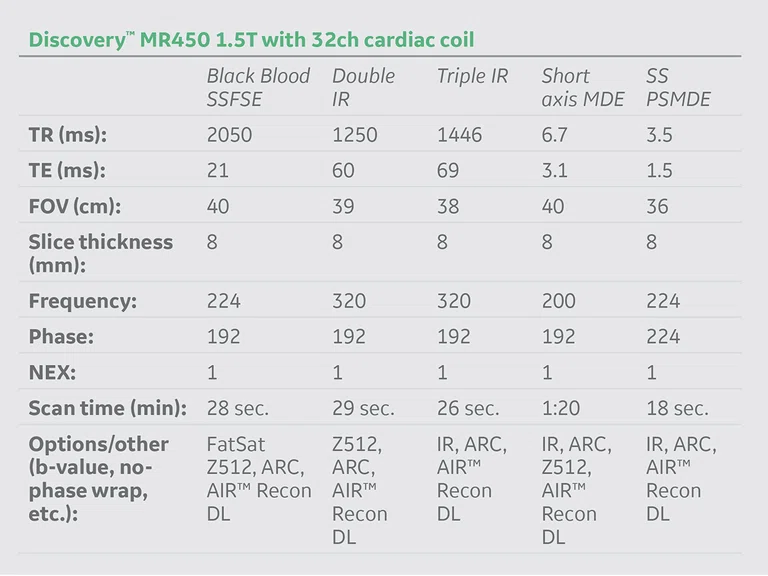
With the addition of CardioMaps on our Discovery™ MR450 1.5T system, short axis T1 and T2 mapping sequences were added. AIR™ Recon DL was utilized to process the LGE 2-, 3- and 4-channel SS PS MDE and short axis 2-, 3- and 4-channel MDE acquisitions.
Further tissue characterization with T1 and T2 parametric assessment showed increased T2 and T1 values with increased extracellular volume (ECV) at the site of the mass, indicating that the mass is likely to be pathological.
Discussion
This case illustrates the pivotal role of CMR in the evaluation of cardiac structure through tissue characterization. The crucial question in this case was whether CMR depicted a normal variant or a pathological entity that warrants further follow-up. Serial imaging with CMR did not provide a clear answer to this question.
Tissue characterization with CardioMaps demonstrated abnormality in T2 and T1 values, indicating a pathological process rather than a normal variant. The abnormal mass has evidence of inflammation, although the exact pathology is not yet clear. If it was not for the abnormal findings on the CardioMaps, we would have called the abnormalities a normal variant rather than an inflammatory mass. The patient is undergoing regular follow-up and currently has no cardiac symptoms.
New CMR technologies have changed the way we manage our patients. Parametric CMR provides a quantitative assessment of the myocardial tissue that provides additional information than the traditional semi-quantitative methods that can miss subtle abnormalities. The use of CardioMaps in this case helped provide the diagnosis that led to appropriate patient management of an inflammatory mass rather than normal variant. CardioMaps enhances our understating of the abnormalities we visualize and confirms the pathological entities in uncertain cases.


