A
Figure 1.
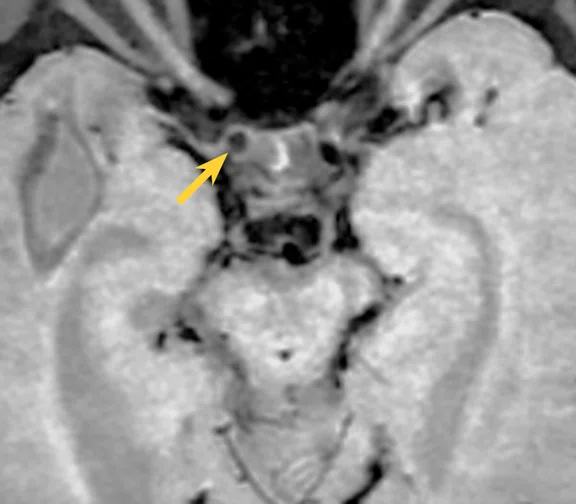
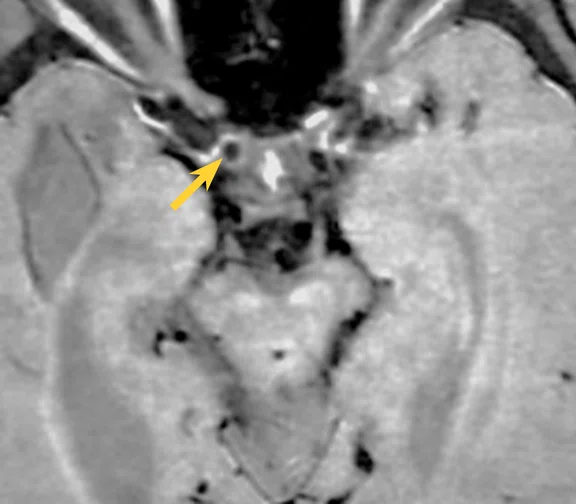
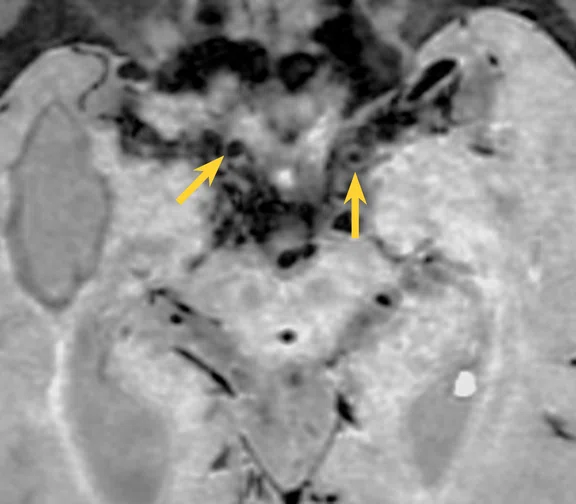
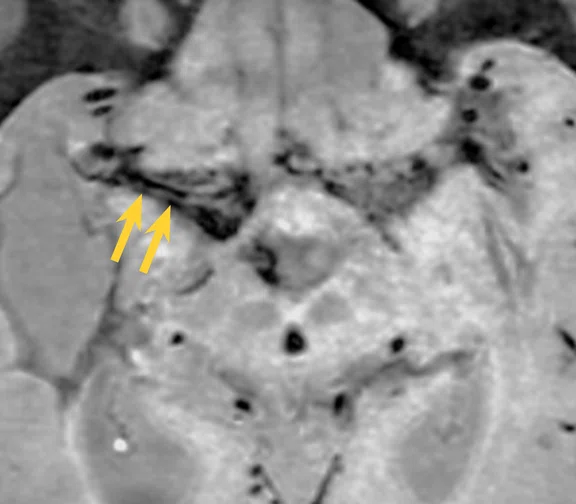
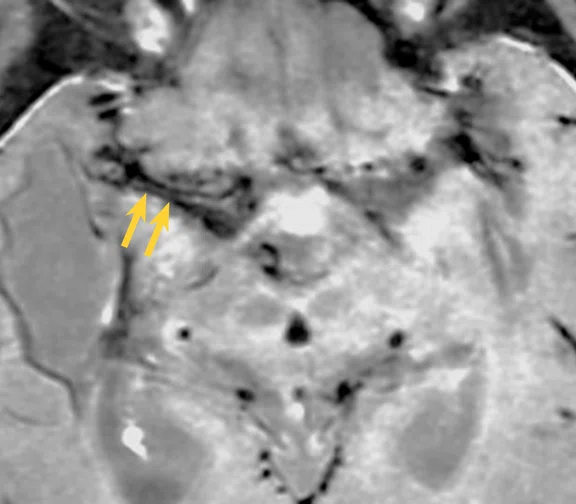
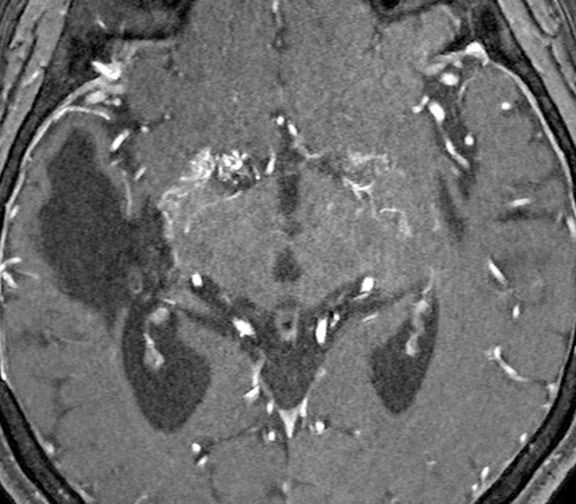
(A-E) 3D MSDE Cube images show variable pattern of wall thickening and enhancement of different vessel segments of the same patient. (A) Non-contrast image showing concentric wall thickening of distal right ICA (yellow arrow). (B) Post-contrast image showing concentric wall enhancement of distal right ICA (yellow arrow). (C) Non-contrast image showing negative remodeling of bilateral distal ICA (yellow arrows), vessel wall thickening of distal left ICA is also seen at this segment. (D) Non-contrast image showing concentric wall thickening and negative remodeling of right M1 (double yellow arrow) and no visualization of the left M1. (E) Post-contrast image showing no wall enhancement of distal right M1 (double yellow arrow). (F) Native axial post-contrast TOF image shows abnormal proliferation of bilateral lenticulostriate vessels.
B
Figure 1.
(A-E) 3D MSDE Cube images show variable pattern of wall thickening and enhancement of different vessel segments of the same patient. (A) Non-contrast image showing concentric wall thickening of distal right ICA (yellow arrow). (B) Post-contrast image showing concentric wall enhancement of distal right ICA (yellow arrow). (C) Non-contrast image showing negative remodeling of bilateral distal ICA (yellow arrows), vessel wall thickening of distal left ICA is also seen at this segment. (D) Non-contrast image showing concentric wall thickening and negative remodeling of right M1 (double yellow arrow) and no visualization of the left M1. (E) Post-contrast image showing no wall enhancement of distal right M1 (double yellow arrow). (F) Native axial post-contrast TOF image shows abnormal proliferation of bilateral lenticulostriate vessels.
C
Figure 1.
(A-E) 3D MSDE Cube images show variable pattern of wall thickening and enhancement of different vessel segments of the same patient. (A) Non-contrast image showing concentric wall thickening of distal right ICA (yellow arrow). (B) Post-contrast image showing concentric wall enhancement of distal right ICA (yellow arrow). (C) Non-contrast image showing negative remodeling of bilateral distal ICA (yellow arrows), vessel wall thickening of distal left ICA is also seen at this segment. (D) Non-contrast image showing concentric wall thickening and negative remodeling of right M1 (double yellow arrow) and no visualization of the left M1. (E) Post-contrast image showing no wall enhancement of distal right M1 (double yellow arrow). (F) Native axial post-contrast TOF image shows abnormal proliferation of bilateral lenticulostriate vessels.
D
Figure 1.
(A-E) 3D MSDE Cube images show variable pattern of wall thickening and enhancement of different vessel segments of the same patient. (A) Non-contrast image showing concentric wall thickening of distal right ICA (yellow arrow). (B) Post-contrast image showing concentric wall enhancement of distal right ICA (yellow arrow). (C) Non-contrast image showing negative remodeling of bilateral distal ICA (yellow arrows), vessel wall thickening of distal left ICA is also seen at this segment. (D) Non-contrast image showing concentric wall thickening and negative remodeling of right M1 (double yellow arrow) and no visualization of the left M1. (E) Post-contrast image showing no wall enhancement of distal right M1 (double yellow arrow). (F) Native axial post-contrast TOF image shows abnormal proliferation of bilateral lenticulostriate vessels.
E
Figure 1.
(A-E) 3D MSDE Cube images show variable pattern of wall thickening and enhancement of different vessel segments of the same patient. (A) Non-contrast image showing concentric wall thickening of distal right ICA (yellow arrow). (B) Post-contrast image showing concentric wall enhancement of distal right ICA (yellow arrow). (C) Non-contrast image showing negative remodeling of bilateral distal ICA (yellow arrows), vessel wall thickening of distal left ICA is also seen at this segment. (D) Non-contrast image showing concentric wall thickening and negative remodeling of right M1 (double yellow arrow) and no visualization of the left M1. (E) Post-contrast image showing no wall enhancement of distal right M1 (double yellow arrow). (F) Native axial post-contrast TOF image shows abnormal proliferation of bilateral lenticulostriate vessels.
F
Figure 1.
(A-E) 3D MSDE Cube images show variable pattern of wall thickening and enhancement of different vessel segments of the same patient. (A) Non-contrast image showing concentric wall thickening of distal right ICA (yellow arrow). (B) Post-contrast image showing concentric wall enhancement of distal right ICA (yellow arrow). (C) Non-contrast image showing negative remodeling of bilateral distal ICA (yellow arrows), vessel wall thickening of distal left ICA is also seen at this segment. (D) Non-contrast image showing concentric wall thickening and negative remodeling of right M1 (double yellow arrow) and no visualization of the left M1. (E) Post-contrast image showing no wall enhancement of distal right M1 (double yellow arrow). (F) Native axial post-contrast TOF image shows abnormal proliferation of bilateral lenticulostriate vessels.
result


PREVIOUS
${prev-page}
NEXT
${next-page}
Subscribe Now
Manage Subscription
FOLLOW US
Contact Us • Cookie Preferences • Privacy Policy • California Privacy PolicyDo Not Sell or Share My Personal Information • Terms & Conditions • Security
© 2024 GE HealthCare. GE is a trademark of General Electric Company. Used under trademark license.
Case Studies
Vessel wall imaging with 3.0T MR and MSDE for differentiating Moyamoya phenomenon
Vessel wall imaging with 3.0T MR and MSDE for differentiating Moyamoya phenomenon
By Wee Xin Pei, MBBS, and Norlisah Binti Mohd Ramli, FAAM, FRCR, MBBS, Professor of Radiology, Universiti Malaya Specialist Centre, Lembah Pantai, Kuala Lumpur, Malaysia
Moyamoya disease (MMD) is a rare, chronic occlusive cerebrovascular disorder characterized by endothelial hyperplasia and fibrosis of the intracranial portion of the carotid artery and its proximal branches, leading to progressive stenosis and occlusion. The disease often clinically manifests as ischemic or hemorrhagic stroke with high rates of morbidity and mortality. When there is associated disease, it is known as Moyamoya syndrome (MMS).
Frequently, the initial presentations of Moyamoya phenomenon are cerebral ischemic symptoms, seizure and acute cerebral hemorrhage. The diagnostic value of CT angiography in the setting of acute intracranial hemorrhage is suboptimal. Additionally, failure to perform specific vascular studies often results in missed diagnosis. Digital subtraction angiography (DSA) is the gold standard in diagnosis and staging of Moyamoya disease. However, this technology is only available at tertiary and quaternary hospitals with trained neuroradiologists.
In Moyamoya phenomenon (which includes MMD and MMS), there is progressive narrowing of the terminal internal cerebral artery (ICA) and the proximal segments of the middle and anterior cerebral arteries. These overlapping imaging features of MMD and MMS are secondary to atherosclerosis, autoimmune disease, post radiation cerebrovascular lesions, vasculitis and hematological disorders, which can also be difficult to confidently diagnose.
The advancement of SIGNA™ Premier 3.0T with MSDE Cube (Motion Sensitive Driven Equilibrium, also known as Vessel Wall Imaging) allows characterization of vessel wall findings in MMD and helps radiologists in distinguishing MMD from MMS due to vasculitis, inflammatory disorder and atherosclerosis. Staging of MMD is also made possible with vessel wall imaging.
Patient history
A 50-year-old patient weighing 145 lbs. (66 kg) with underlying thalassemia disease on routine blood transfusion with MMS. Patient was initially diagnosed with MMD in 2016 after presenting with cerebral ischemic symptoms. Patient underwent prior MR examination in November 2020 and again in June 2023 for surveillance of MMD. Lab results reveal low hemoglobin level of 7.8g/L and serum iron overload 1951.8μg/L.
Figure 1.
(A-E) 3D MSDE Cube images show variable pattern of wall thickening and enhancement of different vessel segments of the same patient. (A) Non-contrast image showing concentric wall thickening of distal right ICA (yellow arrow). (B) Post-contrast image showing concentric wall enhancement of distal right ICA (yellow arrow). (C) Non-contrast image showing negative remodeling of bilateral distal ICA (yellow arrows), vessel wall thickening of distal left ICA is also seen at this segment. (D) Non-contrast image showing concentric wall thickening and negative remodeling of right M1 (double yellow arrow) and no visualization of the left M1. (E) Post-contrast image showing no wall enhancement of distal right M1 (double yellow arrow). (F) Native axial post-contrast TOF image shows abnormal proliferation of bilateral lenticulostriate vessels.
Results
MR imaging study shows variable pattern of wall thickening and enhancement of different vessel segments of the same patient.
A. Non-contrast image showing concentric wall thickening of distal right ICA (Figure 1A, yellow arrow).
B. Post-contrast image showing concentric wall enhancement of distal right ICA (Figure 1B, yellow arrow).
C. Non-contrast image showing negative remodeling of bilateral distal ICA (Figure 1C, yellow arrows), vessel wall thickening of distal left ICA is also seen at this segment.
D. Non-contrast image showing concentric wall thickening and negative remodeling of right M1 (Figure 1D, double yellow arrow). Non visualization of the left M1.
E. Post-contrast image showing no wall enhancement of distal right M1 (Figure 1E, double yellow arrow).
F. Axial TOF image shows abnormal proliferation of bilateral lenticulostriate vessels (Figure 1F).
Discussion
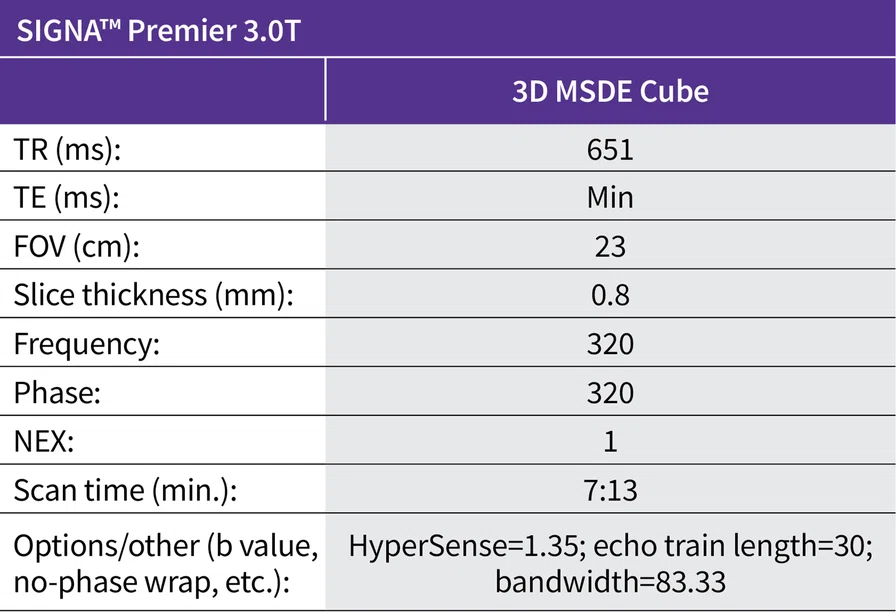
High-resolution imaging on SIGNA™ Premier 3.0T with MSDE provided the information needed to determine vessel wall thickness. Post-contrast wall enhancement helped in the diagnosis and monitoring of MMD. Utilizing HyperSense with MSDE Cube shortened scan times by 30%, from 10:43 minutes to 7:13 minutes. Shorter scan times improve patient compliance, which reduces motion artifacts and the need for sedation, and enables our facility to scan more patients and potentially reduce the cost of the MR examination.
This case highlights long-term monitoring of MMD, as it is potentially life-threatening. The use of MR imaging, a less invasive and more accessible imaging modality compared to cerebral angiography, helps with better patient compliance in cases where long-term monitoring of disease is required.
DOWNLOAD ARTICLE HERE


