A
Figure 1.
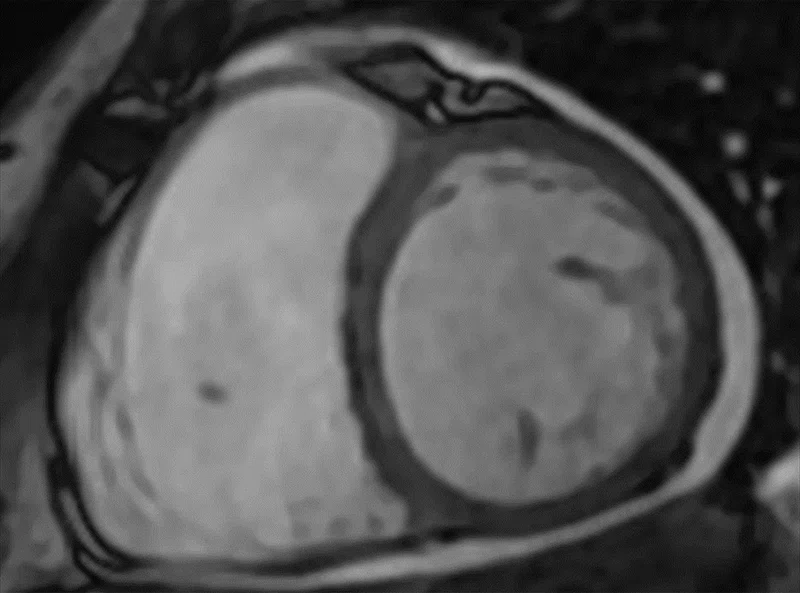
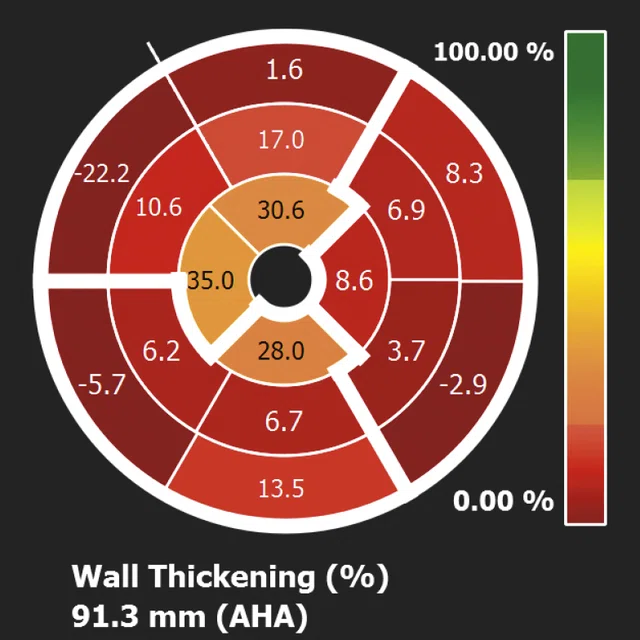
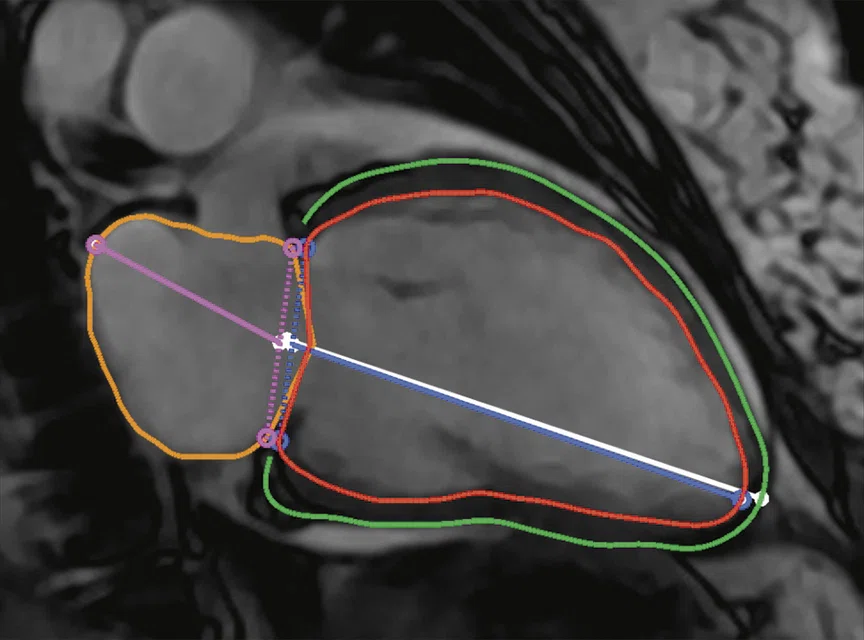
First CMR exam. Function assessment using FIESTA demonstrates reduced ejection fraction and moderate dilation of the left ventricle. (A, C) FIESTA and (B) polar map.
B
Figure 1.
First CMR exam. Function assessment using FIESTA demonstrates reduced ejection fraction and moderate dilation of the left ventricle. (A, C) FIESTA and (B) polar map.
C
Figure 1.
First CMR exam. Function assessment using FIESTA demonstrates reduced ejection fraction and moderate dilation of the left ventricle. (A, C) FIESTA and (B) polar map.
D
Figure 2.
Second CMR exam (A) Time course motion correction with AIR™ Recon DL compensates for misalignment from respiratory and residual cardiac motion; (B) short axis MDE, 2 x 2.1 x 8 mm, 1:20 min.; (C) short axis BB SSFSE, 1.8 x 2.1 x 8 mm, 28 sec.; (D) short axis T2 BB IR FSE, 1.2 x 2 x 8 mm, 29 sec.; and (E) short axis triple IR FSE, 1.2 x 2 x 8 mm, 26 sec.
E
Figure 2.
Second CMR exam (A) Time course motion correction with AIR™ Recon DL compensates for misalignment from respiratory and residual cardiac motion; (B) short axis MDE, 2 x 2.1 x 8 mm, 1:20 min.; (C) short axis BB SSFSE, 1.8 x 2.1 x 8 mm, 28 sec.; (D) short axis T2 BB IR FSE, 1.2 x 2 x 8 mm, 29 sec.; and (E) short axis triple IR FSE, 1.2 x 2 x 8 mm, 26 sec.
A
Figure 2.
Second CMR exam (A) Time course motion correction with AIR™ Recon DL compensates for misalignment from respiratory and residual cardiac motion; (B) short axis MDE, 2 x 2.1 x 8 mm, 1:20 min.; (C) short axis BB SSFSE, 1.8 x 2.1 x 8 mm, 28 sec.; (D) short axis T2 BB IR FSE, 1.2 x 2 x 8 mm, 29 sec.; and (E) short axis triple IR FSE, 1.2 x 2 x 8 mm, 26 sec.
B
Figure 2.
Second CMR exam (A) Time course motion correction with AIR™ Recon DL compensates for misalignment from respiratory and residual cardiac motion; (B) short axis MDE, 2 x 2.1 x 8 mm, 1:20 min.; (C) short axis BB SSFSE, 1.8 x 2.1 x 8 mm, 28 sec.; (D) short axis T2 BB IR FSE, 1.2 x 2 x 8 mm, 29 sec.; and (E) short axis triple IR FSE, 1.2 x 2 x 8 mm, 26 sec.
A
Figure 3.
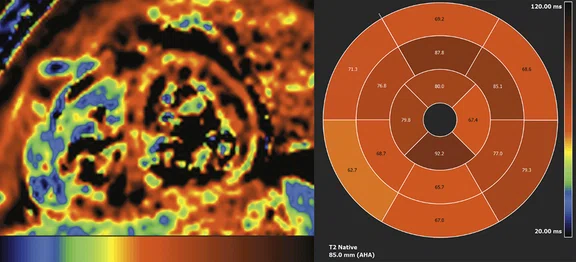
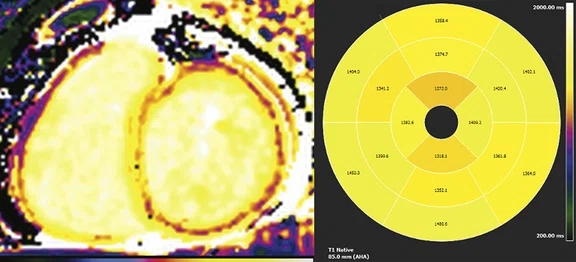
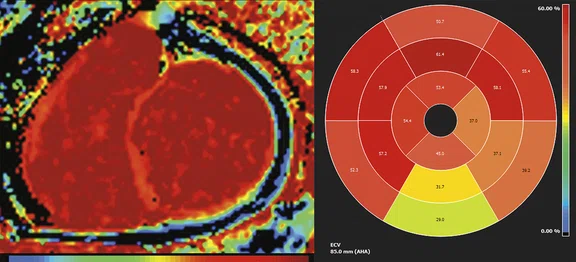
Third CMR exam (A) Short axis T2 map with polar map helps to detect the edema (inflammation) and acute phase, the mean T2 value of myocardium is 88.2ms. (B) Short axis Molli T1 map with T1 native polar map helps to detect the early modification in the myocardium structure; the mean T1 value of myocardium is 1453 ms. (C) Extra-cellular volume (ECV) short axis map with polar map; ECV is a marker of myocardial tissue remodeling and provides a physiologically intuitive unit of measurement, mean ECV value of myocardium is 50%.
B
Figure 3.
Third CMR exam (A) Short axis T2 map with polar map helps to detect the edema (inflammation) and acute phase, the mean T2 value of myocardium is 88.2ms. (B) Short axis Molli T1 map with T1 native polar map helps to detect the early modification in the myocardium structure; the mean T1 value of myocardium is 1453 ms. (C) Extra-cellular volume (ECV) short axis map with polar map; ECV is a marker of myocardial tissue remodeling and provides a physiologically intuitive unit of measurement, mean ECV value of myocardium is 50%.
C
Figure 2.
Second CMR exam (A) Time course motion correction with AIR™ Recon DL compensates for misalignment from respiratory and residual cardiac motion; (B) short axis MDE, 2 x 2.1 x 8 mm, 1:20 min.; (C) short axis BB SSFSE, 1.8 x 2.1 x 8 mm, 28 sec.; (D) short axis T2 BB IR FSE, 1.2 x 2 x 8 mm, 29 sec.; and (E) short axis triple IR FSE, 1.2 x 2 x 8 mm, 26 sec.
result


PREVIOUS
${prev-page}
NEXT
${next-page}


Subscribe Now
Manage Subscription
FOLLOW US
Contact Us • Cookie Preferences • Privacy Policy • California Privacy PolicyDo Not Sell or Share My Personal Information • Terms & Conditions • Security
© 2024 GE HealthCare. GE is a trademark of General Electric Company. Used under trademark license.
CASE STUDIES
Advanced cardiac imaging with AI changes patient treatment
Advanced cardiac imaging with AI changes patient treatment
by Ahmed Al Jizeeri, MD, Consultant, Adult Cardiology and Advanced Cardiac Imaging, and Mosaad Alhussein, MD, Heart Failure and Transplant Cardiologist, King Abdulaziz Cardiac Center National Guard, Riyadh, Saudi Arabia
Cardiac MR (CMR) is a useful modality for evaluating both the anatomy and function of the heart chambers, valves and surrounding structures. It can also quantify blood flow, volume and ejection fraction. As such, CMR is often utilized for patient follow-up in cases of non-ischemic cardiomyopathy cases.
The ability to perform T1 and T2 mapping with CardioMaps and cvi42, and utilize AIR™ Recon DL for improved image quality by reducing noise and ringing artifacts and improving SNR and image sharpness plays a significant role in the evaluation of patients with heart failure. CMR provides an accurate assessment of left ventricular ejection fraction (LVEF) and underlying pathology to guide precise and personalized management of these patients, which can be reviewed and quantified using cvi42.
Patient history
A 59-year-old woman with diabetes, hypothyroidism and prior bariatric surgery presented with inflammatory myositis and heart failure with reduced ejection fraction, LVEF <25%. She presented with symptoms of volume overload and was admitted to the hospital with decompensated heart failure. Due to low cardiac output requiring inotropes, the patient had a prolonged hospital stay with multiple ICU admissions.
CBC showed white blood count (WBC) of 10, Hb 105 mg/l and platelet 251. Renal function was normal. Troponin remained elevated at 400-662 mg/mL. Echocardiogram showed severe LV systolic dysfunction with LVEF <25% with global hypokinesia and severe right ventricle (RV) systolic dysfunction.
Patient was placed on cardiac transplantation list. However, the ongoing inflammation of the myocardium with chronically elevated troponin in this patient led us to request a CMR exam.
Results of CMR exam #1 — February 2021 (Figure 1)
- LV is moderately dilated with severe LV dysfunction, LVEF = 22%. No LV clot noted.
- RV is moderately dilated with moderate to severe RV dysfunction, RVEF = 27%.
- Myocardial delayed enhancement (MDE) images were degraded by lack of patient cooperation and heart rate variability. The short axis images demonstrated presence of 25-50% of sub-endocardial delayed hyper enhancement in the inferior and inferoseptal segments, suggesting ischemic origin. However, the discrepancy between the severe LV dysfunction and the degree of myocardial injury shown by MDE suggests the possibility of an embolic phenomenon, especially if coronary risk assessment does not show presence of significant CAD.
Two days after the CMR exam, the patient underwent diagnostic coronary angiography. Results for left main coronary artery, left ventricular, circumflex artery and right coronary artery were all angiographically normal.
Patient underwent an endomyocardial biopsy which showed non-specific features. While the initial CMR did not show evidence of edema by qualitative assessment, it showed a subendocardial myocardial delayed enhancement of the RV myocardium, which may explain the biopsy findings.
Results of CMR exam #2 — 17 days after initial CMR (Figure 2)
- Moderately dilated LV with severe systolic dysfunction. LVEF = 27%.
- Moderately dilated RV with severe systolic dysfunction. LVEF = 26%.
- No thrombi seen within the LV cavity.
- Ischemic myocardial injury is seen within inferoseptal and inferior wall that could be due to decreased coronary perfusion due to high LV end-diastolic pressure (LVEDP) or embolic phenomenon.
A radial FIESTA Cine was acquired and cvi42 from Circle Cardiovascular Imaging was utilized for functional assessment, including T1 and T2 mapping. AIR™ Recon DL was used in the acquisition of: Black Blood (BB) SSFSE, Double IR, STIR; perfusion time course with motion correction (MoCo); LGE 2-, 3- and 4-channel SS PSMDE; and short axis and 2-, 3- and 4-channel MDE.
Figure 2.
Second CMR exam (A) Time course motion correction with AIR™ Recon DL compensates for misalignment from respiratory and residual cardiac motion; (B) short axis MDE, 2 x 2.1 x 8 mm, 1:20 min.; (C) short axis BB SSFSE, 1.8 x 2.1 x 8 mm, 28 sec.; (D) short axis T2 BB IR FSE, 1.2 x 2 x 8 mm, 29 sec.; and (E) short axis triple IR FSE, 1.2 x 2 x 8 mm, 26 sec.
Results of CMR exam #3 — 39 days after initial CMR (Figure 3)
- Moderately dilated LV with severe systolic dysfunction. LVEF = 21%.
- Moderately dilated RV with severe systolic dysfunction. RVEF = 27%.
- No thrombi is seen within the LV cavity.
- Ischemic myocardial injury is seen within inferoseptal and inferior wall that could be due to decreased coronary perfusion due to high LVEDP or embolic phenomenon.
- Delayed enhancement is also seen along the endocardial border of the RV.
- There is evidence of ongoing inflammation by T2 mapping.
- Compared to the previous study (exam #2), the LVEF has dropped from 27% to 21% but the LVED volume has improved from 225 ml (130 ml/m2) to 202 ml (124 ml/m2) with no significant change in the myocardial edema.
- There is evidence of ongoing inflammation (T2 = 88.2 ms, T1 = 1453 ms and ECV = 60-80%).
An echocardiogram approximately one month after the third CMR exam confirmed prior CMR results, with no significant changes.
Figure 3.
Third CMR exam (A) Short axis T2 map with polar map helps to detect the edema (inflammation) and acute phase, the mean T2 value of myocardium is 88.2ms. (B) Short axis Molli T1 map with T1 native polar map helps to detect the early modification in the myocardium structure; the mean T1 value of myocardium is 1453 ms. (C) Extra-cellular volume (ECV) short axis map with polar map; ECV is a marker of myocardial tissue remodeling and provides a physiologically intuitive
Results
Patient has a moderately dilated LV with severe systolic dysfunction LVEF = 21% and moderately dilated RV with severe systolic dysfunction RVEF = 27%. The mean T2 value of the myocardium is 88.2 ms, an increase of 39% compared to the normal value. The mean T1 native value of the myocardium is 1453 ms, an increase of 48% compared to the normal value. The mean ECV value of the myocardium is 50%, an increase of 60% compared to the normal value.
Discussion
This patient did not respond to guideline-directed medical therapy for heart failure, and she had a number of co-morbid conditions that made her a high risk for transplantation. Given her presentation, it was felt that inflammatory cardiomyopathy should be excluded.
This case illustrates the growing role of CMR in evaluating patients prior to cardiac transplantation. In this patient, CMR helped confirm that heart failure decompensation was secondary to ongoing inflammation particularly with elevated troponin, in which case the transplantation was deferred. The patient was started on immunosuppressive therapy with pulse steroid and IV immunoglobulin and rituximab. Subsequently, the patient’s clinical condition improved, and she was removed from the transplant list and discharged home after three months of hospitalization.
This case also demonstrates why cardiac biopsy sometimes fails to demonstrate the exact pathology of the patient. The biopsy is usually taken from the endocardial side of the right ventricle, which in this case has evidence of myocardial injury with MDE and therefore may not demonstrate the pathology.
CardioMaps has demonstrated ongoing diffuse inflammation with globally increased T2 values, indicating an active ongoing inflammation that could not have been seen with regular edema evaluation. Deep-learning reconstruction technology with AIR™ Recon DL significantly improved the image quality by eliminating noise, improving SNR and reducing ringing artifact.
In our institution, CMR will have a significant role in the evaluation of patients with heart failure who are referred for cardiac transplantation through the accurate assessment of LVEF, evaluation of underlying pathology and ability to help guide precise management of these processes.


