1. Bertagna F, Albano D, Cerudelli E, Gazzilli M, Giubbini R, Treglia G. Potential of Radiolabeled PSMA PET/CT or PET/ MRI Diagnostic Procedures in Gliomas/Glioblastomas. Curr Radiopharm. 2020;13(2):94-98. doi:10.2174/1874471012666 191017093721.
2. Kadrmas DJ, Hoffman JM. Methodology for quantitative rapid multi-tracer PET tumor characterizations. Theranostics. 2013;3(10):757-773. Published 2013 Oct 4. doi:10.7150/ thno.5201.
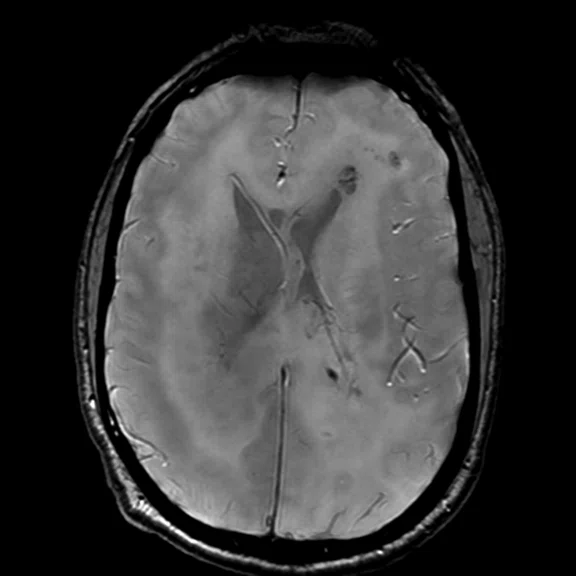
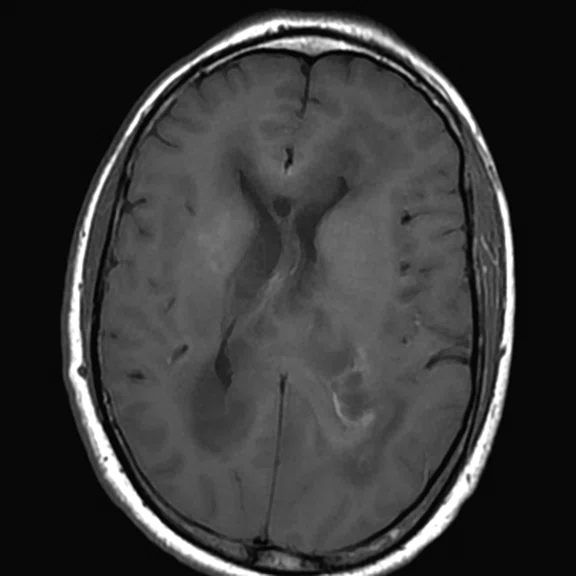
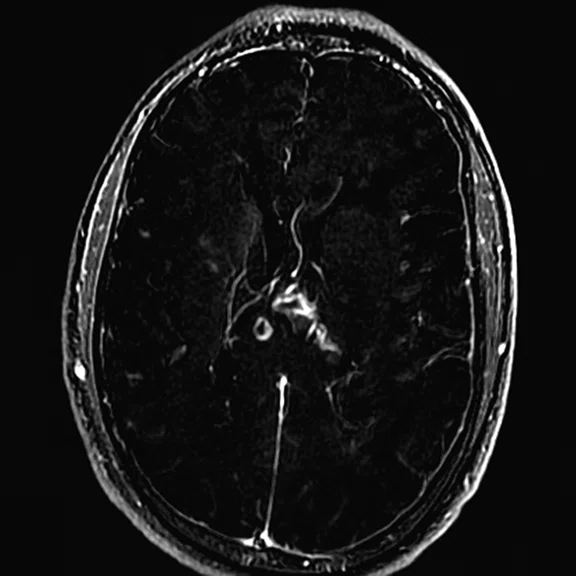
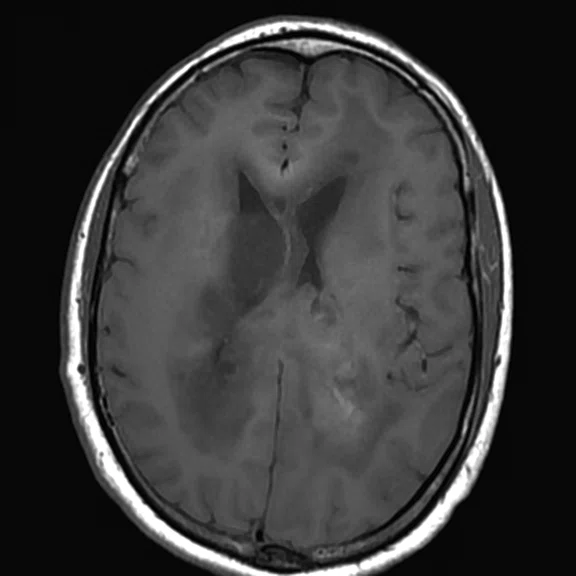
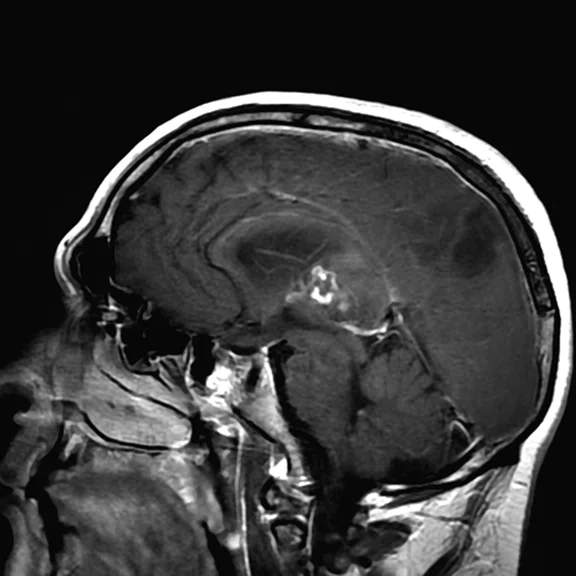
Figure 1.
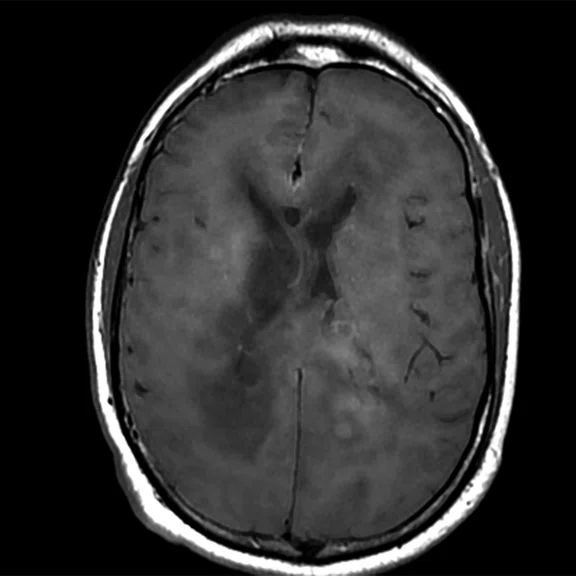
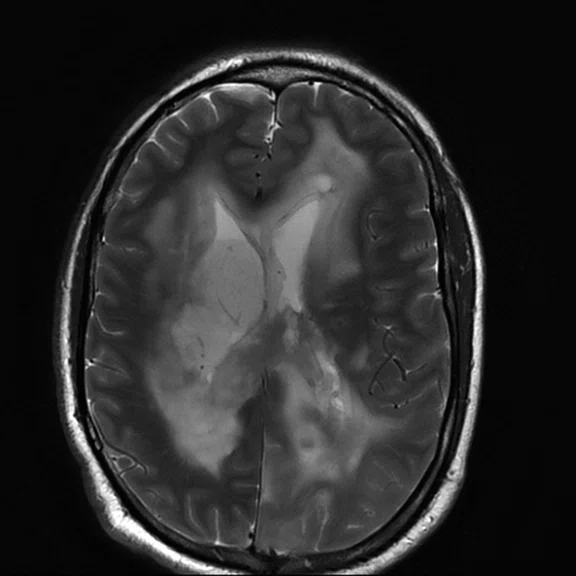
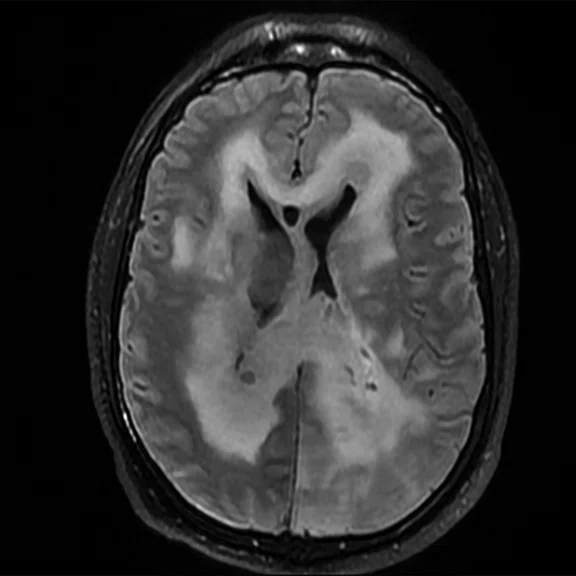
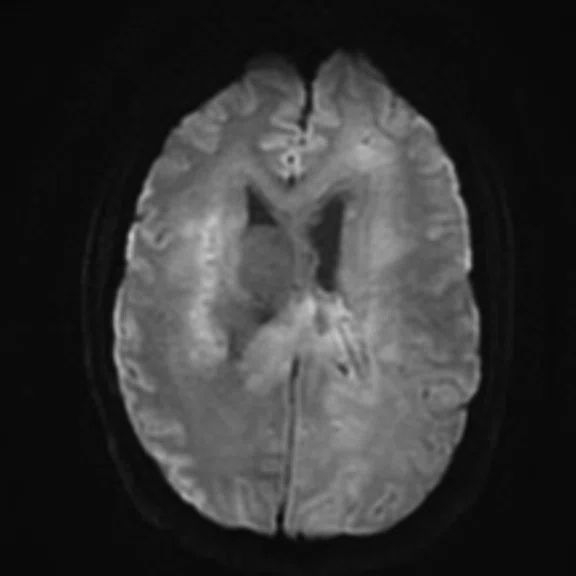
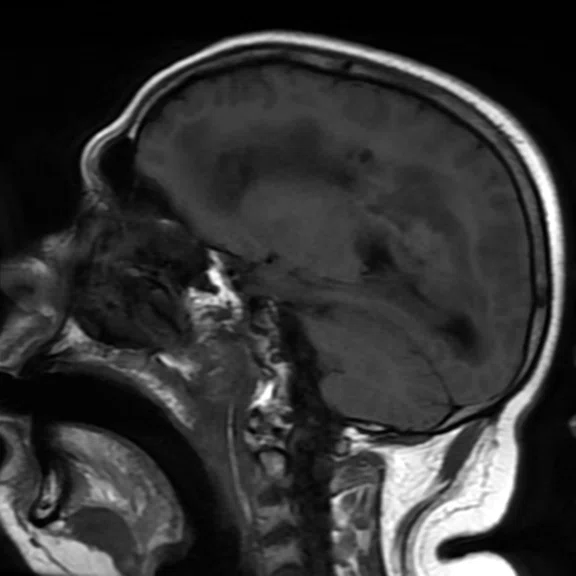
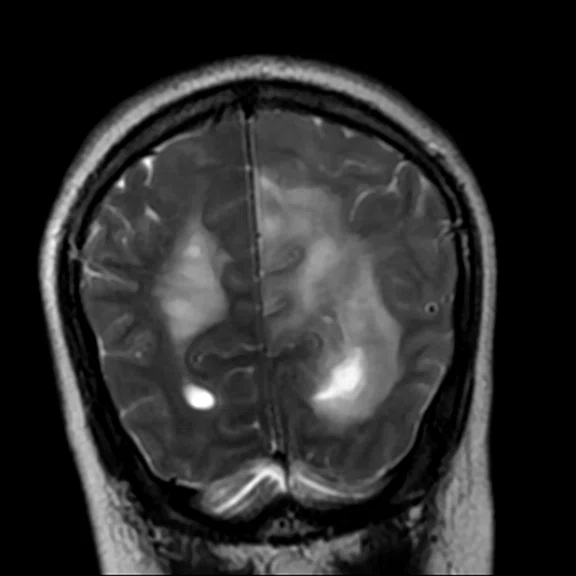
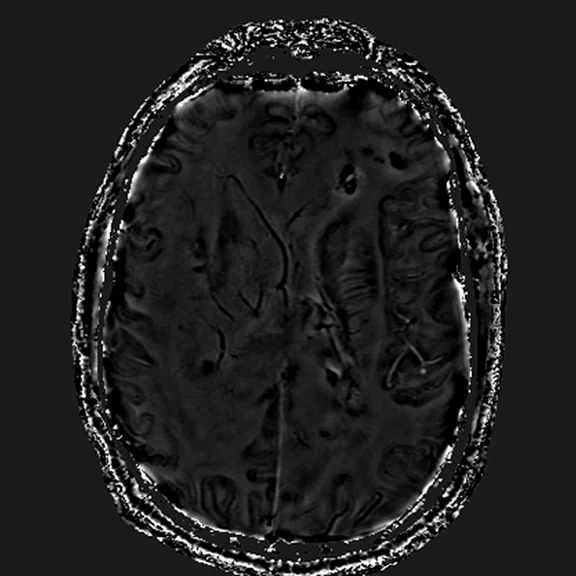
Conventional MR pre-contrast, T2, FLAIR, DWI and susceptibility-weighted imaging sequences.
Figure 1.
Conventional MR pre-contrast, T2, FLAIR, DWI and susceptibility-weighted imaging sequences.
Figure 1.
Conventional MR pre-contrast, T2, FLAIR, DWI and susceptibility-weighted imaging sequences.
Figure 1.
Conventional MR pre-contrast, T2, FLAIR, DWI and susceptibility-weighted imaging sequences.
Figure 1.
Conventional MR pre-contrast, T2, FLAIR, DWI and susceptibility-weighted imaging sequences.
Figure 1.
Conventional MR pre-contrast, T2, FLAIR, DWI and susceptibility-weighted imaging sequences.
Figure 1.
Conventional MR pre-contrast, T2, FLAIR, DWI and susceptibility-weighted imaging sequences.
Figure 1.
Conventional MR pre-contrast, T2, FLAIR, DWI and susceptibility-weighted imaging sequences.
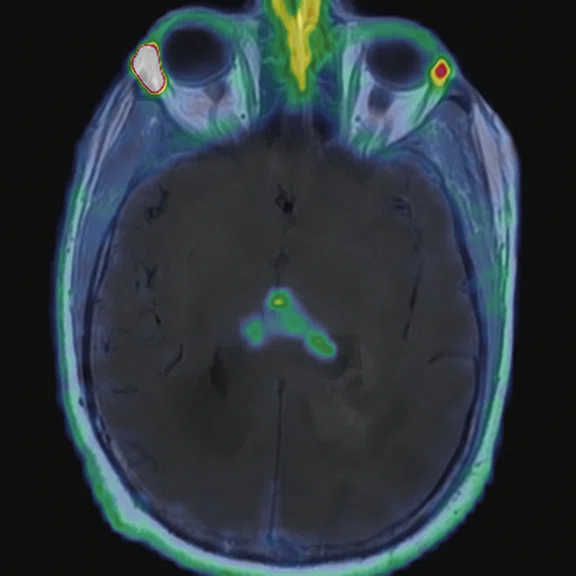
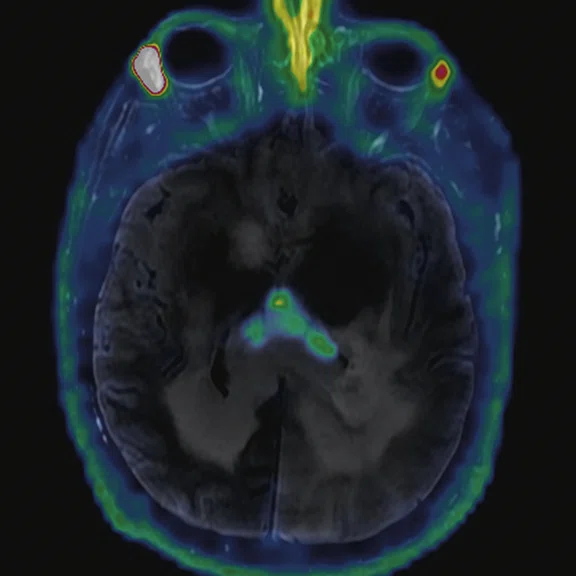
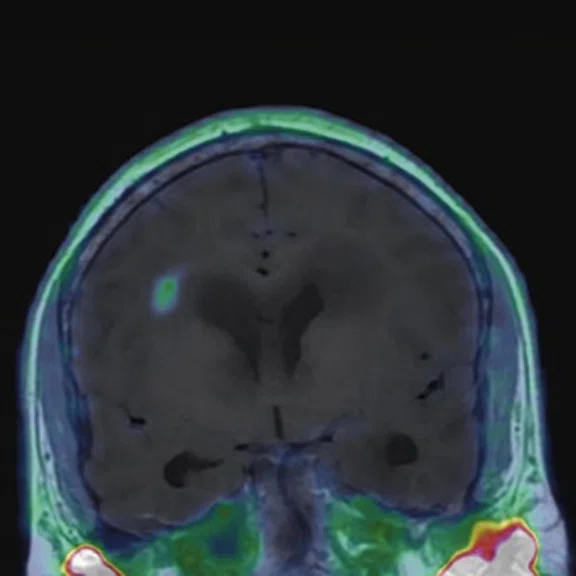
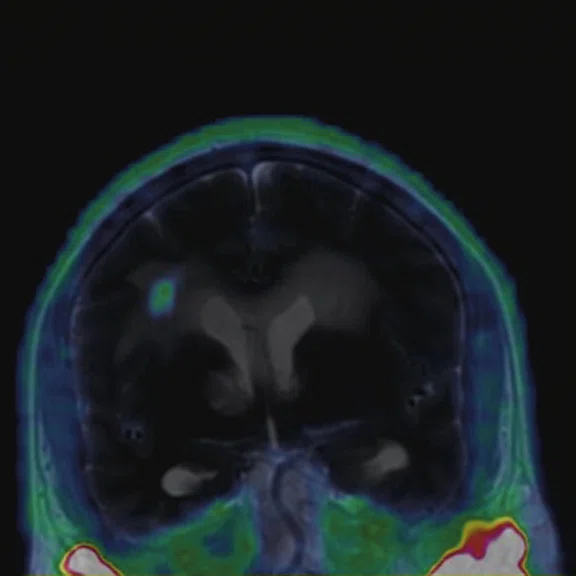
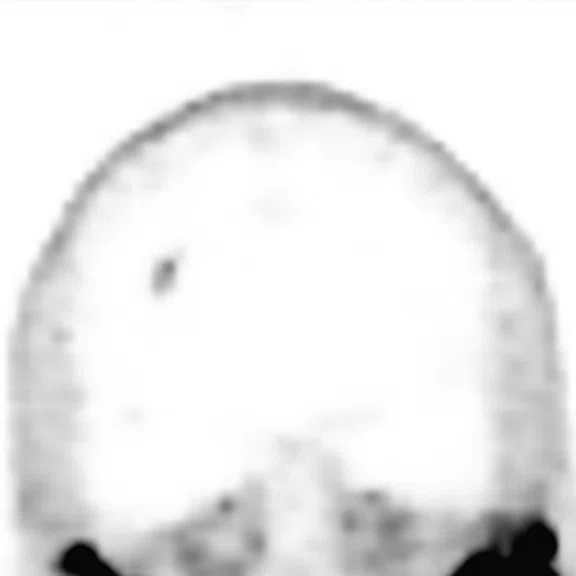
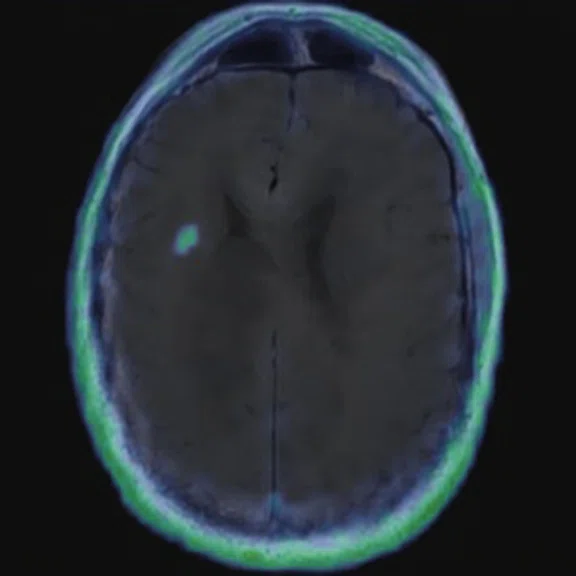
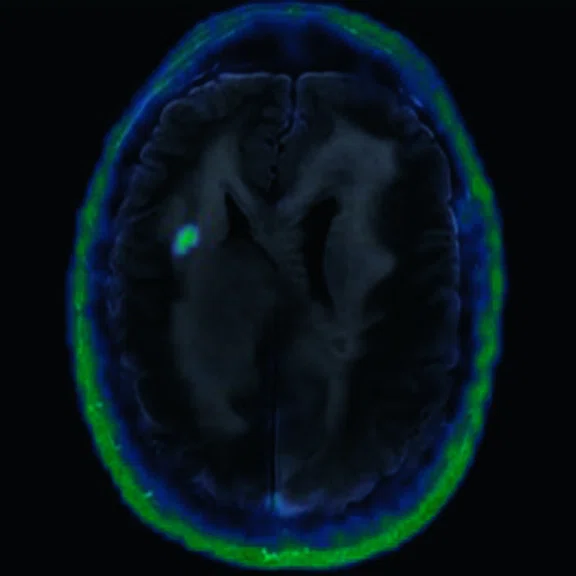
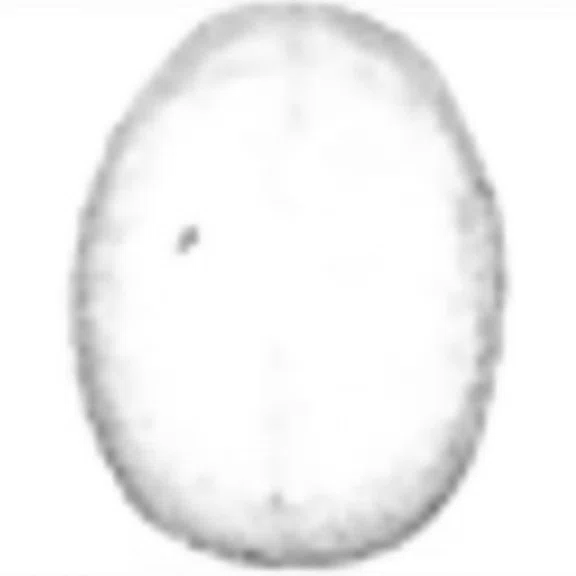
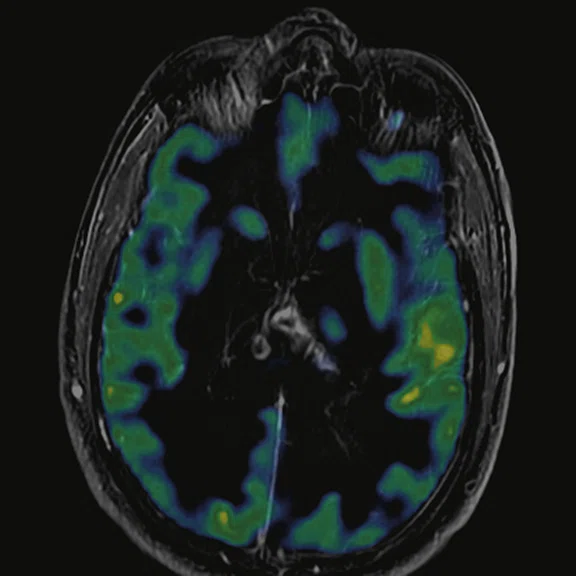
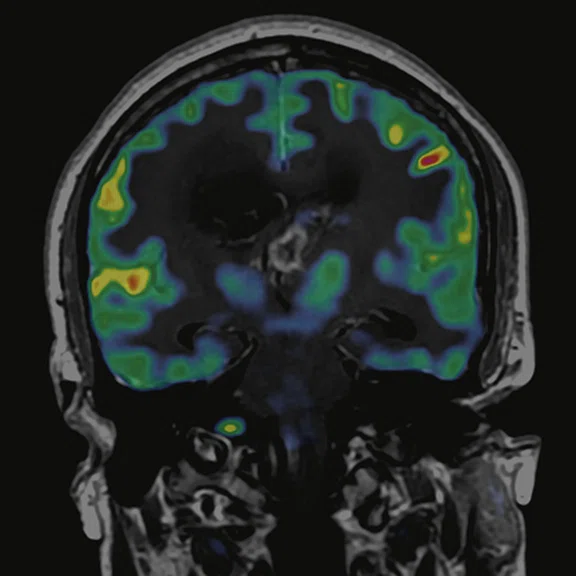
Figure 2.
68Ga-PSMA PET/MR fused images.
Figure 2.
68Ga-PSMA PET/MR fused images.
Figure 2.
68Ga-PSMA PET/MR fused images.
Figure 2.
68Ga-PSMA PET/MR fused images.
Figure 2.
68Ga-PSMA PET/MR fused images.
Figure 2.
68Ga-PSMA PET/MR fused images.
Figure 2.
68Ga-PSMA PET/MR fused images.
Figure 2.
68Ga-PSMA PET/MR fused images.
Figure 2.
68Ga-PSMA PET/MR fused images.
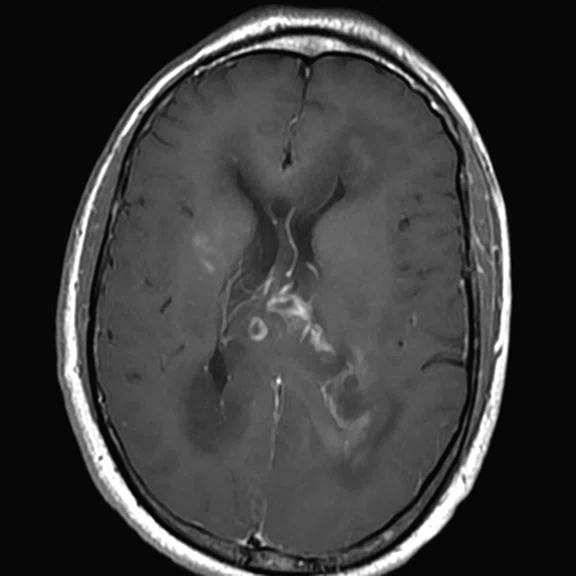
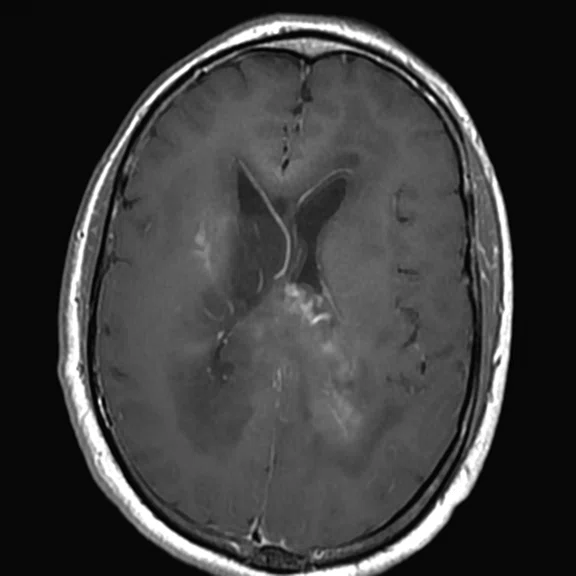
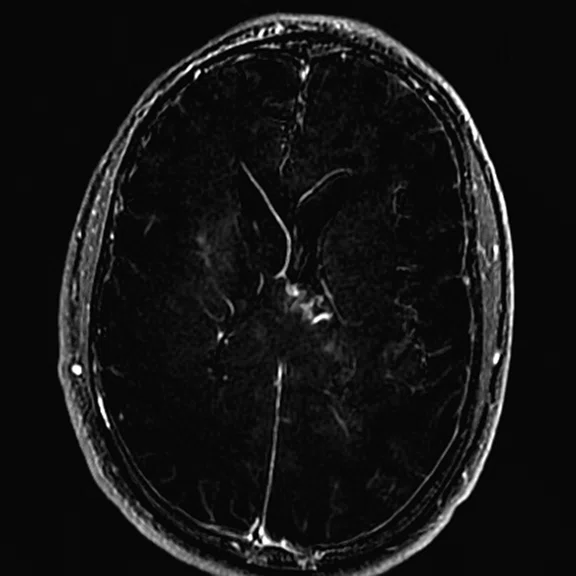
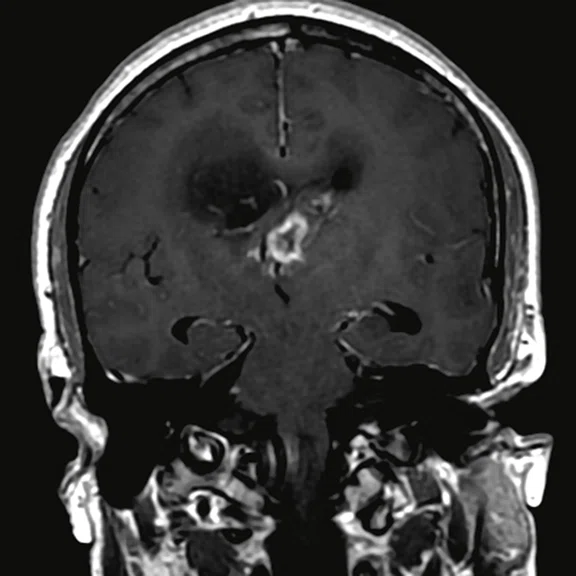
Figure 3.
Day 2 exam, conventional MR pre- and post-contrast with subtraction.
Figure 3.
Day 2 exam, conventional MR pre- and post-contrast with subtraction.
Figure 3.
Day 2 exam, conventional MR pre- and post-contrast with subtraction.
Figure 3.
Day 2 exam, conventional MR pre- and post-contrast with subtraction.
Figure 3.
Day 2 exam, conventional MR pre- and post-contrast with subtraction.
Figure 3.
Day 2 exam, conventional MR pre- and post-contrast with subtraction.
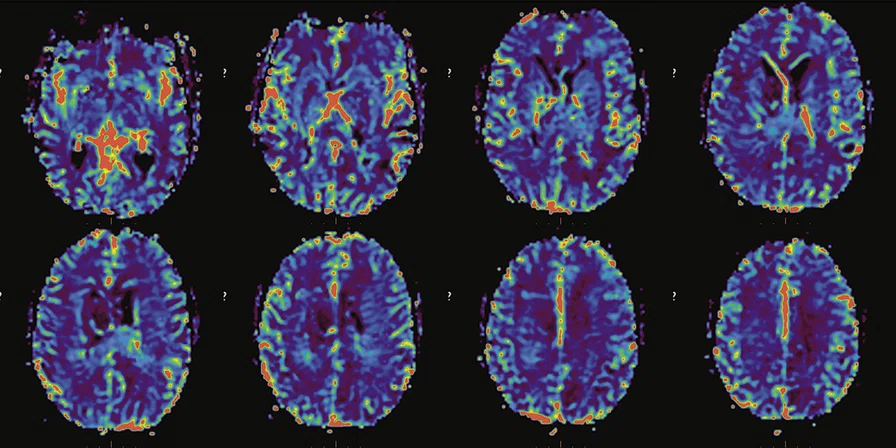
Figure 4.
Susceptibility perfusion (T2*) rCBV map.
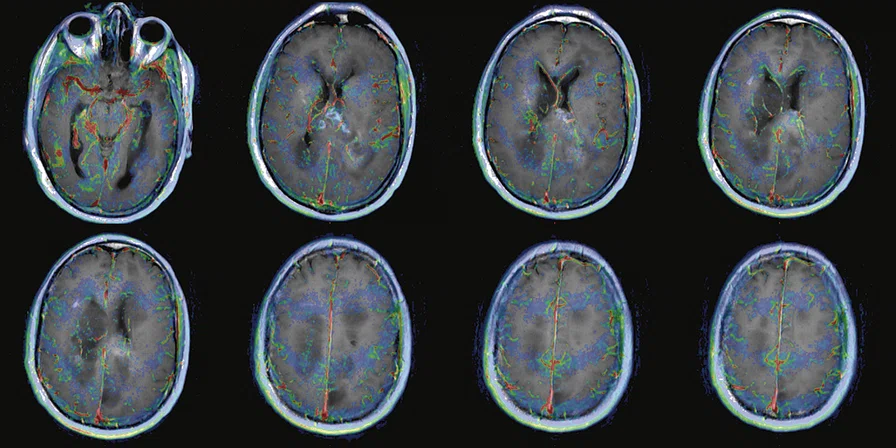
Figure 5.
Permeability perfusion (T1 + C) Ktrans map.
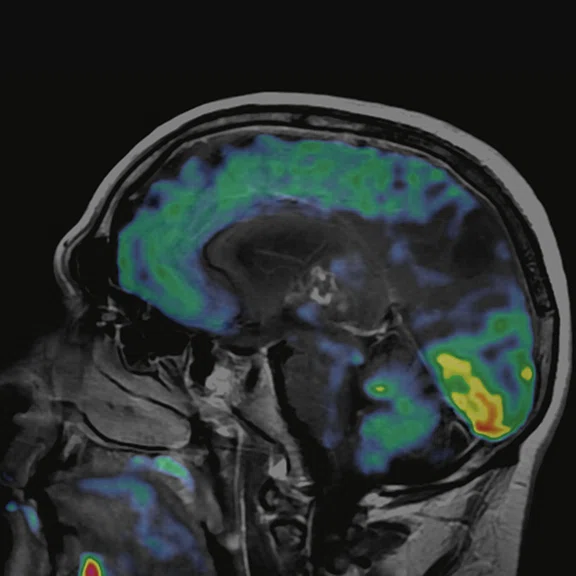
Figure 6.
FDG-PET/MR images.
Figure 6.
FDG-PET/MR images.
Figure 6.
FDG-PET/MR images.
Figure 6.
FDG-PET/MR images.
Figure 6.
FDG-PET/MR images.
Figure 6.
FDG-PET/MR images.
Figure 6.
FDG-PET/MR images.
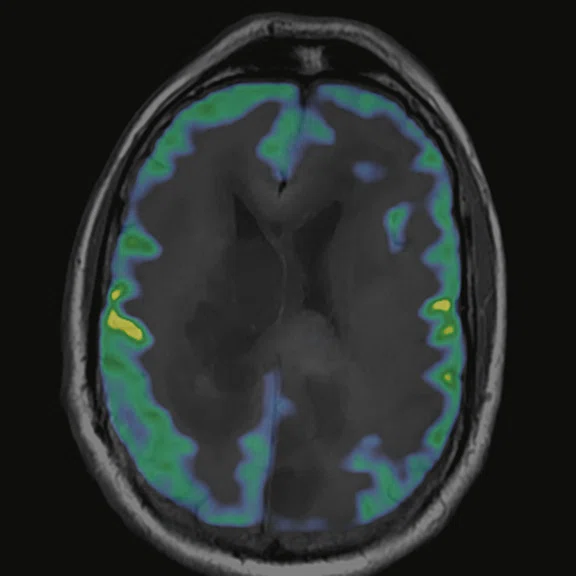
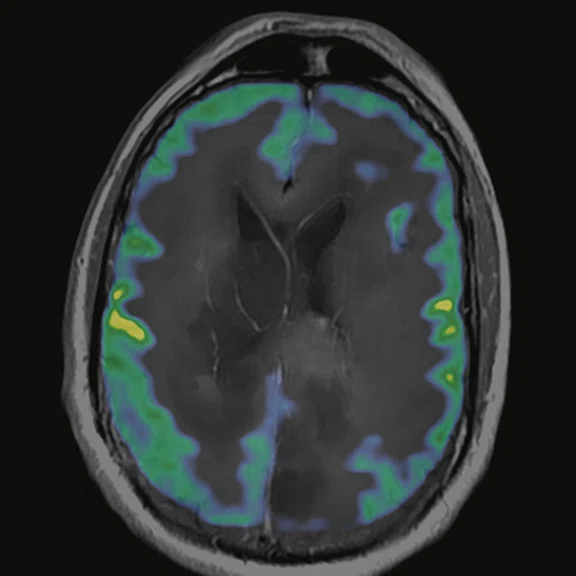
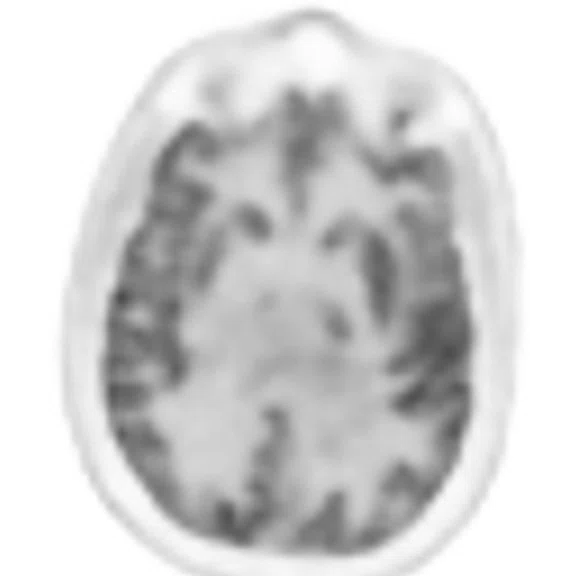
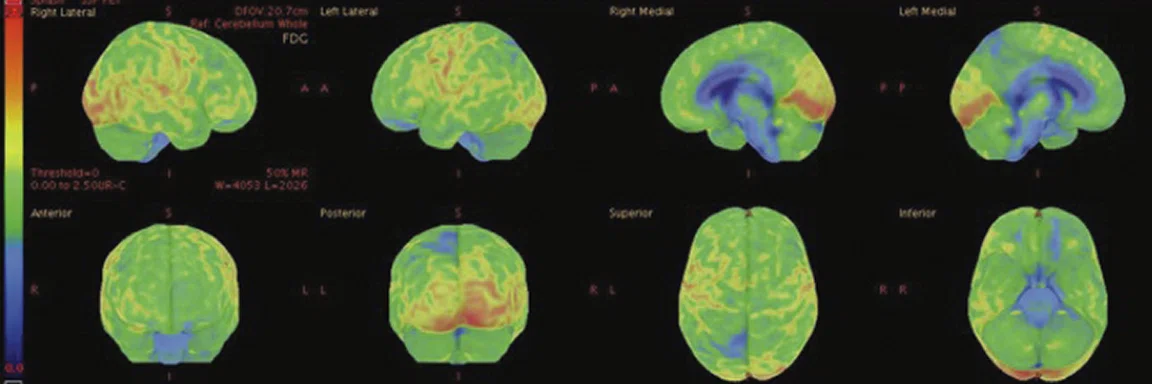
Figure 7.
18F-FDG images processed with CortexID Suite.
Figure 6.
FDG-PET/MR images.
Figure 6.
FDG-PET/MR images.
Figure 6.
FDG-PET/MR images.
Figure 6.
FDG-PET/MR images.
Figure 6.
FDG-PET/MR images.
result


PREVIOUS
${prev-page}
NEXT
${next-page}
Subscribe Now
Manage Subscription
FOLLOW US
Contact Us • Cookie Preferences • Privacy Policy • California Privacy PolicyDo Not Sell or Share My Personal Information • Terms & Conditions • Security
© 2024 GE HealthCare. GE is a trademark of General Electric Company. Used under trademark license.
CASE STUDIES
Multiparametric, multi-tracer PET/MR in the brain
Multiparametric, multi-tracer PET/MR in the brain
Patient history
A 31-year-old male referred to PET/MR for a multiparametric study to further characterize a diffuse lesion within the brain infra- and supra-tentorially.
Submitted by Professor Yasser Abdel Azim, MD, PhD, Mohamed Z. Elkanawaty, MSc, and Ahmed M. Elzoghby, PGDip, FRCR, Misr Radiology Center (MRC), New Cairo, Egypt
Multiparametric PET/MR is useful for characterizing diffuse lesions in the brain. Excellent anatomical detail from MR combined with molecular imaging capabilities of PET provides valuable clinical information in a single imaging session for diagnosing and staging lesions, and assessing treatment response. The introduction of new tracers, such as 68-Gallium (68Ga) PSMA, opens up new opportunities to further confirm the diagnosis and potentially predict biochemical response in certain cancers, including gliomas and glioblastomas1 . There is growing evidence that the use of multitracer PET imaging can further confirm tumor physiology in oncology applications2 .
Method
MR brain protocol: Pre- and post-contrast; diffusion with ADC; susceptibility with magnitude and phase images; MR perfusion; single voxel and multivoxel MR spectroscopy.
PET brain protocol: Day 1 imaging, 4.9 mCi 68Ga-PSMA; day 2 imaging, 7.5 mCi 18F-FDG. Patient’s blood glucose level on day 2 was 124 mg/dl.
Findings
Conventional MR
There is a rather diffuse, widespread lesion within the brain infra- and supra-tentorially best seen on FLAIR and T2-weighted images. A diffuse zone of abnormal high signal is visualized in the deep cerebral white matter bilaterally, slightly more on the left side and a similar but less impressive extension on the left side at the frontal region of the brain.
On the right side, there is more involvement of the deep parietal region, in particular the genu of internal capsule and adjoining parts of the deep gray matter. There is also remarkable callosal involvement in this case by the lesion. Infra-tentorially, the lesion appears to involve the cerebellar peduncles, and the adjoining dentate nuclei of cerebellar vermis is surrounding the fourth ventricle.
The post-contrast series show that the lesions are mostly non-enhancing except for a few small, scattered zones of rather intense enhancement right frontally and left deep parietally as well as callosally. There is consequent positive mass effect, especially in the attenuation of lateral ventricles as well as attenuation of the fourth ventricle.
MR diffusion
The susceptibility data shows small foci of blooming susceptibility effect in the enhancing regions, specifically on the left side posteriorly as well as callosally. Diffusion restriction and low ADC denote high cell packing on the left side and callosally, suggesting high-grade malignancy.
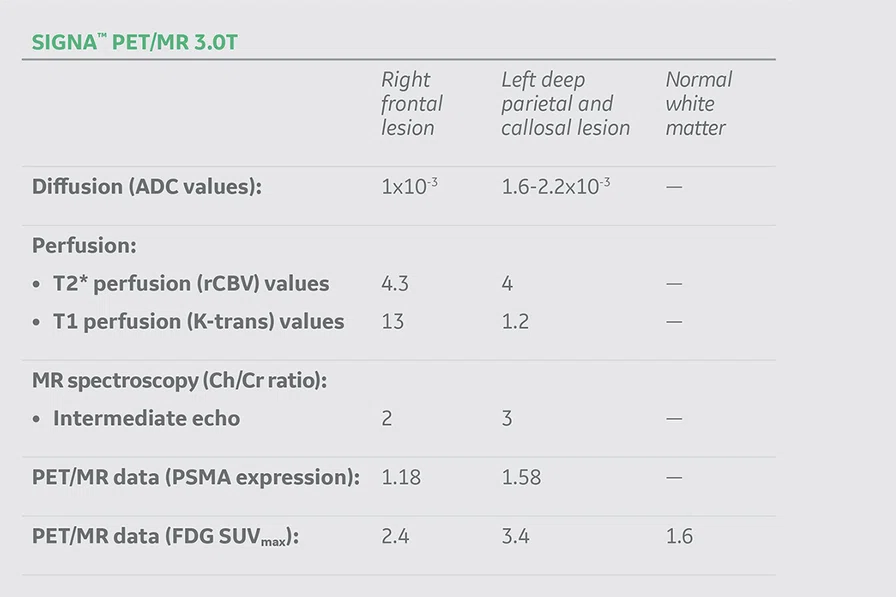
In the deep left-sided posterior region, the ADC value is the lowest at 1 × 10⁻³, while elsewhere, the ADC values range between 1.6 × 10⁻³ and 2.2 × 10⁻³.
MR perfusion
T2* shows that the overall lesion is mostly isoperfused to normal white matter except for portions of relative hyperperfusion in the focal right frontal subcortical and deep-seated, small lesions and also the left deep parietal and callosal lesions. In lesions showing high rCBV, the ratio of the lesion compared to normal white matter is 4.3 for the frontal component, while for the deep callosal components the ratio is about 4.
T1 perfusion shows mild-to-moderate hyperperfusion of the lesions in the right frontal and callosal and deep left parietal with a Ktrans ratio for the right at 1.3 and the callosal at 1.2.
MR spectroscopy
The spectroscopic profile for the more intensely enhancing lesions demonstrates: moderate-to-marked abnormal elevation in choline of accentuated cell membrane turnover; moderate abnormal elevations in lipid and lactate of necrosis and hypoxia; moderate abnormal reduction of normal neuronal marker N-acetyl aspartate; and mild abnormal elevation of myoinositol of astrocytosis.
PET imaging
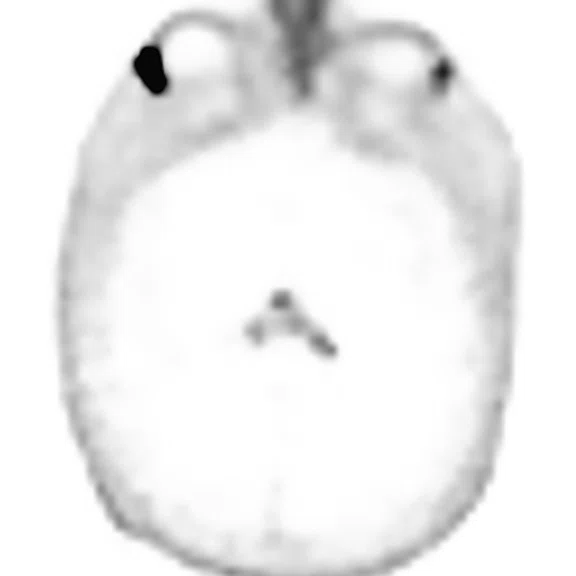
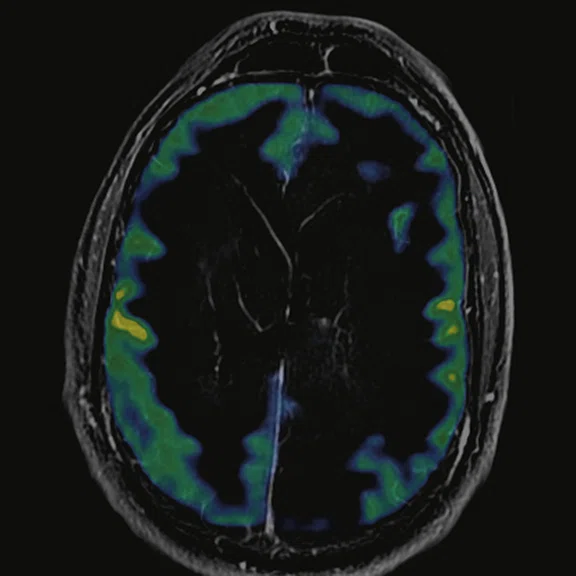
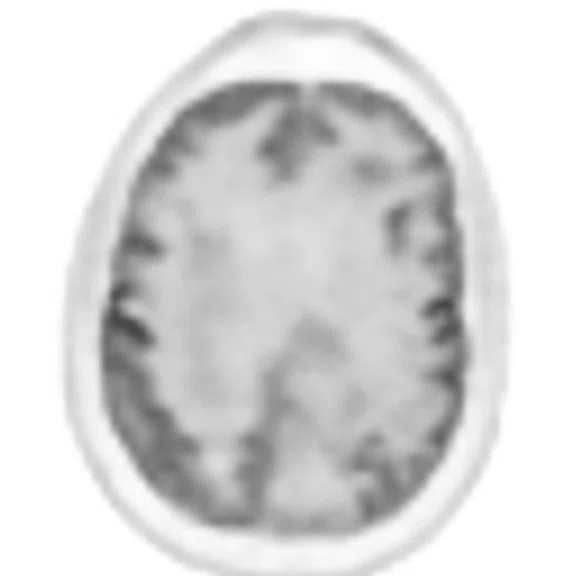
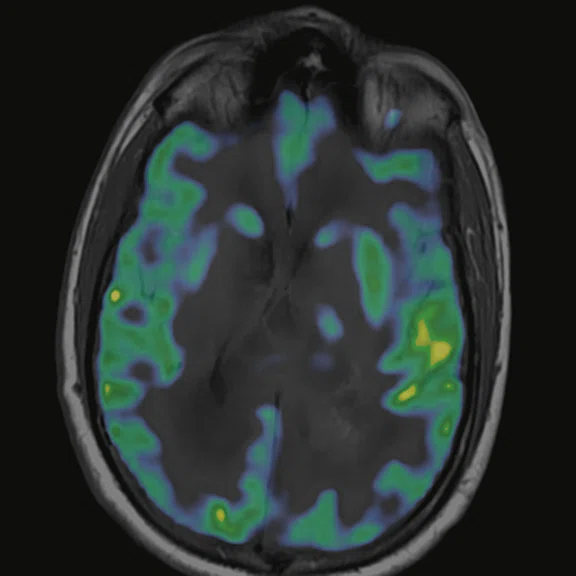
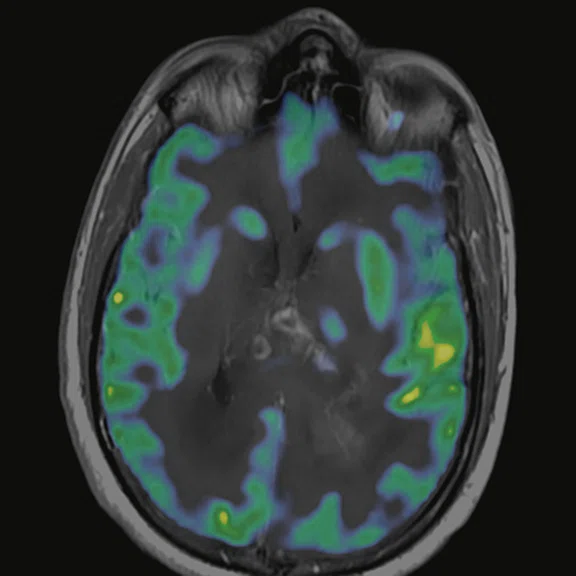
There is evident moderate-to-marked hypermetabolic activity of the right frontal lesions and the callosal lesions in the original PET data with Q.Clear and on the fused PET/MR data.
Only high-grade tumors take up PSMA while FDG is taken up by the normal parenchyma. The quantitative assessment showed high values of PET tracer uptake: the right frontal lesion PSMA expression is 1.18 and the callosal lesion PSMA expression is 1.58; the FDG SUVmax for the right frontal lesion is 3.4 and the FDG SUVmax for the callosal lesion is 2.4. The FDG SUVmax for normal brain parenchyma is 1.6.
Conclusion
The multiparametric data indicates widespread diffuse lesion infra- and supra-tentorially, implicating various brain structures in more than one lobe, likely diffuse anaplastic astrocytoma (formally known as gliomatosis cerebri before the WHO 2016 brain tumor classification). There are highgrade malignant transformations on top of low or intermediate grade malignancy, particularly at the right frontal region subcortically and deeply, as well as at the posterior aspect of corpus callosum, more to the left and adjoining left deep parietal region.
The overall pattern is not primary CNS lymphoma, which would show remarkable total diffusion restriction and intense post-contrast enhancement of all the lesions. Also, CNS lymphoma is typically localized and confined, not widespread as in this case. Furthermore, CNS lymphoma would show remarkable hypermetabolic activity throughout the lesion, not just in small and separate regions as in this case.
Based on the quantitative and qualitative data from this multiparametric and multitracer PET/MR exam, the diagnosis can be confidently called as diffuse anaplastic astrocytoma pattern with portions of high-grade transformation on top.
Discussion
In this case, the use of multi-tracer PET with anatomic (conventional), diffusion, perfusion and spectroscopy MR imaging provided complete information to make a confident diagnosis and rule out metastatic etiology. The ability to capture quantitative parameters with PET (FDG SUVmax and PSMA expression) and MR (ADC, perfusion and spectroscopy) is important to accurately monitor the patient’s therapy response.


