‡Not yet CE marked for 1.5T. Not available for sale in all regions.
1. Villanueva-Meyer J, Shin D, Li Y, et al. Denoising MR Images of the Cervical Spine: Multi-Reader Assessment of a Deep Learning Approach. Radiological Society of North America 2019 Scientific Assembly and Annual Meeting, December 1 - December 6, 2019, Chicago IL. archive.rsna.org/2019/19018947.html. Accessed October 7, 2020.
1. Fendler WP, Czernin J, Herrmann K, Beyer T. Variations in PET/MRI Operations: Results from an International Survey Among 39 Active Sites. J Nucl Med. 2016;57(12):2016-2021. doi:10.2967/jnumed.116.174169
2. Miles KA, Voo SA, Groves AM. Additional Clinical Value for PET/MRI in Oncology: Moving Beyond Simple Diagnosis. J Nucl Med. 2018 Jul;59(7):1028-1032. doi: 10.2967/jnumed.117.203612. Epub 2018 Mar 15. PMID: 29545379.
3. Song T, Cui B, Yang H, et al. Diffusion-weighted imaging as a part of PET/MR for small lesion detection in patients with primary abdominal and pelvic cancer, with or without TOF reconstruction technique. Abdom Radiol (NY). 2019 Jul;44(7):2639-2647.
4. Shang K, Cui B, Ma J, et al. Clinical evaluation of whole-body oncologic PET with time-of-flight and point-spread function for the hybrid PET/MR system. Eur J Radiol. 2017 Aug;93:70-75.
5. Yang H, Lu J, Cui B, Zhang Y. Quantitative performance and optimal regularization parameter in block sequential regularized expectation maximization reconstructions in carotid plaques with 18F-FDG PET/MR. J Nucl Med May 1, 2020;61(S1):3001.
6. Song S, Cheng Y, Ma J, Wang L, Dong C, Wei Y, Xu G, An Y, Qi Z, Lin Q, Lu J. Simultaneous FET-PET and contrast-enhanced MRI based on hybrid PET/MR improves delineation of tumor spatial biodistribution in gliomas: a biopsy validation study. Eur J Nucl Med Mol Imaging. 2020 Jun;47(6):1458-1467.
7. Shang K, Wang J, Fan X, et al. Clinical Value of Hybrid TOF-PET/MR Imaging–Based Multiparametric Imaging in Localizing Seizure Focus in Patients with MRI-Negative Temporal Lobe Epilepsy. AJNR Am J Neuroradiol. 2018 Oct;39(10):1791-1798.
A
Figure 1.
Contrast-enhanced (CE) MR and 18F-FET-PET performed before biopsy, FLAIR and CE-MR performed after biopsy, and hematoxylin and eosin (H&E) staining ( 400) of the biopsy samples. (A) A sample located in the region with increased FET-PET uptake and positive MR enhancement. H&E staining showed a cellular glioma corresponding to an astrocytoma of WHO grade II-III with higher local tumor cell density. (B) A sample located in a region with increased FET-PET uptake and negative MR enhancement. H&E staining showed a cellular glioma corresponding to diffuse astrocytoma of WHO grade II. (C) A sample located in a region with abnormal signal areas on FLAIR image that did not show increased FET-PET uptake and contrast enhancement. H&E staining showed this area contained normal brain tissue with a small amount of tumor cell infiltration.
B
Figure 1.
Contrast-enhanced (CE) MR and 18F-FET-PET performed before biopsy, FLAIR and CE-MR performed after biopsy, and hematoxylin and eosin (H&E) staining ( 400) of the biopsy samples. (A) A sample located in the region with increased FET-PET uptake and positive MR enhancement. H&E staining showed a cellular glioma corresponding to an astrocytoma of WHO grade II-III with higher local tumor cell density. (B) A sample located in a region with increased FET-PET uptake and negative MR enhancement. H&E staining showed a cellular glioma corresponding to diffuse astrocytoma of WHO grade II. (C) A sample located in a region with abnormal signal areas on FLAIR image that did not show increased FET-PET uptake and contrast enhancement. H&E staining showed this area contained normal brain tissue with a small amount of tumor cell infiltration.
C
Figure 1.
Contrast-enhanced (CE) MR and 18F-FET-PET performed before biopsy, FLAIR and CE-MR performed after biopsy, and hematoxylin and eosin (H&E) staining ( 400) of the biopsy samples. (A) A sample located in the region with increased FET-PET uptake and positive MR enhancement. H&E staining showed a cellular glioma corresponding to an astrocytoma of WHO grade II-III with higher local tumor cell density. (B) A sample located in a region with increased FET-PET uptake and negative MR enhancement. H&E staining showed a cellular glioma corresponding to diffuse astrocytoma of WHO grade II. (C) A sample located in a region with abnormal signal areas on FLAIR image that did not show increased FET-PET uptake and contrast enhancement. H&E staining showed this area contained normal brain tissue with a small amount of tumor cell infiltration.
A
Figure 2.
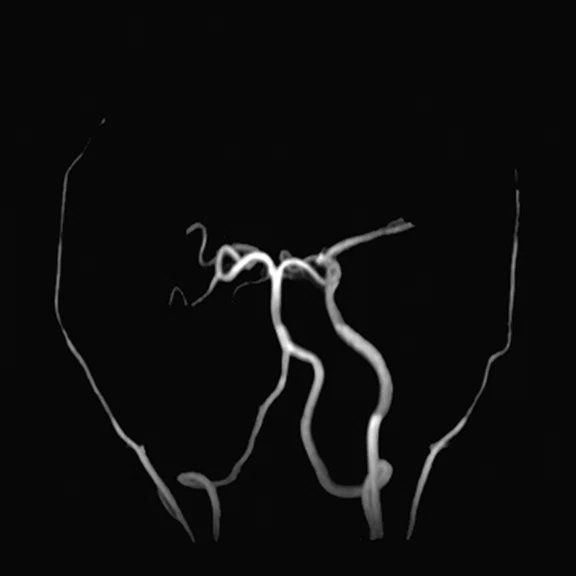
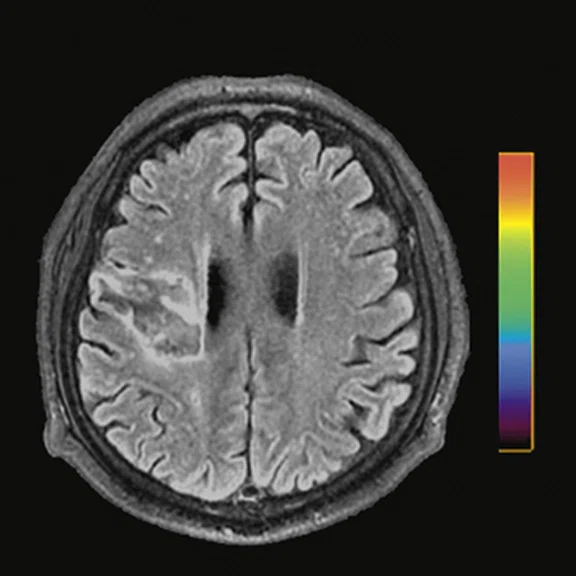
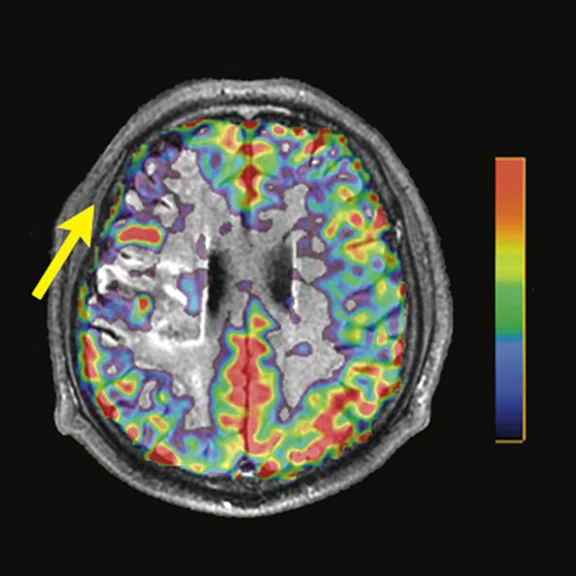
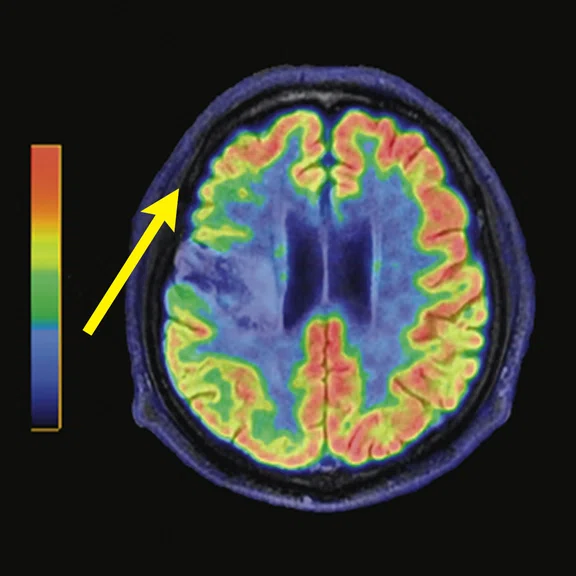
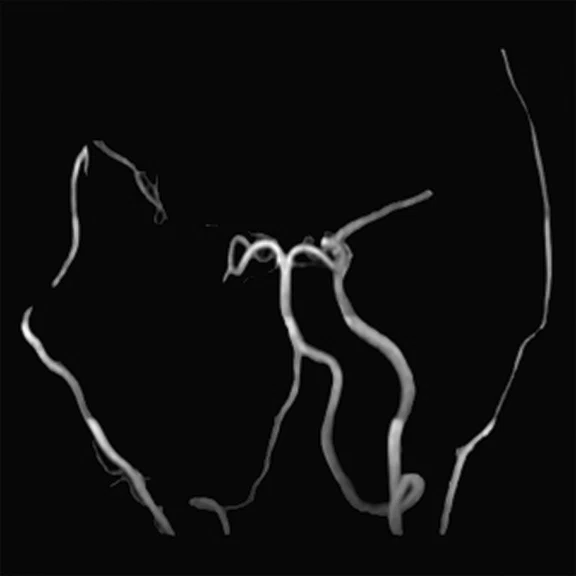
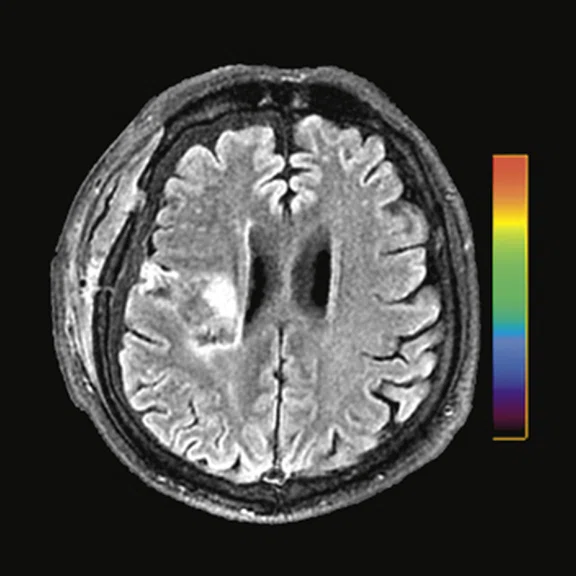
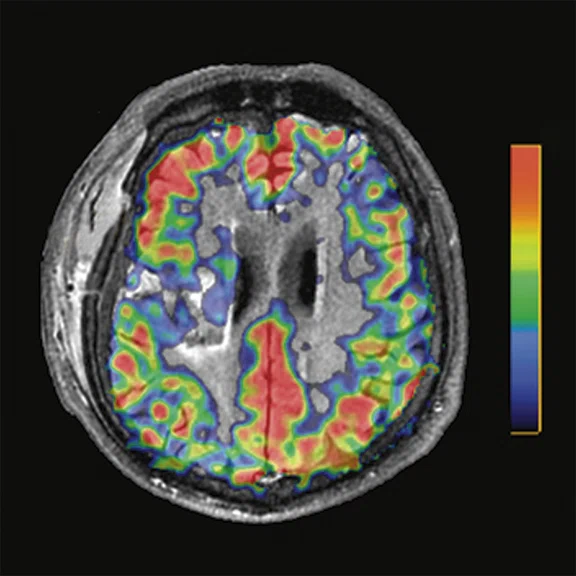
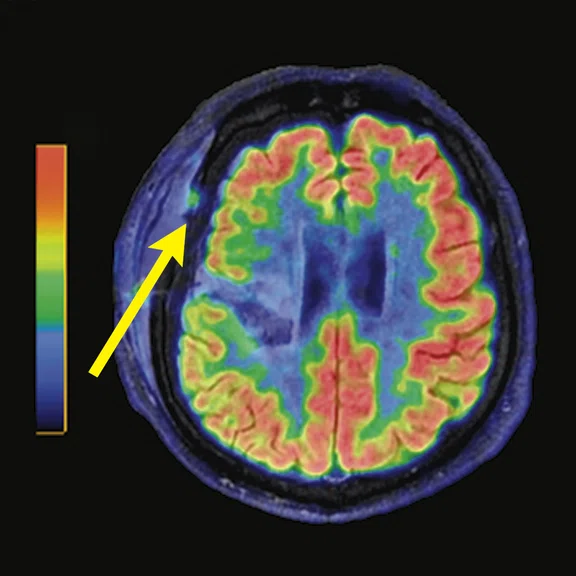
Representative pre-procedural and post-procedural images obtained in a 51-year-old man with symptomatic occlusion of the right ICA who underwent bypass surgery. (A) Preoperative MRA showed severe ICA occlusion, and (E) postoperative MRA showed an end-to-side anastomosis between the STA and MCA. (B, F) MRA T2 FLAIR images showed infarction in the left radial crown and corpus callosum. (G) Post-procedural fused CBF/MR image showed improvement compared to (C) the pre-procedural image on the affected side (short arrow). (H) Post-procedural fused 18F-FDG PET/MR image showed improvement compared to (D) the pre-procedural image on the ipsilateral side (long arrows).
B
Figure 2.
Representative pre-procedural and post-procedural images obtained in a 51-year-old man with symptomatic occlusion of the right ICA who underwent bypass surgery. (A) Preoperative MRA showed severe ICA occlusion, and (E) postoperative MRA showed an end-to-side anastomosis between the STA and MCA. (B, F) MRA T2 FLAIR images showed infarction in the left radial crown and corpus callosum. (G) Post-procedural fused CBF/MR image showed improvement compared to (C) the pre-procedural image on the affected side (short arrow). (H) Post-procedural fused 18F-FDG PET/MR image showed improvement compared to (D) the pre-procedural image on the ipsilateral side (long arrows).
C
Figure 2.
Representative pre-procedural and post-procedural images obtained in a 51-year-old man with symptomatic occlusion of the right ICA who underwent bypass surgery. (A) Preoperative MRA showed severe ICA occlusion, and (E) postoperative MRA showed an end-to-side anastomosis between the STA and MCA. (B, F) MRA T2 FLAIR images showed infarction in the left radial crown and corpus callosum. (G) Post-procedural fused CBF/MR image showed improvement compared to (C) the pre-procedural image on the affected side (short arrow). (H) Post-procedural fused 18F-FDG PET/MR image showed improvement compared to (D) the pre-procedural image on the ipsilateral side (long arrows).
D
Figure 2.
Representative pre-procedural and post-procedural images obtained in a 51-year-old man with symptomatic occlusion of the right ICA who underwent bypass surgery. (A) Preoperative MRA showed severe ICA occlusion, and (E) postoperative MRA showed an end-to-side anastomosis between the STA and MCA. (B, F) MRA T2 FLAIR images showed infarction in the left radial crown and corpus callosum. (G) Post-procedural fused CBF/MR image showed improvement compared to (C) the pre-procedural image on the affected side (short arrow). (H) Post-procedural fused 18F-FDG PET/MR image showed improvement compared to (D) the pre-procedural image on the ipsilateral side (long arrows).
E
Figure 2.
Representative pre-procedural and post-procedural images obtained in a 51-year-old man with symptomatic occlusion of the right ICA who underwent bypass surgery. (A) Preoperative MRA showed severe ICA occlusion, and (E) postoperative MRA showed an end-to-side anastomosis between the STA and MCA. (B, F) MRA T2 FLAIR images showed infarction in the left radial crown and corpus callosum. (G) Post-procedural fused CBF/MR image showed improvement compared to (C) the pre-procedural image on the affected side (short arrow). (H) Post-procedural fused 18F-FDG PET/MR image showed improvement compared to (D) the pre-procedural image on the ipsilateral side (long arrows).
F
Figure 2.
Representative pre-procedural and post-procedural images obtained in a 51-year-old man with symptomatic occlusion of the right ICA who underwent bypass surgery. (A) Preoperative MRA showed severe ICA occlusion, and (E) postoperative MRA showed an end-to-side anastomosis between the STA and MCA. (B, F) MRA T2 FLAIR images showed infarction in the left radial crown and corpus callosum. (G) Post-procedural fused CBF/MR image showed improvement compared to (C) the pre-procedural image on the affected side (short arrow). (H) Post-procedural fused 18F-FDG PET/MR image showed improvement compared to (D) the pre-procedural image on the ipsilateral side (long arrows).
G
Figure 2.
Representative pre-procedural and post-procedural images obtained in a 51-year-old man with symptomatic occlusion of the right ICA who underwent bypass surgery. (A) Preoperative MRA showed severe ICA occlusion, and (E) postoperative MRA showed an end-to-side anastomosis between the STA and MCA. (B, F) MRA T2 FLAIR images showed infarction in the left radial crown and corpus callosum. (G) Post-procedural fused CBF/MR image showed improvement compared to (C) the pre-procedural image on the affected side (short arrow). (H) Post-procedural fused 18F-FDG PET/MR image showed improvement compared to (D) the pre-procedural image on the ipsilateral side (long arrows).
H
Figure 2.
Representative pre-procedural and post-procedural images obtained in a 51-year-old man with symptomatic occlusion of the right ICA who underwent bypass surgery. (A) Preoperative MRA showed severe ICA occlusion, and (E) postoperative MRA showed an end-to-side anastomosis between the STA and MCA. (B, F) MRA T2 FLAIR images showed infarction in the left radial crown and corpus callosum. (G) Post-procedural fused CBF/MR image showed improvement compared to (C) the pre-procedural image on the affected side (short arrow). (H) Post-procedural fused 18F-FDG PET/MR image showed improvement compared to (D) the pre-procedural image on the ipsilateral side (long arrows).
A
Figure 3.
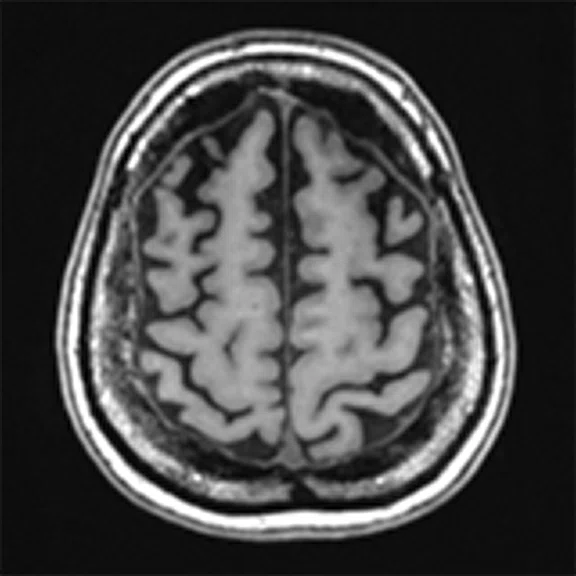
A 22-year-old woman with refractory focal epilepsy for 17 years. MR imaging (A) 3D T1 BRAVO, (B) axial T2 sequence, and (C) T2 FLAIR volume showed a left superior frontal gyrus cortical with questionable cortical thickening. (D) 18F-FDG PET imaging and (E) PET/MR imaging showed a slight diffuse hypometabolism and an especially focal area of hypo-metabolism in left superior frontal gyrus. The patient underwent surgery and pathology confirmed FCD I. Postsurgical follow-up Engel class I after one year.
B
Figure 3.
A 22-year-old woman with refractory focal epilepsy for 17 years. MR imaging (A) 3D T1 BRAVO, (B) axial T2 sequence, and (C) T2 FLAIR volume showed a left superior frontal gyrus cortical with questionable cortical thickening. (D) 18F-FDG PET imaging and (E) PET/MR imaging showed a slight diffuse hypometabolism and an especially focal area of hypo-metabolism in left superior frontal gyrus. The patient underwent surgery and pathology confirmed FCD I. Postsurgical follow-up Engel class I after one year.
C
Figure 3.
A 22-year-old woman with refractory focal epilepsy for 17 years. MR imaging (A) 3D T1 BRAVO, (B) axial T2 sequence, and (C) T2 FLAIR volume showed a left superior frontal gyrus cortical with questionable cortical thickening. (D) 18F-FDG PET imaging and (E) PET/MR imaging showed a slight diffuse hypometabolism and an especially focal area of hypo-metabolism in left superior frontal gyrus. The patient underwent surgery and pathology confirmed FCD I. Postsurgical follow-up Engel class I after one year.
D
Figure 3.
A 22-year-old woman with refractory focal epilepsy for 17 years. MR imaging (A) 3D T1 BRAVO, (B) axial T2 sequence, and (C) T2 FLAIR volume showed a left superior frontal gyrus cortical with questionable cortical thickening. (D) 18F-FDG PET imaging and (E) PET/MR imaging showed a slight diffuse hypometabolism and an especially focal area of hypo-metabolism in left superior frontal gyrus. The patient underwent surgery and pathology confirmed FCD I. Postsurgical follow-up Engel class I after one year.
E
Figure 3.
A 22-year-old woman with refractory focal epilepsy for 17 years. MR imaging (A) 3D T1 BRAVO, (B) axial T2 sequence, and (C) T2 FLAIR volume showed a left superior frontal gyrus cortical with questionable cortical thickening. (D) 18F-FDG PET imaging and (E) PET/MR imaging showed a slight diffuse hypometabolism and an especially focal area of hypo-metabolism in left superior frontal gyrus. The patient underwent surgery and pathology confirmed FCD I. Postsurgical follow-up Engel class I after one year.
8. Wang YH, An Y, Fan XT, et al. Comparison between simultaneously acquired arterial spin labeling and 18FFDG PET in mesial temporal lobe epilepsy assisted by a PET/MR system and SEEG. Neuroimage Clin. 2018;19:824-830.
9. Cui B, Zhang T, Ma Y, et al. Simultaneous PET-MRI imaging of cerebral blood flow and glucose metabolism in the symptomatic unilateral internal carotid artery/middle cerebral artery steno-occlusive disease. Eur J Nucl Med Mol Imaging. 2020;47(7):1668-1677.
10. Yan S, Zheng C, Cui B, et al. Multiparametric imaging hippocampal neurodegeneration and functional connectivity with simultaneous PET/MRI in Alzheimer’s disease. Eur J Nucl Med Mol Imaging. 2020;47(10):2440-2452.
A
Figure 4.
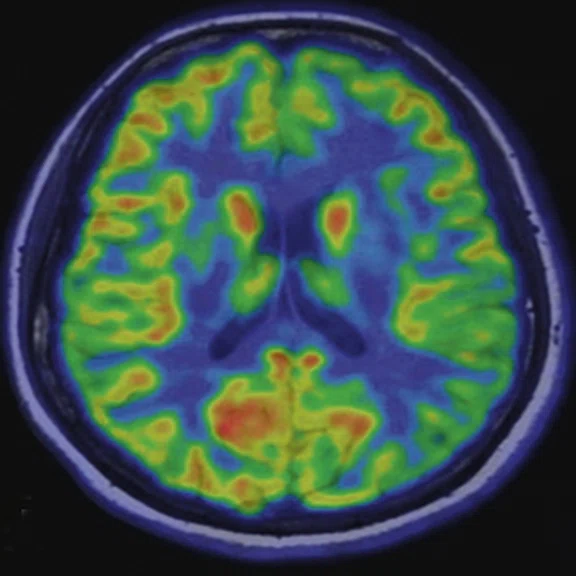
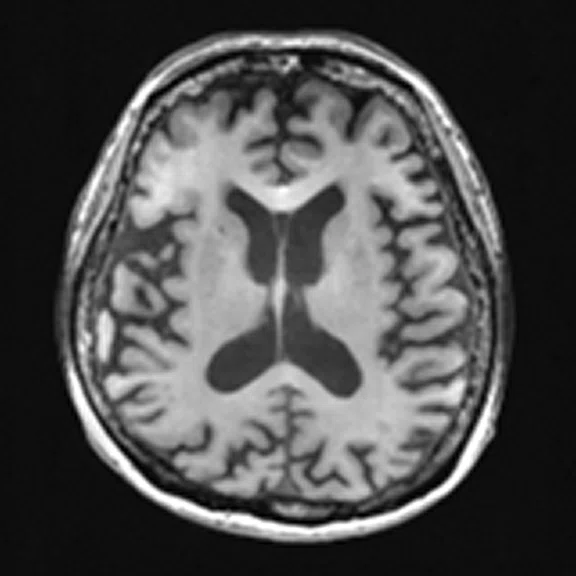
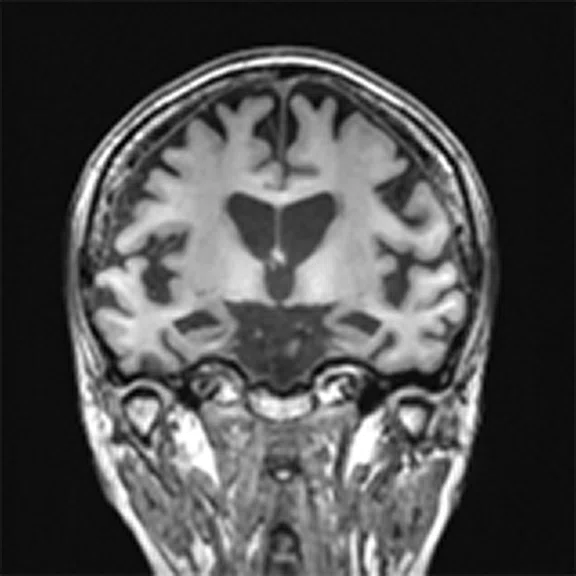
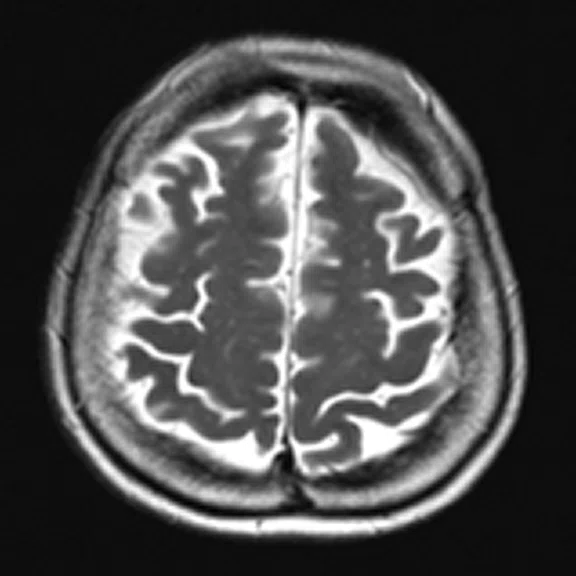
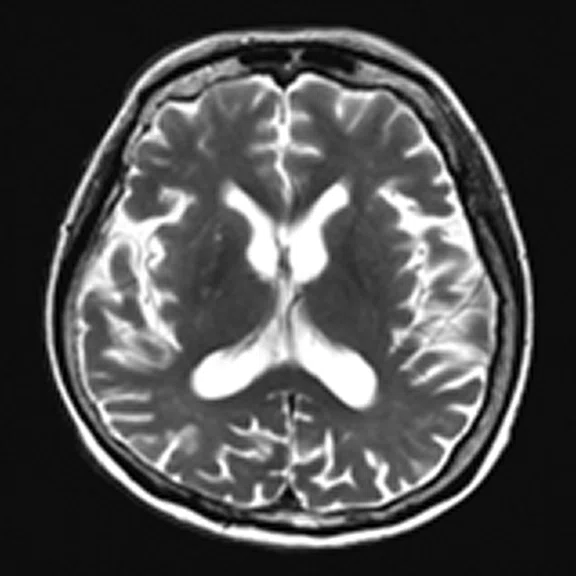
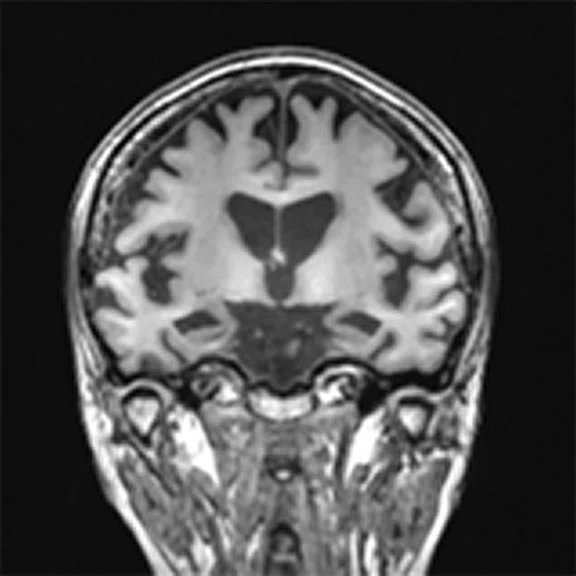
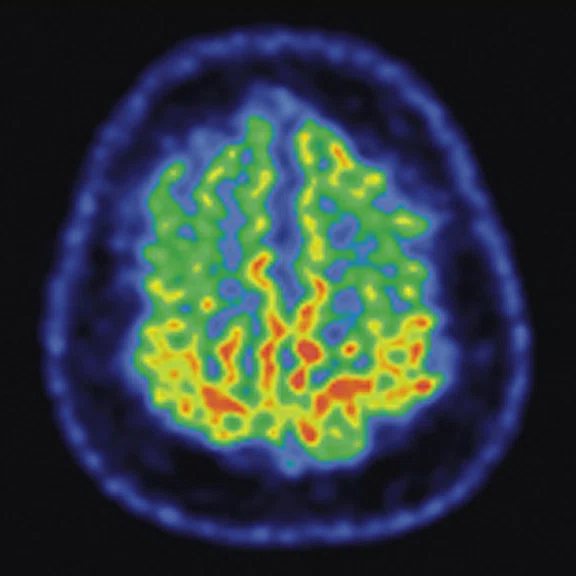
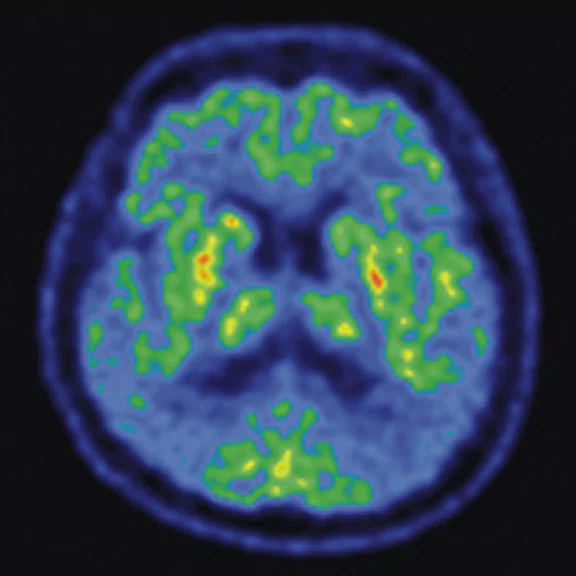
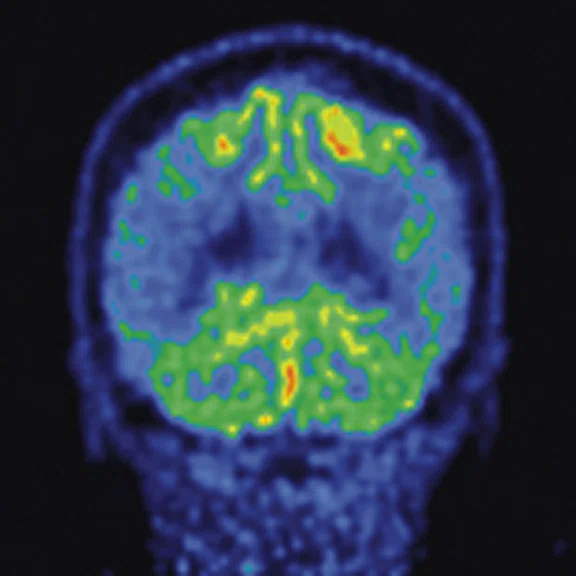
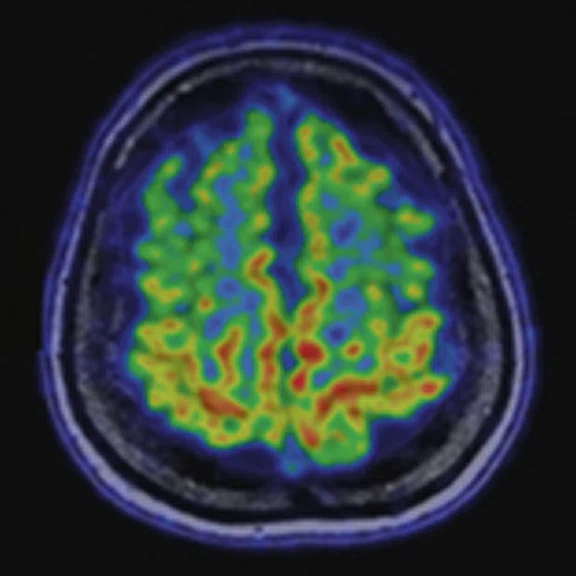
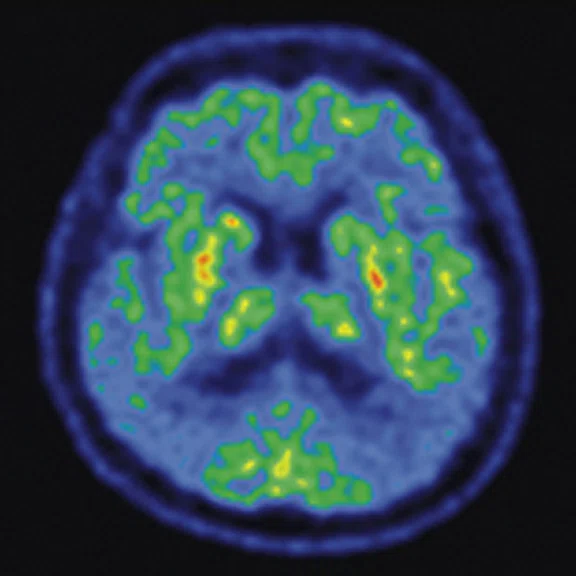
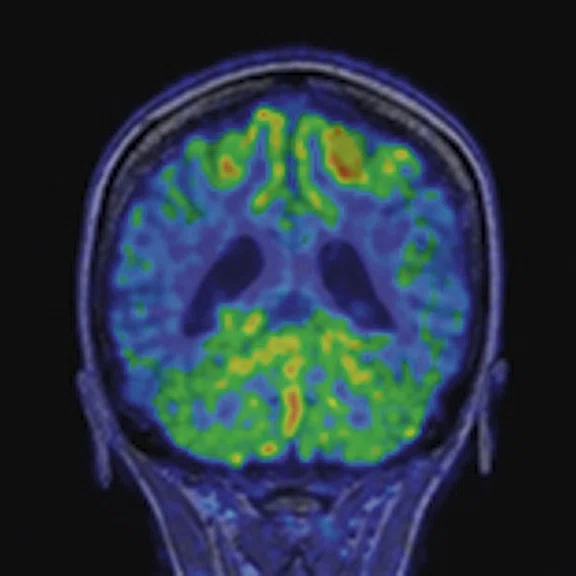
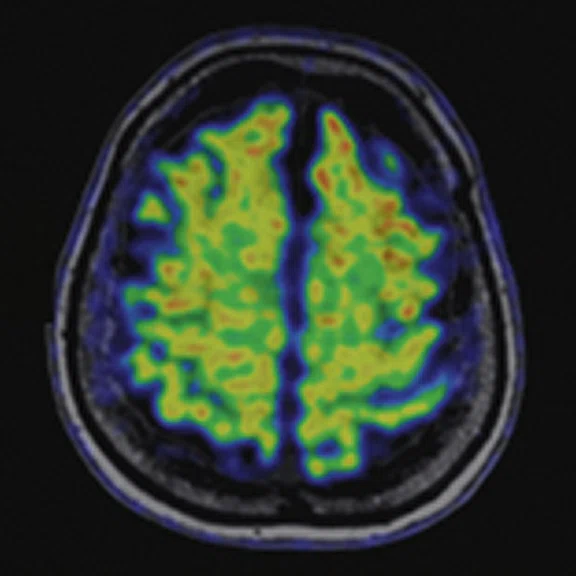
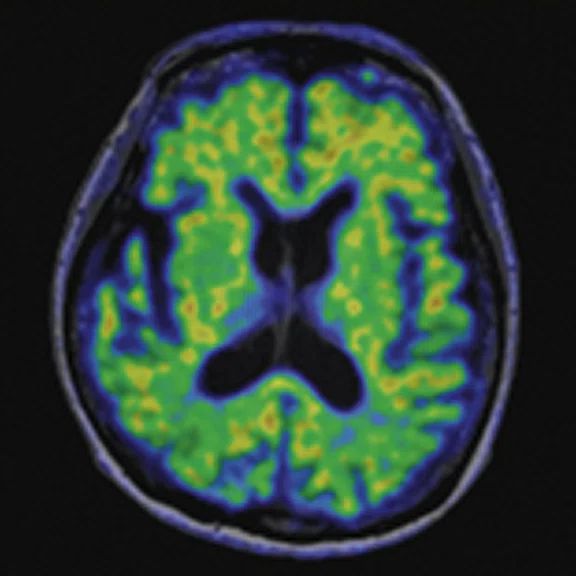
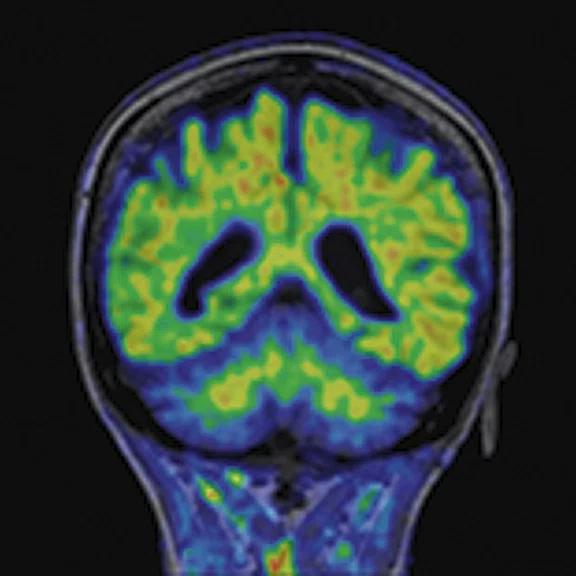
A 68-year-old woman with memory impairment for six years was diagnosed with severe Alzheimer’s disease. The neuropsychological tests showed that the MMSE score was 3, MoCA score was 2, and CDR score was 3. (A-C) MR imaging T1w and (D-F) T2w showed a global (overall) brain atrophy, particularly in the bilateral hippocampus. (G-I) 18F-FDG PET and (J-L) PET/MR imaging showed a diffuse hypometabolism in the bilateral frontal, temporoparietal and temporal cortex. Corresponding brain regions existed amyloid deposition in the (M-O) 18F-AV-45 MR.
B
Figure 4.
A 68-year-old woman with memory impairment for six years was diagnosed with severe Alzheimer’s disease. The neuropsychological tests showed that the MMSE score was 3, MoCA score was 2, and CDR score was 3. (A-C) MR imaging T1w and (D-F) T2w showed a global (overall) brain atrophy, particularly in the bilateral hippocampus. (G-I) 18F-FDG PET and (J-L) PET/MR imaging showed a diffuse hypometabolism in the bilateral frontal, temporoparietal and temporal cortex. Corresponding brain regions existed amyloid deposition in the (M-O) 18F-AV-45 MR.
C
Figure 4.
A 68-year-old woman with memory impairment for six years was diagnosed with severe Alzheimer’s disease. The neuropsychological tests showed that the MMSE score was 3, MoCA score was 2, and CDR score was 3. (A-C) MR imaging T1w and (D-F) T2w showed a global (overall) brain atrophy, particularly in the bilateral hippocampus. (G-I) 18F-FDG PET and (J-L) PET/MR imaging showed a diffuse hypometabolism in the bilateral frontal, temporoparietal and temporal cortex. Corresponding brain regions existed amyloid deposition in the (M-O) 18F-AV-45 MR.
D
Figure 4.
A 68-year-old woman with memory impairment for six years was diagnosed with severe Alzheimer’s disease. The neuropsychological tests showed that the MMSE score was 3, MoCA score was 2, and CDR score was 3. (A-C) MR imaging T1w and (D-F) T2w showed a global (overall) brain atrophy, particularly in the bilateral hippocampus. (G-I) 18F-FDG PET and (J-L) PET/MR imaging showed a diffuse hypometabolism in the bilateral frontal, temporoparietal and temporal cortex. Corresponding brain regions existed amyloid deposition in the (M-O) 18F-AV-45 MR.
E
Figure 4.
A 68-year-old woman with memory impairment for six years was diagnosed with severe Alzheimer’s disease. The neuropsychological tests showed that the MMSE score was 3, MoCA score was 2, and CDR score was 3. (A-C) MR imaging T1w and (D-F) T2w showed a global (overall) brain atrophy, particularly in the bilateral hippocampus. (G-I) 18F-FDG PET and (J-L) PET/MR imaging showed a diffuse hypometabolism in the bilateral frontal, temporoparietal and temporal cortex. Corresponding brain regions existed amyloid deposition in the (M-O) 18F-AV-45 MR.
F
Figure 4.
A 68-year-old woman with memory impairment for six years was diagnosed with severe Alzheimer’s disease. The neuropsychological tests showed that the MMSE score was 3, MoCA score was 2, and CDR score was 3. (A-C) MR imaging T1w and (D-F) T2w showed a global (overall) brain atrophy, particularly in the bilateral hippocampus. (G-I) 18F-FDG PET and (J-L) PET/MR imaging showed a diffuse hypometabolism in the bilateral frontal, temporoparietal and temporal cortex. Corresponding brain regions existed amyloid deposition in the (M-O) 18F-AV-45 MR.
G
Figure 4.
A 68-year-old woman with memory impairment for six years was diagnosed with severe Alzheimer’s disease. The neuropsychological tests showed that the MMSE score was 3, MoCA score was 2, and CDR score was 3. (A-C) MR imaging T1w and (D-F) T2w showed a global (overall) brain atrophy, particularly in the bilateral hippocampus. (G-I) 18F-FDG PET and (J-L) PET/MR imaging showed a diffuse hypometabolism in the bilateral frontal, temporoparietal and temporal cortex. Corresponding brain regions existed amyloid deposition in the (M-O) 18F-AV-45 MR.
H
Figure 4.
A 68-year-old woman with memory impairment for six years was diagnosed with severe Alzheimer’s disease. The neuropsychological tests showed that the MMSE score was 3, MoCA score was 2, and CDR score was 3. (A-C) MR imaging T1w and (D-F) T2w showed a global (overall) brain atrophy, particularly in the bilateral hippocampus. (G-I) 18F-FDG PET and (J-L) PET/MR imaging showed a diffuse hypometabolism in the bilateral frontal, temporoparietal and temporal cortex. Corresponding brain regions existed amyloid deposition in the (M-O) 18F-AV-45 MR.
I
Figure 4.
A 68-year-old woman with memory impairment for six years was diagnosed with severe Alzheimer’s disease. The neuropsychological tests showed that the MMSE score was 3, MoCA score was 2, and CDR score was 3. (A-C) MR imaging T1w and (D-F) T2w showed a global (overall) brain atrophy, particularly in the bilateral hippocampus. (G-I) 18F-FDG PET and (J-L) PET/MR imaging showed a diffuse hypometabolism in the bilateral frontal, temporoparietal and temporal cortex. Corresponding brain regions existed amyloid deposition in the (M-O) 18F-AV-45 MR.
J
Figure 4.
A 68-year-old woman with memory impairment for six years was diagnosed with severe Alzheimer’s disease. The neuropsychological tests showed that the MMSE score was 3, MoCA score was 2, and CDR score was 3. (A-C) MR imaging T1w and (D-F) T2w showed a global (overall) brain atrophy, particularly in the bilateral hippocampus. (G-I) 18F-FDG PET and (J-L) PET/MR imaging showed a diffuse hypometabolism in the bilateral frontal, temporoparietal and temporal cortex. Corresponding brain regions existed amyloid deposition in the (M-O) 18F-AV-45 MR.
K
Figure 4.
A 68-year-old woman with memory impairment for six years was diagnosed with severe Alzheimer’s disease. The neuropsychological tests showed that the MMSE score was 3, MoCA score was 2, and CDR score was 3. (A-C) MR imaging T1w and (D-F) T2w showed a global (overall) brain atrophy, particularly in the bilateral hippocampus. (G-I) 18F-FDG PET and (J-L) PET/MR imaging showed a diffuse hypometabolism in the bilateral frontal, temporoparietal and temporal cortex. Corresponding brain regions existed amyloid deposition in the (M-O) 18F-AV-45 MR.
L
Figure 4.
A 68-year-old woman with memory impairment for six years was diagnosed with severe Alzheimer’s disease. The neuropsychological tests showed that the MMSE score was 3, MoCA score was 2, and CDR score was 3. (A-C) MR imaging T1w and (D-F) T2w showed a global (overall) brain atrophy, particularly in the bilateral hippocampus. (G-I) 18F-FDG PET and (J-L) PET/MR imaging showed a diffuse hypometabolism in the bilateral frontal, temporoparietal and temporal cortex. Corresponding brain regions existed amyloid deposition in the (M-O) 18F-AV-45 MR.
M
Figure 4.
A 68-year-old woman with memory impairment for six years was diagnosed with severe Alzheimer’s disease. The neuropsychological tests showed that the MMSE score was 3, MoCA score was 2, and CDR score was 3. (A-C) MR imaging T1w and (D-F) T2w showed a global (overall) brain atrophy, particularly in the bilateral hippocampus. (G-I) 18F-FDG PET and (J-L) PET/MR imaging showed a diffuse hypometabolism in the bilateral frontal, temporoparietal and temporal cortex. Corresponding brain regions existed amyloid deposition in the (M-O) 18F-AV-45 MR.
N
Figure 4.
A 68-year-old woman with memory impairment for six years was diagnosed with severe Alzheimer’s disease. The neuropsychological tests showed that the MMSE score was 3, MoCA score was 2, and CDR score was 3. (A-C) MR imaging T1w and (D-F) T2w showed a global (overall) brain atrophy, particularly in the bilateral hippocampus. (G-I) 18F-FDG PET and (J-L) PET/MR imaging showed a diffuse hypometabolism in the bilateral frontal, temporoparietal and temporal cortex. Corresponding brain regions existed amyloid deposition in the (M-O) 18F-AV-45 MR.
O
Figure 4.
A 68-year-old woman with memory impairment for six years was diagnosed with severe Alzheimer’s disease. The neuropsychological tests showed that the MMSE score was 3, MoCA score was 2, and CDR score was 3. (A-C) MR imaging T1w and (D-F) T2w showed a global (overall) brain atrophy, particularly in the bilateral hippocampus. (G-I) 18F-FDG PET and (J-L) PET/MR imaging showed a diffuse hypometabolism in the bilateral frontal, temporoparietal and temporal cortex. Corresponding brain regions existed amyloid deposition in the (M-O) 18F-AV-45 MR.
10. Yan S, Zheng C, Cui B, et al. Multiparametric imaging hippocampal neurodegeneration and functional connectivity with simultaneous PET/MRI in Alzheimer’s disease. Eur J Nucl Med Mol Imaging. 2020;47(10):2440-2452.
result


2. Miles KA, Voo SA, Groves AM. Additional Clinical Value for PET/MRI in Oncology: Moving Beyond Simple Diagnosis. J Nucl Med. 2018 Jul;59(7):1028-1032. doi: 10.2967/jnumed.117.203612. Epub 2018 Mar 15. PMID: 29545379.
PREVIOUS
${prev-page}
NEXT
${next-page}
Subscribe Now
Manage Subscription
FOLLOW US
Contact Us • Cookie Preferences • Privacy Policy • California Privacy PolicyDo Not Sell or Share My Personal Information • Terms & Conditions • Security
© 2024 GE HealthCare. GE is a trademark of General Electric Company. Used under trademark license.
IN PRACTICE
Advancing the clinical utility of PET/MR in China is making a difference worldwide
Advancing the clinical utility of PET/MR in China is making a difference worldwide
Clinical adoption of PET/MR hybrid imaging technology is being driven by the perception of its superiority over PET/CT1 for several indications, particularly neurologic disease and disorders. The combination of PET’s specificity with the multi-parametric capabilities of MR2 and the ability to generate multiple quantitative images from a single examination2 is driving clinical adoption.
Clinical adoption of PET/MR hybrid imaging technology is being driven by the perception of its superiority over PET/CT1 for several indications, particularly neurologic disease and disorders. The combination of PET’s specificity with the multi-parametric capabilities of MR2 and the ability to generate multiple quantitative images from a single examination2 is driving clinical adoption.
Established in 1958, Xuanwu Hospital Capital Medical University is a leader in neurosciences and geriatrics/elder care in China with a focus on cerebrovascular, cardiovascular and neurodegenerative diseases. The departments of neurology and neurosurgery are recognized for their contributions to advancing clinical research throughout the country and the world.
As one of the first PET centers in China, the PET Center of Xuanwu Hospital is equipped with a plethora of advanced solutions, including one of the first SIGNA™ PET/MRs installed worldwide, as well as PET/CT, SPECT/CT, cyclotron, multiple pharmaceutical chemistry synthesis modules and different imaging post processing workstations. Xuanwu Hospital was issued China’s highest-level certificate for the development and use of radioactive tracers and drugs for both research and clinical use. The center also develops novel in-house tracers.
Given the leadership of Xuanwu Hospital in neurosciences and geriatrics, brain diseases such as Alzheimer’s disease, Parkinson’s disease, multiple sclerosis, epilepsy and brain tumors are a primary focus of the research and clinical activities. The aim is to combine structural and metabolic functional information obtained from the multi-modality imaging platforms to better understand the mechanism of different neurological diseases and further advance screening/diagnosis, treatment planning, prognosis prediction and overall disease management. Moreover, the collaboration between different multidiscipline teams is encouraged to support the translation of basic research to clinical application. At Xuanwu Hospital, more than 5,000 patients have been scanned on the SIGNA™ PET/MR, the majority for evaluation of neurological diseases, including epilepsy, cerebrovascular and neurodegenerative. The system has also been utilized for pelvic tumors and cardiovascular disease.
According to Professor Jie Lu, MD, PhD, Vice President of Xuanwu Hospital, Director of Radiology and Vice Director of the Nuclear Medicine Department, PET/MR has changed patient management and workflow.
"Compared to separate PET/CT and MR examinations, hybrid PET/MR in cases of brain tumors can acquire precise fused dual-modal imaging data with the structure, function and molecular metabolism information of suspected tumors in the same physiological state."
Professor Jie Lu
Since the two modalities are integrated, total scan and interpretations times are shorter, improving both patient comfort and diagnostic confidence.
PET/MR is now the imaging method of choice for epilepsy patients at Xuanwu Hospital. PET and MR images are acquired simultaneously, thus MR data can improve the anatomic localization of PET. This is particularly important for detecting the epileptogenic zone in patients prior to surgery or other invasive intervention.
While the use of PET/MR in neurologic applications is expected, Professor Lu adds that PET/MR can play an increasingly important role for patients with gynecological tumors by providing a one-stop, whole-body scan with improved soft tissue resolution and reduction in radiation.
Time-of-flight (TOF) imaging capabilities are a key factor in the clinical utility of whole-body PET/MR.
"The TOF technique may provide benefits in reducing imaging artifacts, such as ‘hot spots’ that exist in the sinuses, trachea and digestive tract during the whole-body examination of integrated PET/MR," Professor Lu says. "In addition to improving the PET/MR image quality, TOF could also improve image resolution and SNR to enhance detection of small lesions less than 10 mm3,4."
Q.Clear, GE’s unique reconstruction technology, assists in small lesion detection by improving image quality. Xuanwu Hospital is investigating its impact in the diagnosis of plaque inflammation, where initial results indicate excellent potential for accurate monitoring, as well as the evaluation of plaque instability5. The ZTE MR-based attenuation correction method also differentiates the SIGNA™ PET/MR and is used for brain studies. Q.Static is a PET motion correction that improves attenuation correction maps in the torso.
"We have found the ZTE technique is helpful for improving angiography while Q.Static motion correction reduces respiratory motion artifacts," Professor Lu adds. "Both technologies demonstrate improvement in PET image quality."
A research powerhouse
In a study evaluating the clinical value of hybrid 18F-fluoro-ethyl-tyrosine (FET) PET/MR in delineating tumor extent and guiding stereotactic biopsies in patients with glioma, clinical researchers at Xuanwu Hospital found that a larger extent of tumor spatial biodistribution was delineated by FET-PET than by contrast-enhanced MR based on histological confirmation. The spatial similarity between FET-PET and CE MRI was relatively low6.
"Our results highlight the importance of combining molecular metabolic imaging, such as FET-PET, and anatomic MR imaging before developing a treatment plan in glioma," Professor Lu explains.
In epileptic patients, TOF PET/MR multi-parametric imaging incorporating 3D ASL increased specificity in the epileptogenic zones in patients with MR-negative temporal lobe epilepsy (TLE)7. PET/MR also enabled exploring the relationship between resting-state energy consumption and functional activities in patients with mesial temporal lobe epilepsy (MTLE).
Figure 1.
Contrast-enhanced (CE) MR and 18F-FET-PET performed before biopsy, FLAIR and CE-MR performed after biopsy, and hematoxylin and eosin (H&E) staining ( 400) of the biopsy samples. (A) A sample located in the region with increased FET-PET uptake and positive MR enhancement. H&E staining showed a cellular glioma corresponding to an astrocytoma of WHO grade II-III with higher local tumor cell density. (B) A sample located in a region with increased FET-PET uptake and negative MR enhancement. H&E staining showed a cellular glioma corresponding to diffuse astrocytoma of WHO grade II. (C) A sample located in a region with abnormal signal areas on FLAIR image that did not show increased FET-PET uptake and contrast enhancement. H&E staining showed this area contained normal brain tissue with a small amount of tumor cell infiltration.
Figure 2.
Representative pre-procedural and post-procedural images obtained in a 51-year-old man with symptomatic occlusion of the right ICA who underwent bypass surgery. (A) Preoperative MRA showed severe ICA occlusion, and (E) postoperative MRA showed an end-to-side anastomosis between the STA and MCA. (B, F) MRA T2 FLAIR images showed infarction in the left radial crown and corpus callosum. (G) Post-procedural fused CBF/MR image showed improvement compared to (C) the pre-procedural image on the affected side (short arrow). (H) Post-procedural fused 18F-FDG PET/MR image showed improvement compared to (D) the pre-procedural image on the ipsilateral side (long arrows).
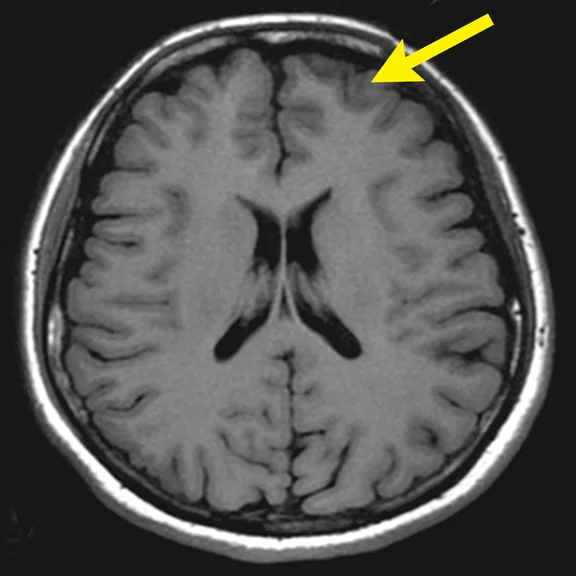
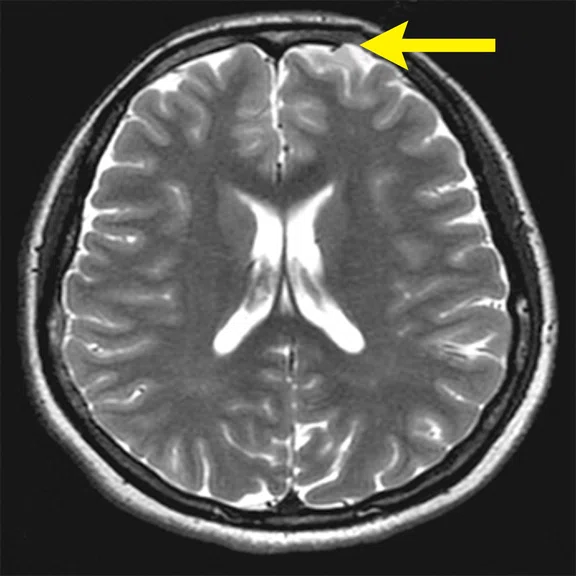
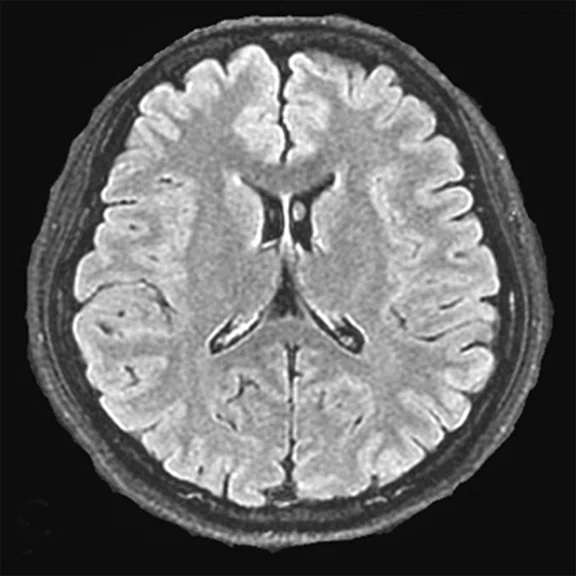
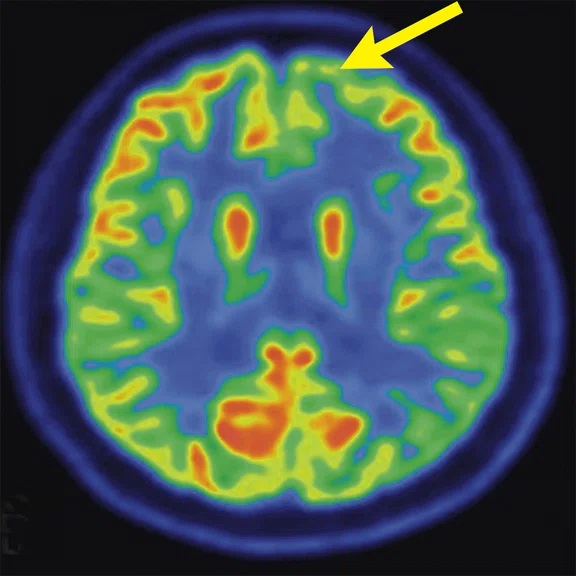
Figure 3.
A 22-year-old woman with refractory focal epilepsy for 17 years. MR imaging (A) 3D T1 BRAVO, (B) axial T2 sequence, and (C) T2 FLAIR volume showed a left superior frontal gyrus cortical with questionable cortical thickening. (D) 18F-FDG PET imaging and (E) PET/MR imaging showed a slight diffuse hypometabolism and an especially focal area of hypo-metabolism in left superior frontal gyrus. The patient underwent surgery and pathology confirmed FCD I. Postsurgical follow-up Engel class I after one year.
"Our research reported that spatial correlations between SUVR and fMRI derived metrics across gray matter were significantly higher in patients with MTLE hippocampal sclerosis compared with healthy controls. The higher fractional amplitude of low frequency fluctuations/SUVR couplings were found in patients who had the complete resolution of seizures after surgery than all others," Professor Lu adds8.
Another area where Xuanwu Hospital utilizes SIGNA™ PET/MR is for longitudinal studies on neurodegenerative and cerebrovascular disease patients. 3D ASL with PET/MR was used to evaluate 15 patients with ischemic cerebrovascular disease before and after superficial temporal artery to middle cerebral artery (STAMCA) bypass surgery. The study demonstrated that a combination of ASL and 18F-FDG PET could be used to simultaneously analyze changes in patients’ cerebral hemodynamic patterns and metabolism between, before and after surgery9.
The results, Professor Lu adds, suggest that this imaging data may be an essential tool for the evaluation of critical hemodynamic and metabolic status in patients with symptomatic unilateral ischemic cerebrovascular disease. Further, she is investigating with colleagues the role of PET/MR in the treatment planning of patients with cerebrovascular disease, especially those with chronic and symptomatically severe steno-occlusive disease of the internal carotid artery (ICA) or middle cerebral artery (MCA) in the same functional and physiological states.
Understanding the neurodegenerative mechanisms underlying Alzheimer’s disease (AD) and mild cognitive impairment (MCI) is another important area of research. At Xuanwu Hospital, 38 MCI, 22 AD and 42 normal controls underwent 18F-FDG PET/functional MR (fMRI) and high-resolution T1-weighted MR scans on the SIGNA™ PET/MR to clarify how neuronal function is impaired and contributes to the mechanisms underlying AD10.
Figure 4.
A 68-year-old woman with memory impairment for six years was diagnosed with severe Alzheimer’s disease. The neuropsychological tests showed that the MMSE score was 3, MoCA score was 2, and CDR score was 3. (A-C) MR imaging T1w and (D-F) T2w showed a global (overall) brain atrophy, particularly in the bilateral hippocampus. (G-I) 18F-FDG PET and (J-L) PET/MR imaging showed a diffuse hypometabolism in the bilateral frontal, temporoparietal and temporal cortex. Corresponding brain regions existed amyloid deposition in the (M-O) 18F-AV-45 MR.
"Our subregional hippocampal level analysis revealed hypometabolism, lower gray matter volume, aberrant functional connectivity in MCI and AD patients," Professor Lu explains. "In addition, the right cornu ammonis (CA1)-precauneus connectivity was related to the cognition in MCI patients, and the left CA2/3/dentate gyrus functional connectivity was correlated to hypometabolism in AD patients. Our findings demonstrate that associations existed at the subregional hippocampal level between the functional connectivity and neurodegeneration measured by simultaneous PET/MR10."
In addition to these studies, Professor Lu and colleagues at Xuanwu Hospital will be researching the value of hybrid 18F-FDG PET/MR in detection of early stage of endometrial cancer.
"Hybrid PET/MR provides the greatest benefit in multiple areas of new PET tracer development where high soft tissue contrast is needed, such as prostate and gynecological cancer," Professor Lu says. "In neurology, the unique advantage of this modality should be further explored by making use of the multi-parametric capability of MR. PET/MR delivers an important one-stop imaging technique for high-risk cancer patient screening and diagnosis. The application of it in pediatric imaging is also particularly appealing due to its ability to lower radiation dose."


