Figure 1.
Case 1 patient fat/iron data can be dragged and dropped right into the Hepatogram plus+ report.
Figure 2.
Case 1 patient MRE color maps and stiffness report are easily included in the Hepatogram plus+ report.
Figure 3.
Case 2 patient fat/iron data can be dragged and dropped right into the Hepatogram plus+ report.
Figure 4.
Case 2 patient MRE color maps and stiffness report are easily included in the Hepatogram plus+ report.


result
PREVIOUS
${prev-page}
NEXT
${next-page}
Subscribe Now
Manage Subscription
FOLLOW US
Contact Us • Cookie Preferences • Privacy Policy • California Privacy PolicyDo Not Sell or Share My Personal Information • Terms & Conditions • Security
© 2024 GE HealthCare. GE is a trademark of General Electric Company. Used under trademark license.

Randall Stenoien, MD
Houston Medical Imaging
Houston, TX
CASE STUDIES
An automated and consistent reporting solution for liver disease facilitates procedure growth
An automated and consistent reporting solution for liver disease facilitates procedure growth
By Randall Stenoien, MD, CEO and radiologist, Houston Medical Imaging, Houston, Texas
Randall Stenoien, MD
Houston Medical Imaging
Houston, TX
While biopsy has traditionally been used for diagnosing liver diseases such as NAFLD, NASH, fibrosis and cirrhosis, it is painful, expensive and can lead to complications. GE HealthCare’s MR elastography (MRE) solution, MR Touch, and IDEAL IQ for quantitative liver fat fraction/iron assessment provide valuable information to help physicians manage patients with these different liver diseases. Also, in our experience MRE is more specific than a FibroScan® exam.
MR Touch uses acoustic waves to identify variations in tissue stiffness, providing an Elastrogram that anatomically depicts the tissue stiffness of the liver. IDEAL IQ produces a volumetric fat-fraction map to visualize and quantify triglyceride fat content in the entire liver that is corrected for the R2 confounding factors. Together these non-invasive imaging tools provide additional information to help radiologists and gastroenterologists make informed decisions regarding a patient’s treatment.
Even with these technologies, many internists and gastroenterologists may not be familiar with non-invasive methods to diagnose liver disease, although awareness is growing among physicians. The recognition of how common this disease is and the long-term implications of not treating it is leading to more demand for MRE and IDEAL IQ imaging exams in our practice.
However, because MRE is not routinely performed, it can be challenging to obtain consistent and reproducible results. It’s not just the imaging acquisition, but also the reporting. With MRE and IDEAL IQ, the radiology report provides circles in the images denoting the area of concern and numbers that often don’t mean much to our referrers or their patients.
Now, with Hepatogram plus+, it is much easier to deliver consistent study results because these regions of interest and measurements are generated automatically. Additionally, we can add the rich content to our reports, further raising awareness and providing the information needed to manage patients with liver disease.
Hepatogram plus+ is a comprehensive reporting solution (Resoundant, Rochester, MN) that automates the MRE and proton density fat-fraction TX(PDFF) analyses by creating ROIs with the highest data reliability for each acquisition. It is designed to be a rapid, comprehensive snapshot of the most clinically actionable parameters and the essential workflow complement to MR Touch and IDEAL IQ, enabling fast and consistent analysis. This improved and quantitative workflow can greatly reduce inter-reader variability and exam time/costs.
Case 1
Patient History
A 40-year-old patient underwent MRE and IDEAL IQ for a liver evaluation.
Results
NASH with cirrhosis, confirmed with biopsy.
Case 2
Patient History
Patient previously underwent a FibroScan® exam that indicated Stage 3-4 fibrosis and was referred for MRE.
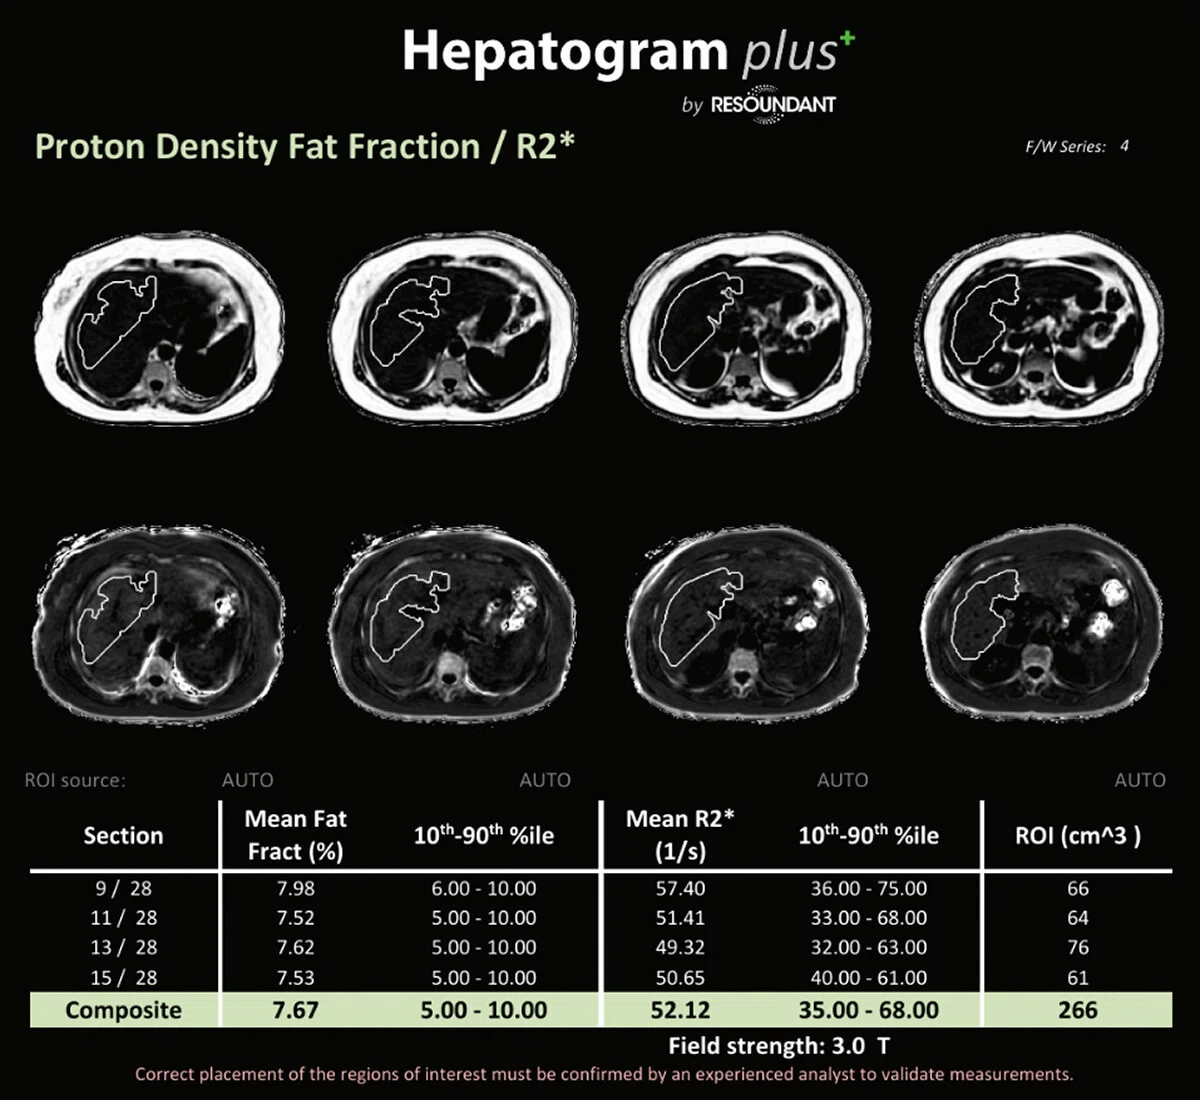
Figure 1.
Case 1 patient fat/iron data can be dragged and dropped right into the Hepatogram plus+ report.
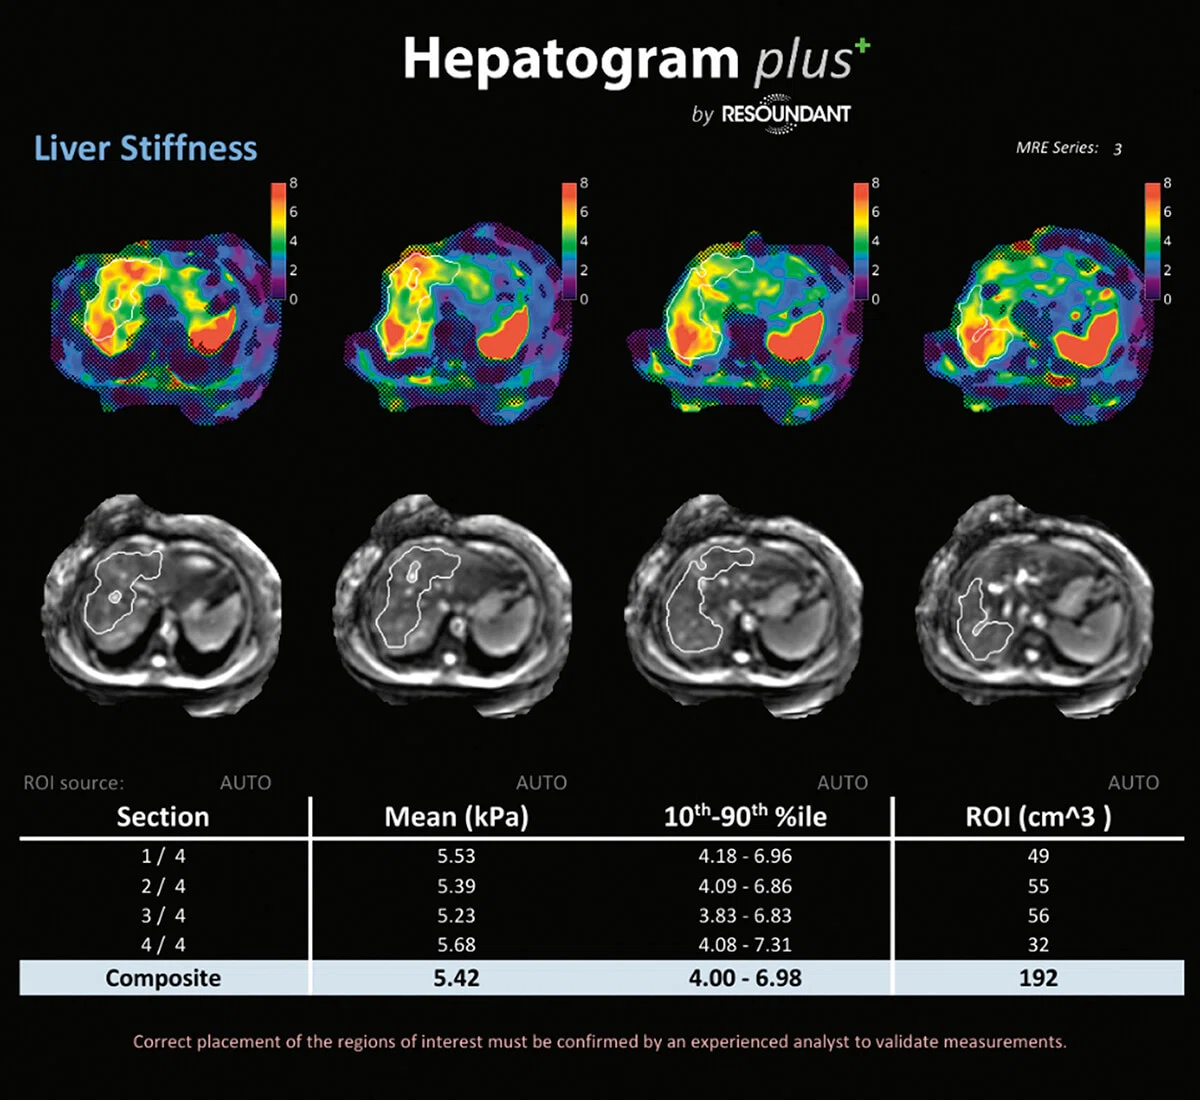
Figure 2.
Case 1 patient MRE color maps and stiffness report are easily included in the Hepatogram plus+ report.
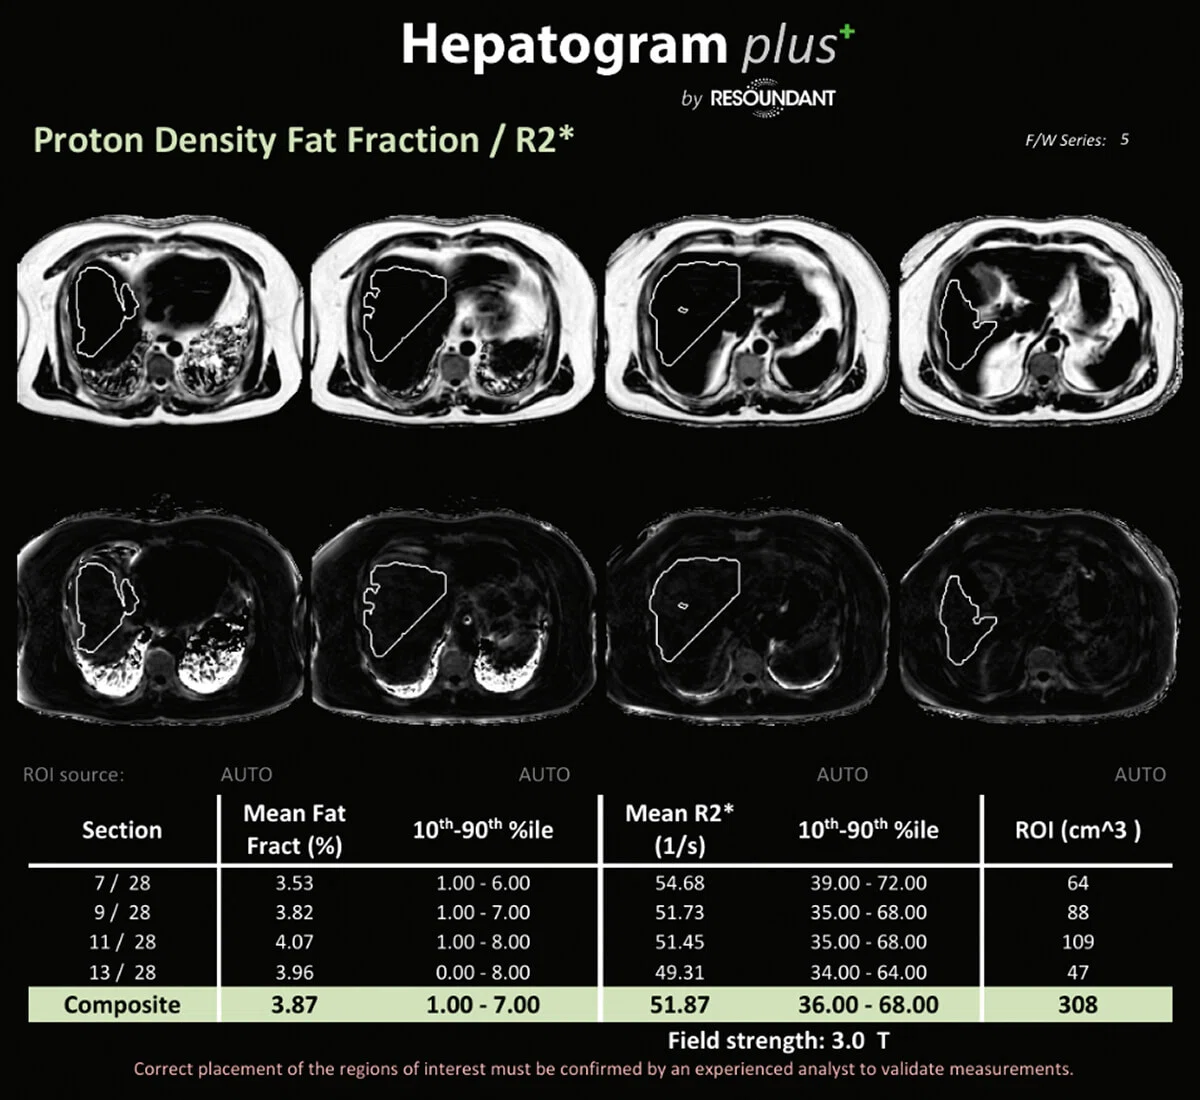
Figure 3.
Case 2 patient fat/iron data can be dragged and dropped right into the Hepatogram plus+ report.
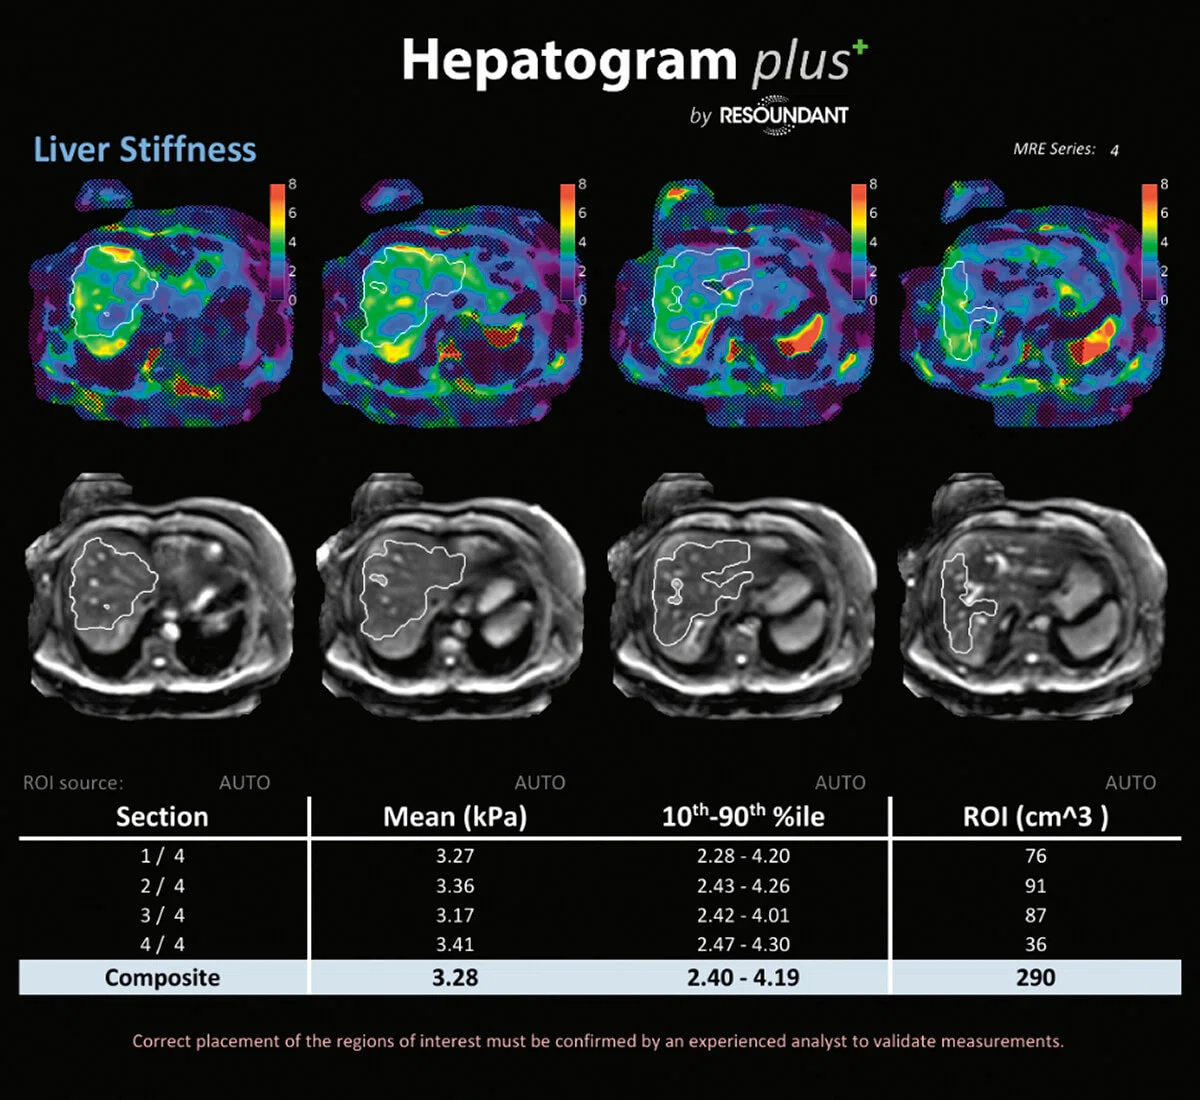
Figure 4.
Case 2 patient MRE color maps and stiffness report are easily included in the Hepatogram plus+ report.
Results
MRE exam indicated Stage 2-3 fibrosis.
Discussion
The implementation of Hepatogram plus+ has automated our MRE and IDEAL IQ reporting and made it easier to process the exam. Now, with the auto processing capability available in Hepatogram plus+, our results are more consistent with less variability.
The ability to drag and drop images into the report provides the referrer with more visual information to educate the patient. The images can also help the patient see the effect of behavior modification, which may be most impactful for improving their condition or, minimally, preventing further progression.
With tools such as MRE, IDEAL IQ and Hepatogram plus+, the level of awareness is increasing among other physicians and we expect this trend to continue as liver disease rates rise. Armed with tools such as Hepatogram plus+, our practice will be well positioned to accommodate a growth in referrals for hepatic fibrosis evaluations.