


result
1. Barrio JR, Small GW, Wong KP, et al. In vivo characterization of chronic traumatic encephalopathy using [F-18]FDDNP PET brain imaging. Proc Natl Acad Sci U S A. 2015 Apr 21;112(16):E2039-47.
4. Jordan BD. The clinical spectrum of sport-related traumatic brain injury. Nat Rev Neurol. 2013 Apr;9(4):222-30. doi: 10.1038/nrneurol.2013.33.
6. McKee AC, Cairns NJ, Dickson DW, et al; TBI/CTE group. The first NINDS/NIBIB consensus meeting to define neuropathological criteria for the diagnosis of chronic traumatic encephalopathy. Acta Neuropathol. 2016 Jan;131(1):75-86. doi: 10.1007/s00401-015-1515-z.s00401-015-1515-z.
7. Giza CC, Hovda DA. The new neurometabolic cascade of concussion. Neurosurgery. 2014 Oct;75 Suppl 4(0 4):S24-33. doi: 10.1227/NEU.0000000000000505.
8. Blennow K, Brody DL, Kochanek PM, et al. Traumatic brain injuries. Nat Rev Dis Primers. 2016 Nov 17;2:16084. doi: 10.1038/nrdp.2016.84.
5. Cloots RJ, Gervaise HM, van Dommelen JA, Geers MG. Biomechanics of traumatic brain injury: influences of the morphologic heterogeneities of the cerebral cortex. Ann Biomed Eng. 2008 Jul;36(7):1203-15. doi: 10.1007/s10439-008-9510-3.
8. Blennow K, Brody DL, Kochanek PM, et al. Traumatic brain injuries. Nat Rev Dis Primers. 2016 Nov 17;2:16084. doi: 10.1038/nrdp.2016.84.
1. Barrio JR, Small GW, Wong KP, et al. In vivo characterization of chronic traumatic encephalopathy using [F-18]FDDNP PET brain imaging. Proc Natl Acad Sci U S A. 2015 Apr 21;112(16):E2039-47.
8. Blennow K, Brody DL, Kochanek PM, et al. Traumatic brain injuries. Nat Rev Dis Primers. 2016 Nov 17;2:16084. doi: 10.1038/nrdp.2016.84.
9. Turk KW, Budson AE. Chronic Traumatic Encephalopathy. Continuum (Minneap Minn). 2019 Feb;25(1):187-207. doi: 10.1212/CON.0000000000000686.
A
Figure 1.
Mapping the CTE disease process using PET/MR.
A
Figure 2.
Case 1. A 63-year-old retired soccer player exposed to repetitive head impacts related to sports practice with probable CTE. (A-C) 18F-FDG PET images show hypometabolism in the right cerebellar hemisphere and the left neocortical, polar, and medial temporal regions (white arrows). Individual Z-score maps of the 18F-FDG PET images (Cortex ID Suite) projected on the (G, H) T2w MR highlights the hypometabolic areas. T2w MR also shows septal fenestrations and presence of cavum septum pellucidum (red arrows), an enlargement of cortical sulci in the left temporal and peri-insular regions related to brain atrophy (yellow arrows), as well as volumetric reductions of the left hippocampus and entorhinal cortex. (I) T2w FLAIR images did not show remarkable signs of microangiopathy. (D-F) 18F-FDG-PET Z-score map (T2w MR projection).
B
Figure 2.
Case 1. A 63-year-old retired soccer player exposed to repetitive head impacts related to sports practice with probable CTE. (A-C) 18F-FDG PET images show hypometabolism in the right cerebellar hemisphere and the left neocortical, polar, and medial temporal regions (white arrows). Individual Z-score maps of the 18F-FDG PET images (Cortex ID Suite) projected on the (G, H) T2w MR highlights the hypometabolic areas. T2w MR also shows septal fenestrations and presence of cavum septum pellucidum (red arrows), an enlargement of cortical sulci in the left temporal and peri-insular regions related to brain atrophy (yellow arrows), as well as volumetric reductions of the left hippocampus and entorhinal cortex. (I) T2w FLAIR images did not show remarkable signs of microangiopathy. (D-F) 18F-FDG-PET Z-score map (T2w MR projection).
C
Figure 2.
Case 1. A 63-year-old retired soccer player exposed to repetitive head impacts related to sports practice with probable CTE. (A-C) 18F-FDG PET images show hypometabolism in the right cerebellar hemisphere and the left neocortical, polar, and medial temporal regions (white arrows). Individual Z-score maps of the 18F-FDG PET images (Cortex ID Suite) projected on the (G, H) T2w MR highlights the hypometabolic areas. T2w MR also shows septal fenestrations and presence of cavum septum pellucidum (red arrows), an enlargement of cortical sulci in the left temporal and peri-insular regions related to brain atrophy (yellow arrows), as well as volumetric reductions of the left hippocampus and entorhinal cortex. (I) T2w FLAIR images did not show remarkable signs of microangiopathy. (D-F) 18F-FDG-PET Z-score map (T2w MR projection).
D
Figure 2.
Case 1. A 63-year-old retired soccer player exposed to repetitive head impacts related to sports practice with probable CTE. (A-C) 18F-FDG PET images show hypometabolism in the right cerebellar hemisphere and the left neocortical, polar, and medial temporal regions (white arrows). Individual Z-score maps of the 18F-FDG PET images (Cortex ID Suite) projected on the (G, H) T2w MR highlights the hypometabolic areas. T2w MR also shows septal fenestrations and presence of cavum septum pellucidum (red arrows), an enlargement of cortical sulci in the left temporal and peri-insular regions related to brain atrophy (yellow arrows), as well as volumetric reductions of the left hippocampus and entorhinal cortex. (I) T2w FLAIR images did not show remarkable signs of microangiopathy. (D-F) 18F-FDG-PET Z-score map (T2w MR projection).
E
Figure 2.
Case 1. A 63-year-old retired soccer player exposed to repetitive head impacts related to sports practice with probable CTE. (A-C) 18F-FDG PET images show hypometabolism in the right cerebellar hemisphere and the left neocortical, polar, and medial temporal regions (white arrows). Individual Z-score maps of the 18F-FDG PET images (Cortex ID Suite) projected on the (G, H) T2w MR highlights the hypometabolic areas. T2w MR also shows septal fenestrations and presence of cavum septum pellucidum (red arrows), an enlargement of cortical sulci in the left temporal and peri-insular regions related to brain atrophy (yellow arrows), as well as volumetric reductions of the left hippocampus and entorhinal cortex. (I) T2w FLAIR images did not show remarkable signs of microangiopathy. (D-F) 18F-FDG-PET Z-score map (T2w MR projection).
F
Figure 2.
Case 1. A 63-year-old retired soccer player exposed to repetitive head impacts related to sports practice with probable CTE. (A-C) 18F-FDG PET images show hypometabolism in the right cerebellar hemisphere and the left neocortical, polar, and medial temporal regions (white arrows). Individual Z-score maps of the 18F-FDG PET images (Cortex ID Suite) projected on the (G, H) T2w MR highlights the hypometabolic areas. T2w MR also shows septal fenestrations and presence of cavum septum pellucidum (red arrows), an enlargement of cortical sulci in the left temporal and peri-insular regions related to brain atrophy (yellow arrows), as well as volumetric reductions of the left hippocampus and entorhinal cortex. (I) T2w FLAIR images did not show remarkable signs of microangiopathy. (D-F) 18F-FDG-PET Z-score map (T2w MR projection).
G
Figure 2.
Case 1. A 63-year-old retired soccer player exposed to repetitive head impacts related to sports practice with probable CTE. (A-C) 18F-FDG PET images show hypometabolism in the right cerebellar hemisphere and the left neocortical, polar, and medial temporal regions (white arrows). Individual Z-score maps of the 18F-FDG PET images (Cortex ID Suite) projected on the (G, H) T2w MR highlights the hypometabolic areas. T2w MR also shows septal fenestrations and presence of cavum septum pellucidum (red arrows), an enlargement of cortical sulci in the left temporal and peri-insular regions related to brain atrophy (yellow arrows), as well as volumetric reductions of the left hippocampus and entorhinal cortex. (I) T2w FLAIR images did not show remarkable signs of microangiopathy. (D-F) 18F-FDG-PET Z-score map (T2w MR projection).
H
Figure 2.
Case 1. A 63-year-old retired soccer player exposed to repetitive head impacts related to sports practice with probable CTE. (A-C) 18F-FDG PET images show hypometabolism in the right cerebellar hemisphere and the left neocortical, polar, and medial temporal regions (white arrows). Individual Z-score maps of the 18F-FDG PET images (Cortex ID Suite) projected on the (G, H) T2w MR highlights the hypometabolic areas. T2w MR also shows septal fenestrations and presence of cavum septum pellucidum (red arrows), an enlargement of cortical sulci in the left temporal and peri-insular regions related to brain atrophy (yellow arrows), as well as volumetric reductions of the left hippocampus and entorhinal cortex. (I) T2w FLAIR images did not show remarkable signs of microangiopathy. (D-F) 18F-FDG-PET Z-score map (T2w MR projection).
I
Figure 2.
Case 1. A 63-year-old retired soccer player exposed to repetitive head impacts related to sports practice with probable CTE. (A-C) 18F-FDG PET images show hypometabolism in the right cerebellar hemisphere and the left neocortical, polar, and medial temporal regions (white arrows). Individual Z-score maps of the 18F-FDG PET images (Cortex ID Suite) projected on the (G, H) T2w MR highlights the hypometabolic areas. T2w MR also shows septal fenestrations and presence of cavum septum pellucidum (red arrows), an enlargement of cortical sulci in the left temporal and peri-insular regions related to brain atrophy (yellow arrows), as well as volumetric reductions of the left hippocampus and entorhinal cortex. (I) T2w FLAIR images did not show remarkable signs of microangiopathy. (D-F) 18F-FDG-PET Z-score map (T2w MR projection).
E
Figure 3.
Case 2. A 58-year-old retired boxer with possible CTE. (A, B) 18F-FDG PET images show mild to moderate hypometabolism in the bilateral prefrontal and opercular frontal regions, worse on the right side (white arrows). (C, D) Individual Z-score maps of the 18F-FDG PET images (Cortex ID Suite) projected on the T2w MR surface highlights the hypometabolic areas compared to a database of healthy individuals paired by age. (E) T1w and (F) T2w MR show septal fenestrations and presence of cavum septum pellucidum (red arrows), enlarged cortical sulci in both frontal lobes and open longitudinal fissure in the frontal region (yellow arrows). (G) T2w FLAIR MR did not show remarkable signs of microangiopathy .
F
Figure 3.
Case 2. A 58-year-old retired boxer with possible CTE. (A, B) 18F-FDG PET images show mild to moderate hypometabolism in the bilateral prefrontal and opercular frontal regions, worse on the right side (white arrows). (C, D) Individual Z-score maps of the 18F-FDG PET images (Cortex ID Suite) projected on the T2w MR surface highlights the hypometabolic areas compared to a database of healthy individuals paired by age. (E) T1w and (F) T2w MR show septal fenestrations and presence of cavum septum pellucidum (red arrows), enlarged cortical sulci in both frontal lobes and open longitudinal fissure in the frontal region (yellow arrows). (G) T2w FLAIR MR did not show remarkable signs of microangiopathy .
G
Figure 3.
Case 2. A 58-year-old retired boxer with possible CTE. (A, B) 18F-FDG PET images show mild to moderate hypometabolism in the bilateral prefrontal and opercular frontal regions, worse on the right side (white arrows). (C, D) Individual Z-score maps of the 18F-FDG PET images (Cortex ID Suite) projected on the T2w MR surface highlights the hypometabolic areas compared to a database of healthy individuals paired by age. (E) T1w and (F) T2w MR show septal fenestrations and presence of cavum septum pellucidum (red arrows), enlarged cortical sulci in both frontal lobes and open longitudinal fissure in the frontal region (yellow arrows). (G) T2w FLAIR MR did not show remarkable signs of microangiopathy .
A
Figure 3.
Case 2. A 58-year-old retired boxer with possible CTE. (A, B) 18F-FDG PET images show mild to moderate hypometabolism in the bilateral prefrontal and opercular frontal regions, worse on the right side (white arrows). (C, D) Individual Z-score maps of the 18F-FDG PET images (Cortex ID Suite) projected on the T2w MR surface highlights the hypometabolic areas compared to a database of healthy individuals paired by age. (E) T1w and (F) T2w MR show septal fenestrations and presence of cavum septum pellucidum (red arrows), enlarged cortical sulci in both frontal lobes and open longitudinal fissure in the frontal region (yellow arrows). (G) T2w FLAIR MR did not show remarkable signs of microangiopathy .
B
Figure 3.
Case 2. A 58-year-old retired boxer with possible CTE. (A, B) 18F-FDG PET images show mild to moderate hypometabolism in the bilateral prefrontal and opercular frontal regions, worse on the right side (white arrows). (C, D) Individual Z-score maps of the 18F-FDG PET images (Cortex ID Suite) projected on the T2w MR surface highlights the hypometabolic areas compared to a database of healthy individuals paired by age. (E) T1w and (F) T2w MR show septal fenestrations and presence of cavum septum pellucidum (red arrows), enlarged cortical sulci in both frontal lobes and open longitudinal fissure in the frontal region (yellow arrows). (G) T2w FLAIR MR did not show remarkable signs of microangiopathy .
C
Figure 3.
Case 2. A 58-year-old retired boxer with possible CTE. (A, B) 18F-FDG PET images show mild to moderate hypometabolism in the bilateral prefrontal and opercular frontal regions, worse on the right side (white arrows). (C, D) Individual Z-score maps of the 18F-FDG PET images (Cortex ID Suite) projected on the T2w MR surface highlights the hypometabolic areas compared to a database of healthy individuals paired by age. (E) T1w and (F) T2w MR show septal fenestrations and presence of cavum septum pellucidum (red arrows), enlarged cortical sulci in both frontal lobes and open longitudinal fissure in the frontal region (yellow arrows). (G) T2w FLAIR MR did not show remarkable signs of microangiopathy .
D
Figure 3.
Case 2. A 58-year-old retired boxer with possible CTE. (A, B) 18F-FDG PET images show mild to moderate hypometabolism in the bilateral prefrontal and opercular frontal regions, worse on the right side (white arrows). (C, D) Individual Z-score maps of the 18F-FDG PET images (Cortex ID Suite) projected on the T2w MR surface highlights the hypometabolic areas compared to a database of healthy individuals paired by age. (E) T1w and (F) T2w MR show septal fenestrations and presence of cavum septum pellucidum (red arrows), enlarged cortical sulci in both frontal lobes and open longitudinal fissure in the frontal region (yellow arrows). (G) T2w FLAIR MR did not show remarkable signs of microangiopathy .
PREVIOUS
${prev-page}
NEXT
${next-page}
Subscribe Now
Manage Subscription
FOLLOW US
Contact Us • Cookie Preferences • Privacy Policy • California Privacy PolicyDo Not Sell or Share My Personal Information • Terms & Conditions • Security
© 2024 GE HealthCare. GE is a trademark of General Electric Company. Used under trademark license.

Artur Martins N. Coutinho, MD, PhD
Hospital das Clinicas, Insitute of Radiology Nuclear Medicine Center, University of São Paulo
São Paulo, Brazil

Mateus Rozalem Aranha, MD
Hospital das Clinicas, Insitute of Radiology Nuclear Medicine Center, University of São Paulo
São Paulo, Brazil
IN PRACTICE
Combined PET/MR imaging in suspected CTE patients
Combined PET/MR imaging in suspected CTE patients
by Artur Martins N. Coutinho, MD, PhD, nuclear medicine physician, and Mateus Rozalem Aranha, MD, PhD candidate, neuroradiologist, Hospital das Clinicas, Insitute of Radiology, Nuclear Medicine Center, University of São Paulo, São Paulo, Brazil

Artur Martins N. Coutinho, MD, PhD
Hospital das Clinicas, Insitute of Radiology Nuclear Medicine Center, University of São Paulo São Paulo, Brazil

Mateus Rozalem Aranha, MD
Hospital das Clinicas, Insitute of Radiology Nuclear Medicine Center, University of São Paulo
São Paulo, Brazil
Chronic traumatic encephalopathy (CTE) is a neurodegenerative disease related to repetitive head impacts. First described in 1928 by Harrison Martland, MD, as “punch drunk syndrome” in a group of boxers, much of what is known today about CTE is from the research of Ann McKee, MD, Professor of Neurology and Pathology at Boston University, Director of Neuropathology Care for VA Boston and Director of the BU CTE Center.
Chronic traumatic encephalopathy (CTE) is a neurodegenerative disease related to repetitive head impacts. First described in 1928 by Harrison Martland, MD, as “punch drunk syndrome” in a group of boxers, much of what is known today about CTE is from the research of Ann McKee, MD, Professor of Neurology and Pathology at Boston University, Director of Neuropathology Care for VA Boston and Director of the BU CTE Center.
CTE results from repetitive concussive and subconcussive traumas and the symptoms are more related to mood disorders and behavioral changes than cognitive decline alone, although some patients present with amnestic symptoms. Typical neuropathological findings in CTE are the result of the deposition of phosphorylated tau aggregates in perivascular neurons and astrocytes at the depth of cortical sulci, which spreads throughout different brain regions according to disease stage. A 18F-FDDNP-PET study by Barrio et al. has shown that, in CTE, tau deposition starts at the brain stem and spreads to limbic structures, while in Alzheimer’s disease it is always combined with amyloid plaques, and starts at the entorhinal cortex and later, spreading to cortical regions forming the default-mode network1.
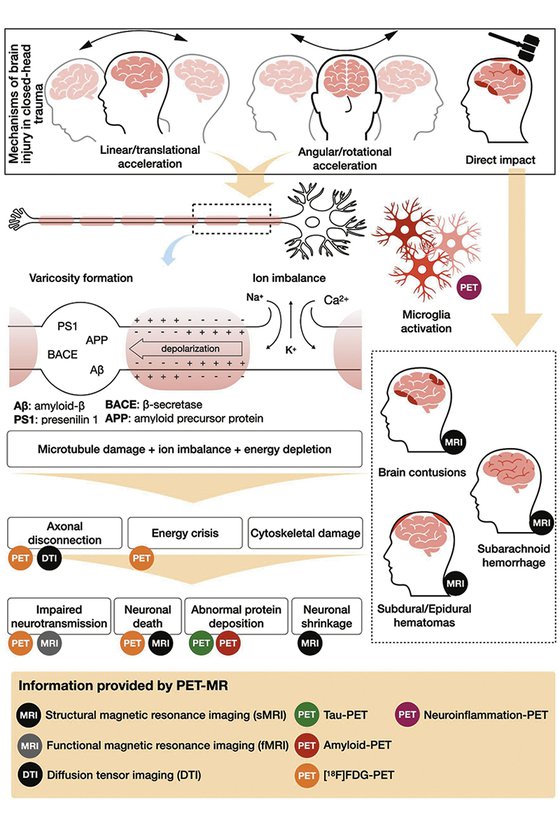
The mechanics of closed-head trauma and its correlation with neuroimaging and neuropathology findings in CTE are:
- Head impacts generate linear and rotational movements of the brain, which stretch and tear axons, leading to axonal injury4.
- The morphologic heterogeneity of the cerebral cortex, organized in gyri and sulci, plays an important role in the mechanisms of traumatic brain injury. Studies using mathematical models5 have shown that the traumatic forces are higher in the cortex located at the bottom of a sulcus than at the top of a gyrus, which corresponds to the spatial distribution of typical neuropathological findings in CTE6.
- Cellular and molecular pathophysiology of acute traumatic brain injury: The disruption of axonal integrity by shearing and strain forces caused by head trauma may result in axonal membrane leakage, leading to ion imbalance between intra and extracellular environments. This causes depolarization of the cell membrane, increased glucose consumption, and depletion of intracellular energy storage, setting an energy crisis7.
- These events are responsible for a period of increased brain vulnerability for new traumatic injuries. This vulnerability window is important in the context of sports-related concussion, as any new impact to the head during this period may lead to greater neuronal damage.
- The intracellular ion imbalance activates enzymes responsible for microtubules’ damage. Tau is a microtubule-stabilizing protein and its deposition in the brain may be related to the upregulation of tau production in an abnormal attempt to restore microtubule stability8.
- The disruption of microtubules impairs the cell’s structural stability, leading to the formation of axonal varicosities. Impaired axonal transport and formation of varicosities lead to aberrant colocalization of the amyloid precursor protein, β-secretase, and presenilin 1, causing intra- axonal amyloid-β production and accumulation and formation of extracellular amyloid-β plaques8.
CTE: the delayed effect of traumatic brain injury (TBI)
CTE is related to repetitive concussive and subconcussive head impacts1,8, often during the vulnerability window (especially among athletes), and is the late effect of neuronal death and chronic dysfunction secondary to molecular injury mechanisms previously mentioned. CTE is a post-mortem diagnosis. The clinical counterpart of CTE is the traumatic encephalopathy syndrome (TES), which consists of cognitive, behavioral or mood disturbances preceded by a history of repetitive head impacts. No clinical consensus for the diagnosis of CTE currently exists; however, for research purposes, the patient’s symptoms can be classified as probably CTE, possibly CTE or unlikely related to CTE, according to the presence of TES, neuroimaging and CFS biomarkers. These biomarkers are cavum septum pellucidum, normal CSF Aβ levels, elevated CSF p-tau/total- tau ratio, negative Aβ imaging, positive tau imaging, cortical thinning or cortical atrophy9.
A
Figure 1.
Mapping the CTE disease process using PET/MR.
The value of combined PET/MR in the evaluation of TBI and CTE
In studying CTE and other neurodegenerative diseases, the use of a hybrid PET/MR system brings clear benefits regarding better PET image quality (with better correction for motion artifacts and partial volume effect) and combined structural and molecular information. With an integrated PET/MR it is feasible to achieve, in a single imaging session, a complete neuroimaging evaluation with information on:
- Regional glucose metabolism/ amyloid deposition/tau deposition
- Brain atrophy and cortical thickness
- Cerebral small vessel disease
- Functional connectivity
- Structural connectivity and cortical microstructure
- Concentration of brain metabolites
- Diffuse axonal injury
- Brain contusions and traumatic sequelae
MR also has sequences for dedicated analysis for WM lesions and MRI-BOLD for resting-state functional connectivity. Additionally, MR enables seed-based analysis and the ability to visualize connectivity within temporal lobes and limbic regions.
Case 1
Patient is a 63-year-old retired soccer player with cognitive complaints and poor performance on neuropsychological tests. During neurological investigation, he underwent an imaging examination in a SIGNA™ PET/MR 3.0T scanner from GE Healthcare at the Center of Nuclear Medicine of the Institute of Radiology, University of São Paulo.

Reduced glucose metabolism was observed in the limbic areas and also in neocortical temporal areas, in an asymmetric fashion and predominant in the left side when compared to the normal database (Cortex ID Suite). With the exact alignment between structural and molecular imaging provided by PET/MR, it was apparent that the hypometabolic gyri had no structural abnormalities, indicating clear neurodegeneration. Beyond reduced FDG uptake in these regions, fenestration and detachment of the septum pelucidum’s laminae suggest the diagnosis of CTE (Figure 2).
Figure 2.
Case 1. A 63-year-old retired soccer player exposed to repetitive head impacts related to sports practice with probable CTE. (A-C) 18F-FDG PET images show hypometabolism in the right cerebellar hemisphere and the left neocortical, polar, and medial temporal regions (white arrows). Individual Z-score maps of the 18F-FDG PET images (Cortex ID Suite) projected on the (G, H) T2w MR highlights the hypometabolic areas. T2w MR also shows septal fenestrations and presence of cavum septum pellucidum (red arrows), an enlargement of cortical sulci in the left temporal and peri-insular regions related to brain atrophy (yellow arrows), as well as volumetric reductions of the left hippocampus and entorhinal cortex. (I) T2w FLAIR images did not show remarkable signs of microangiopathy. (D-F) 18F-FDG-PET Z-score map (T2w MR projection).
Case 2
A 58-year-old retired boxer with cognitive complaints and behavior impairment.

A

B

C

D
E
F
G
Figure 3.
Case 2. A 58-year-old retired boxer with possible CTE. (A, B) 18F-FDG PET images show mild to moderate hypometabolism in the bilateral prefrontal and opercular frontal regions, worse on the right side (white arrows). (C, D) Individual Z-score maps of the 18F-FDG PET images (Cortex ID Suite) projected on the T2w MR surface highlights the hypometabolic areas compared to a database of healthy individuals paired by age. (E) T1w and (F) T2w MR show septal fenestrations and presence of cavum septum pellucidum (red arrows), enlarged cortical sulci in both frontal lobes and open longitudinal fissure in the frontal region (yellow arrows). (G) T2w FLAIR MR did not show remarkable signs of microangiopathy .
Conclusion
The collection of this metabolic and structure information is feasible with a single scan. In our research, we found that the structural will follow functional changes; the neurodegeneration (damage) is more prominent in functional imaging than structural imaging, meaning that PET is an important diagnostic tool for CTE and possibly other types of neurodegenerative diseases.
It is important to keep in mind that FDG is not a surrogate for tau tracers and does not obliviate its usage. However, the availability and the cost of FDG make it a reasonable option for studying patients with suspected CTE, because the hypometabolism observed in our patients is detectable visually (in the clinical setting) and has a different pattern from other more common neurodegenerative diseases, such as Alzheimer’s disease.
References
2. Robinson ME, McKee AC, Salat DH, et al. Positron emission tomography of tau in Iraq and Afghanistan Veterans with blast neurotrauma, NeuroImage: Clinical, 2019. Volume 21, 101651. doi: 10.1016/j.nicl.2019.101651.
3. Grinberg LT, Anghinah R, Nascimento CF, et al. Chronic Traumatic Encephalopathy Presenting as Alzheimer’s Disease in a Retired Soccer Player. J Alzheimers Dis. 2016 Jul 29;54(1):169-74. doi: 10.3233/JAD-160312.
