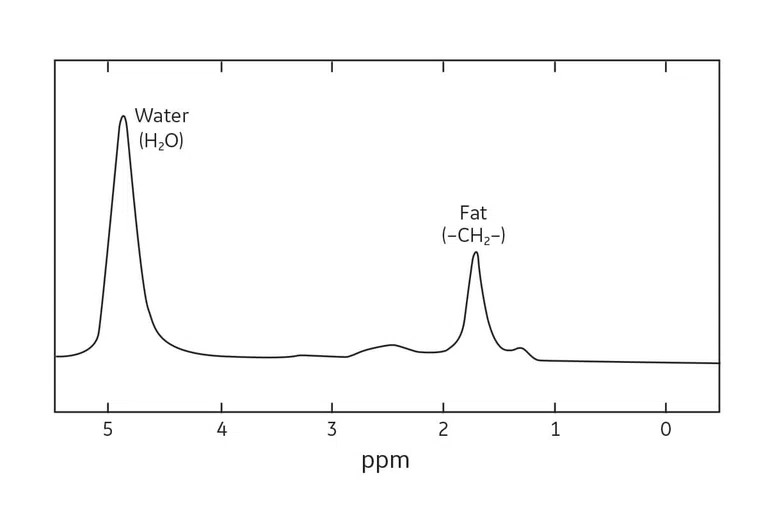
Figure 1.
Representative proton MR spectrum showing water and fat. The Larmor frequency of fat is approximately 3.5 ppm lower than that of water. Traditionally, MR spectra are plotted with fat to the right of water.
2 Bley TA, Wieben O, Francois CJ, Brittain JH, Reeder SB. Fat and water magnetic resonance imaging. J Magn Reson Imaging. 2010 Jan;31(1):4-18.
1 Delfaut EM, Beltran J, Johnson G, Rousseau J, Marchandise X, Cotton A. Fat Suppression in MR Imaging: Techniques and Pitfalls. Radiographics. 1999 Mar-Apr;19(2):373-82.
3 Fat Suppression Methods. Questions and Answers in MRI. Available at: https://mriquestions.com/best-method.html. Accessed on October 23, 2019.
4 Inhomogeneity. Magnetic Resonance – Technology Information Portal. Available at: https://www.mr-tip.com/serv1.php?type=db1&dbs=Inhomogeneity. Accessed on October 23, 2019.
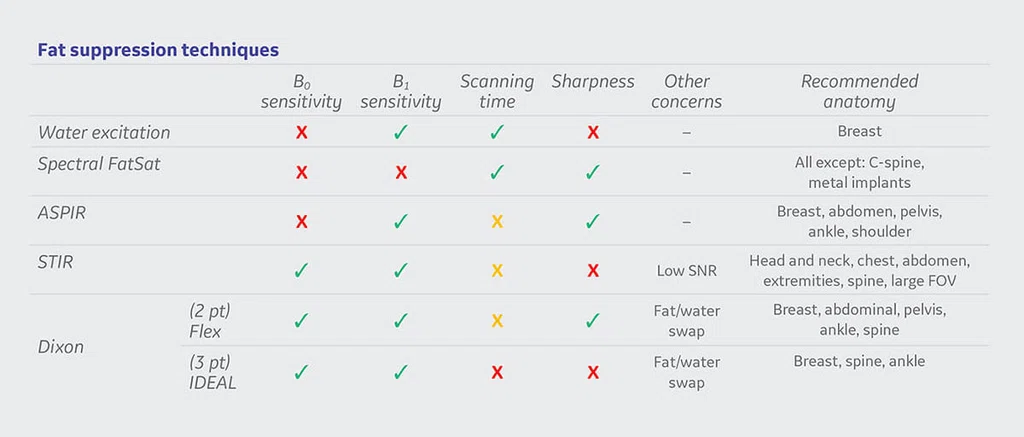
Figure 5.
Fat suppression technique recommendations for anatomical areas.
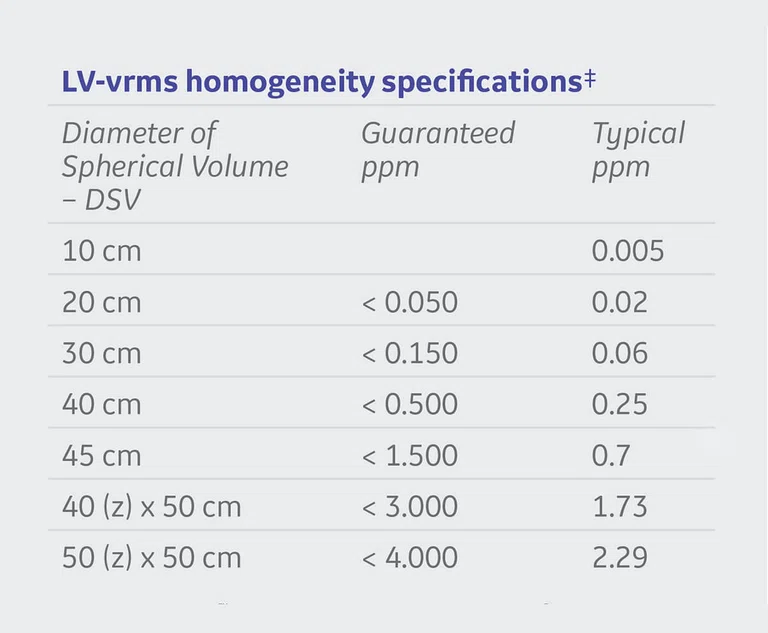
Figure 2.
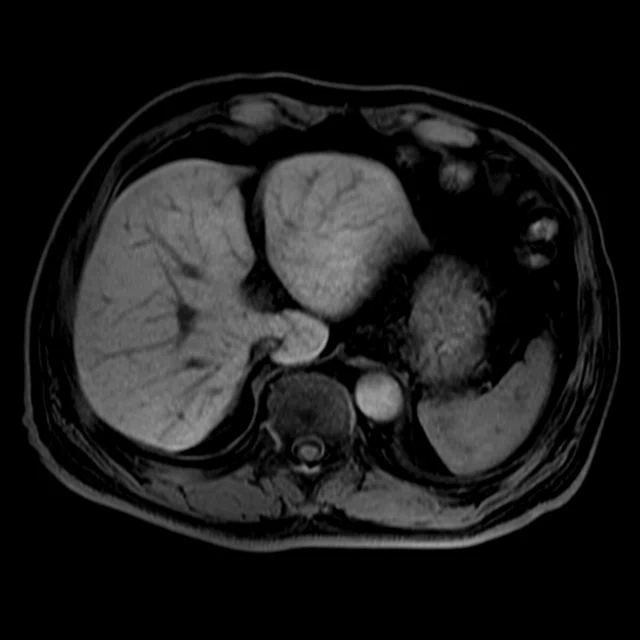
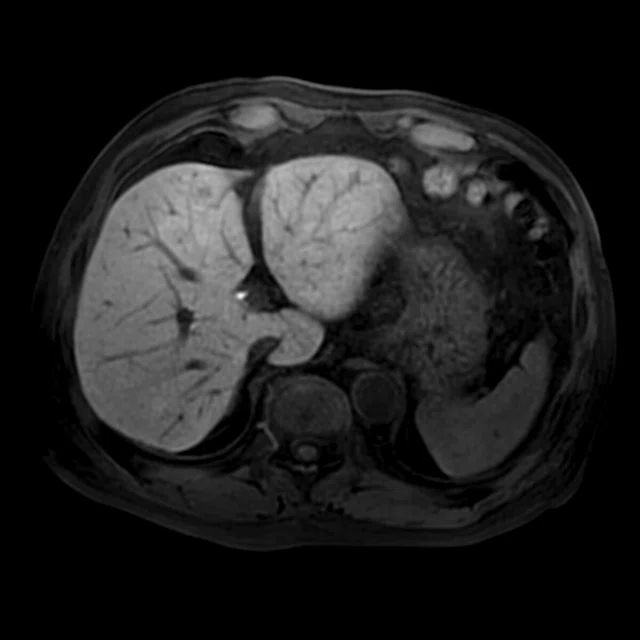
SIGNA™ Premier homogeneity specifications.
‡ Measured on the magnet, after passive shimming. Specifications correspond to forward production systems.
A
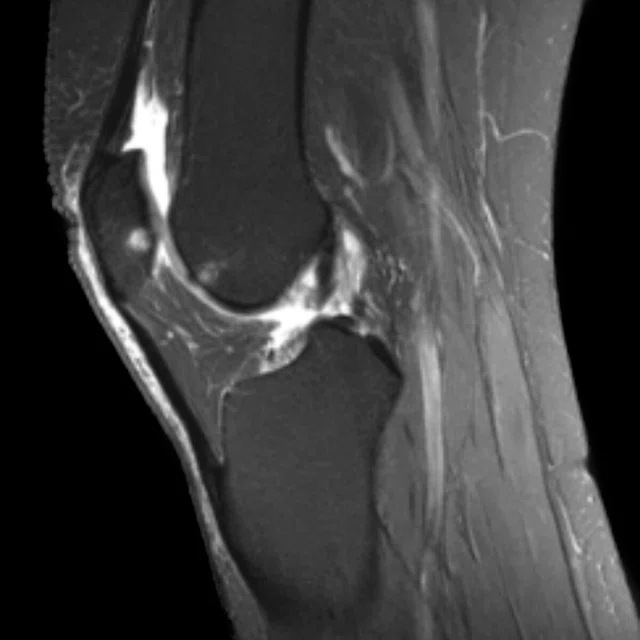
Figure 3.
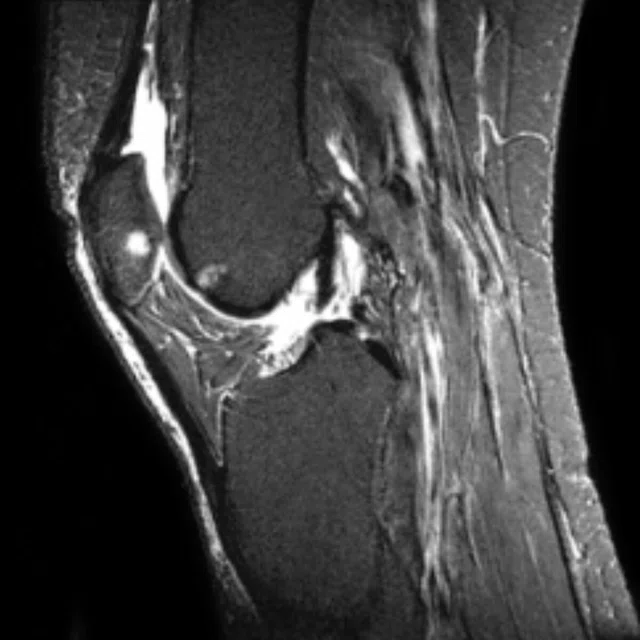
Sagittal knee exam (A) Chemical FatSat, (B) IDEAL (3 pt Dixon) and (C) STIR.
B
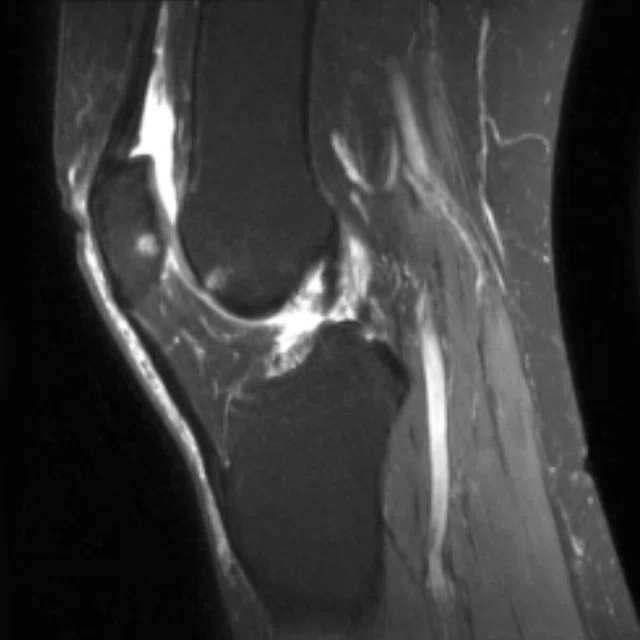
Figure 3.
Sagittal knee exam (A) Chemical FatSat, (B) IDEAL (3 pt Dixon) and (C) STIR.
C
Figure 3.
Sagittal knee exam (A) Chemical FatSat, (B) IDEAL (3 pt Dixon) and (C) STIR.
A
Figure 4.
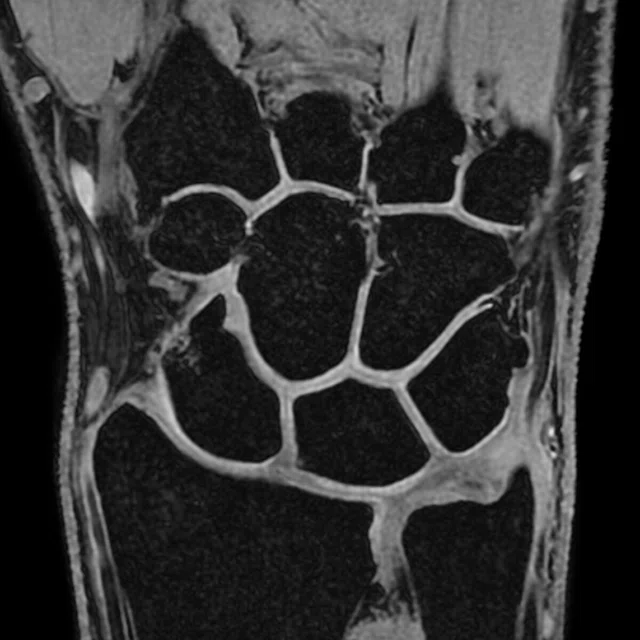
(A) Flex (2 pt Dixon), (B) Fat SPECIAL and (C) SSRF (water excitation) image of the wrist.
B
Figure 4.
(A) Flex (2 pt Dixon), (B) Fat SPECIAL and (C) SSRF (water excitation) image of the wrist.
C
Figure 4.
(A) Flex (2 pt Dixon), (B) Fat SPECIAL and (C) SSRF (water excitation) image of the wrist.
result


PREVIOUS
${prev-page}
NEXT
${next-page}
Subscribe Now
Manage Subscription
FOLLOW US
Contact Us • Cookie Preferences • Privacy Policy • California Privacy PolicyDo Not Sell or Share My Personal Information • Terms & Conditions • Security
© 2024 GE HealthCare. GE is a trademark of General Electric Company. Used under trademark license.
TECH TRENDS
Fat: when to suppress, saturate or separate it
Fat: when to suppress, saturate or separate it
By Heide Harris, RT(R)(MR), Global Product Marketing Director, MR Applications and Visualization, Steve Lawson, RT(R)(MR), Global MR Clinical Marketing Manager and Rob Peters, PhD, Global Product Marketing Director, MR Applications and Visualization
Fat or adipose tissue is an important tissue in clinical MR, but is often seen as a nuisance and requires special management when you don’t want the signal from it. Fat signal often appears bright in many MR imaging sequences, which can obscure underlying pathology.1 The goal of fat suppression techniques is to lessen the signal of fat so radiologists can more easily visualize the water-bearing signal regions.
Fat or adipose tissue is an important tissue in clinical MR, but is often seen as a nuisance and requires special management when you don’t want the signal from it. Fat signal often appears bright in many MR imaging sequences, which can obscure underlying pathology.1 The goal of fat suppression techniques is to lessen the signal of fat so radiologists can more easily visualize the water-bearing signal regions.
Most standard clinical protocols fast spin echo (FSE), spoiled gradient echo (SPGR) and steady-state free suppression — use a form of fat suppression to improve visualization of abnormalities such as edema, inflammation and enhancing tumors.
There are also pathologies where the visualization of fat may be needed, such as fatty tumors (adrenal adenomas, angio-myolipomas, liposarcomas and other fat-containing mesenchymal tumors), and where quantification of the amount of visceral adipose tissue or fatty infiltrative diseases (hepatic steatosis) is critical to diagnose. In these cases, the separation of water and fat signals can be achieved with water-only or fat-only images.2
Physics behind FatSat
Fat suppression pulses are typically applied right before the initial excitation pulse, at the start of a sequence. Methods for water-fat suppression are either based on chemical-shift, the short T1 of fat or a hybrid of these. Even within these different methods, various techniques exist for suppressing the high signal of fat. Choosing the right method and technique for each patient depends on several factors: the clinical question, the body part being imaged, use of gadolinium contrast, off-isocenter location, MR system field strength and the vicinity of MRConditional implants.3 Each technique has advantages and disadvantages. This guide will provide an overview of each and explain where each works best.
Fat saturation or suppression is based on the Larmor equation that magnetic dipoles precess around the direction of an applied magnetic field. The frequency of the precession is directly proportional to the magnet field strength ƒ0 = ƔB0, where ƒ0 is the precession frequency, B0 is the strength of the externally applied field and Ɣ is the gyromagnetic ratio, a constant specific to each particle or nucleus. The gyromagnetic ratio is 42.58 MHz/T for 1H nuclei, the most commonly imaged nuclei. For example, in a field (B0) at 1.5T, the resonance frequency of 1H would be (42.58 MHz/T) x (1.5T) = 63.87 MHz. At 3.0T, the resonance frequency would be twice as high, or 127.74 MHz.
Field strength and field homogeneity impact the effectiveness of the fat suppression, saturation or separation. Inhomogeneity is the fractional deviation of the local magnetic field from the average value of the field. The gyromagnetic ratio causes a frequency shift, causing distortions in geometry and intensity of the MR images.4
B0 inhomogeneity results in geometrical distortions or nonuniformity of the signal in MR imaging. B1 inhomogeneity can also contribute to regions being more or less saturated, when using such techniques. Some magnets are designed to provide excellent B0 homogeneity to ensure uniform signal and fat suppression over a larger field of view (FOV). A good indication of the system’s performance can be indicated by how homogenous the fat suppression is over a large 50 cm FOV (Figure 2).
Typically, at low field strengths, STIR or Dixon fat/water separation methods should be used. At high fields, if magnetic homogeneity is poor then spectral fat suppression may be inadequate. Performing shimming prior to imaging can minimize inhomogeneity effects, such as those that occur at tissue interfaces with different magnetic susceptibilities or irregularly shaped structures.
At 3.0T, precise control over the RF environment in a 70 cm patient bore has been challenging until now. The RF transmit architecture, MultiDrive, consists of two liquid-cooled 15 kW solid-state RF power amplifiers. By optimizing the phase and amplitude of each RF amplifier output channel that is applied to GE’s 70 cm whole body RF transmit coil, the RF uniformity and signal homogeneity improves regardless of patient shape, size, and/or body habitus.
Chemical FatSat
Chemical fat saturation applies a frequency selective saturation pulse at the frequency of fat before the imaging excitation pulse with the intent to suppress the fat signal prior to excitation. The result is an image consisting primarily of water. It works best at high fields, such as 1.5T and 3.0T.
The chemical fat saturation RF pulse is applied to null the signals from fat prior to the excitation pulse and readout. Chemical fat saturation can decrease the number of slice locations per TR due to the additional time required to apply the RF pulse and its contribution to SAR.
Although chemical fat saturation is a versatile technique, in the presence of metal it provides poor or incomplete suppression. The chemical saturation pulses are referred to as Fat, Fat Classic, SPECIAL and Water. SPECIAL supports manual tuning for center frequency adjusting (more later on this).
Inversion recovery suppression
STIR is an inversion recovery method that takes advantage of the T1 difference between water and fat, which is another effective approach to suppressing fat. In order to eliminate the signal from fat, the T1 time must match the null point of fat during its inversion recovery. Since T1 relaxation times are different for both 1.5T and 3.0T scanners, a T1 of 150 ms and 180 ms is recommended for each respective field strength.
However, STIR should not be used with post-contrast sequences since the T1 of lesions is shortened. This would make enhancements dark just like fat.
Spectral inversion techniques
SPECtral Inversion At Lipid (SPECIAL) is a specific GE Healthcare term to denote a hybrid fat suppression technique that incorporates features from both the frequency selective FatSat and the STIR techniques by using a spectrally selective inversion pulse that inverts only the fat magnetization and leaves only the water peak available for excitation. This technique is also referred to as Adiabatic SPectral Inversion Recovery (ASPIR), which can be used in sequences such as 2D FSE or 3D Cube. ASPIR is also more robust for B1 inhomogeneities compared to chemical fat saturation. As noted above, it’s recommended to use manual tuning to ensure that center frequency is centered on water.
Spectral spatial (SSRF) is a method that applies selective pulses for water excitation only, while fat is left untouched. Note that ASPIR is used (by default) for Cube and is selectable as “SPECIAL” for 2D FSE.
Dixon fat-water separation techniques
IDEAL (iterative decomposition of water and fat with echo asymmetry and least squares estimation) is a 3-point Dixon technique that acquires three images at slightly different echo times to generate phase shifts between water and fat. The water/fat separation method is very efficient in regions of poor B0 and B1 homogeneity. One acquisition provides four contrasts: water, fat, in-phase and out-of-phase images.
Flex is a 2-point Dixon technique delivering faster scan times compared to IDEAL, a 3-point Dixon technique. Flex uses a dual echo fat-water separation technology to provide robust and homogeneous fat suppressed images. Flex is compatible with ARC acceleration and HyperSense and can be used with Cube for significant scan time reduction. Enhanced uniformity and control of fat-water swaps allow large field of view and off-center imaging where uniformity is a challenge. Delivering fast 2D and 3D acquisitions with reconstructed in-phase, out-of-phase, water and fat images, Flex represents productivity gains in all clinical areas.
Despite a growing trend towards 3D imaging techniques, 2D FSE retains a prominent role in high-resolution MSK. In addition, non uniform fat suppression is a top clinical concern when imaging joints. 2D FSE Flex is best suited for balancing uniform fat suppression, scan time, SNR and image sharpness. One of the major benefits of using the Flex technique is that you get both a fat separated and in-phase image in one scan, which is particularly useful when a non-fat saturated and fat saturated sequence are requested post-contrast.


