Figure 1.
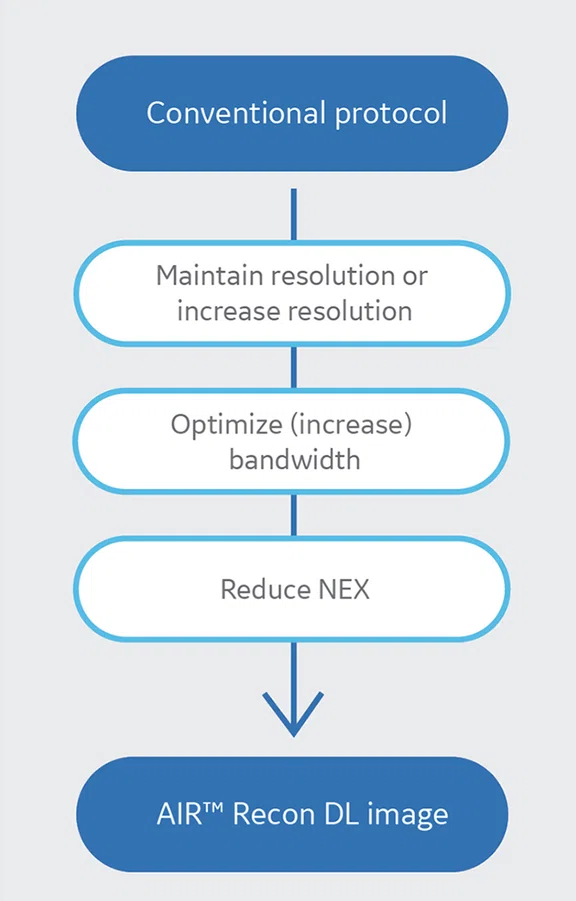
General guide for optimization.
‡Not yet CE marked for 1.5T. Not available for sale in all regions.
1. The clinical benefits of AIR™ Recon DL for MR image reconstruction. September 2020. https://www.gehealthcare.com/-/jssmedia/c943df5927a049bb9ac95a9f0349ad8c.pdf
2. Lebel, R.M. Performance characterization of a novel deep learning-based MR image reconstruction pipeline. August 2020. http://arxiv.org/abs/2008.06559
A
Figure 2.
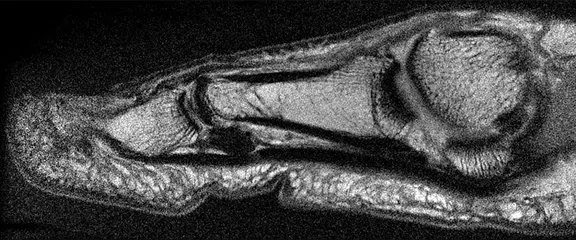
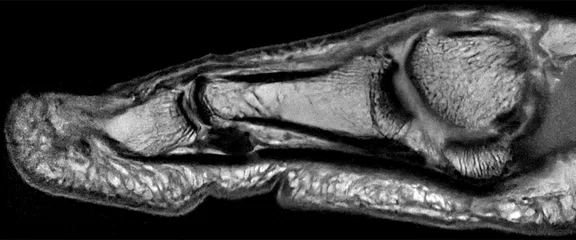
Toe scanned with 100 μm resolution and reconstructed with (A) conventional and (B) AIR™ Recon DL.
B
Figure 2.
Toe scanned with 100 μm resolution and reconstructed with (A) conventional and (B) AIR™ Recon DL.
A
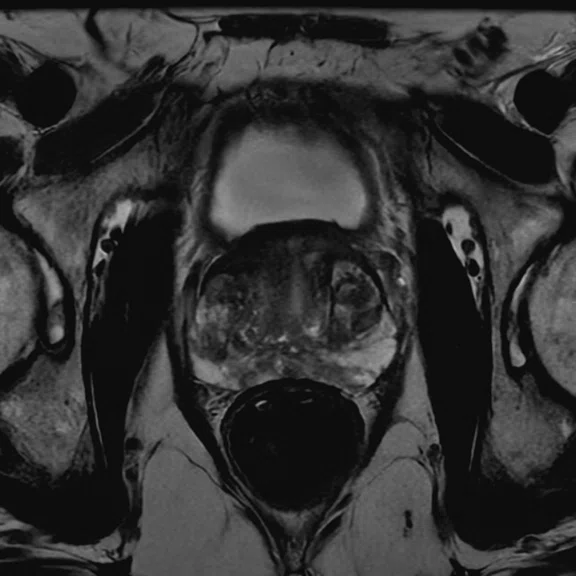
Figure 4.
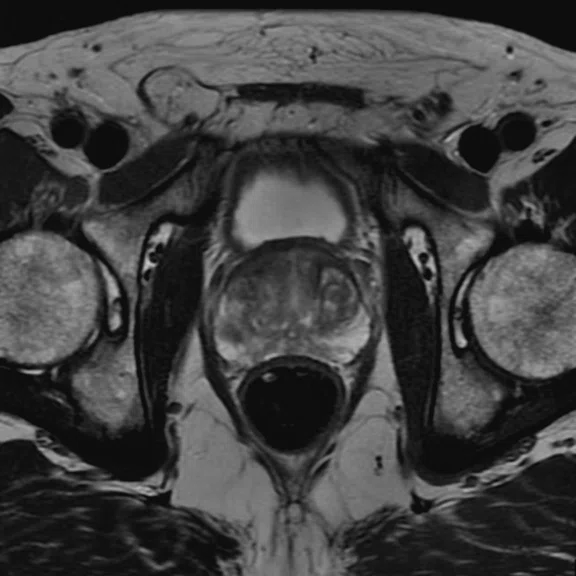
Comparison of (A) conventional reconstructed image and (B) AIR™ Recon DL reconstructed image.
B
Figure 4.
Comparison of (A) conventional reconstructed image and (B) AIR™ Recon DL reconstructed image.
A
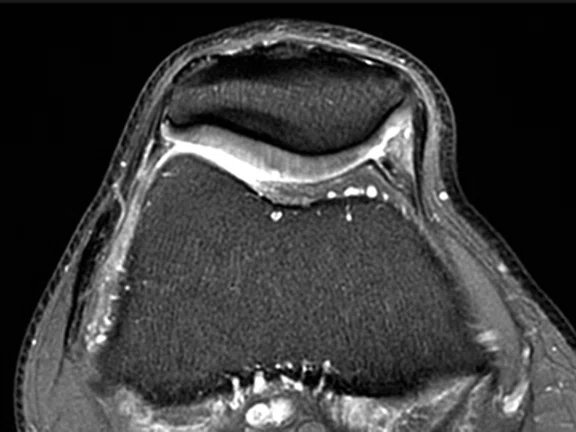
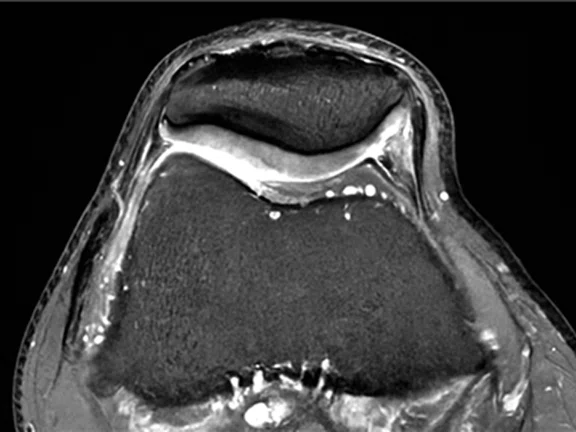
Figure 5.
Representative images demonstrating AIR™ Recon DL for simultaneous scan time reduction and spatial resolution improvement. Shown are PDw FatSat knee images. (A) Conventional reconstruction image, (B) AIR™ Recon DL reconstruction of the same raw data as in (A), (C) AIR™ Recon DL protocol from (B) with higher in-plane pixel size, reduced slice thickness and increased BW, and (D) the final AIR™ Recon DL image, protocol from (C) with reduced NEX to attain a shorter scan time and higher resolution compared to the conventional image in (A).
B
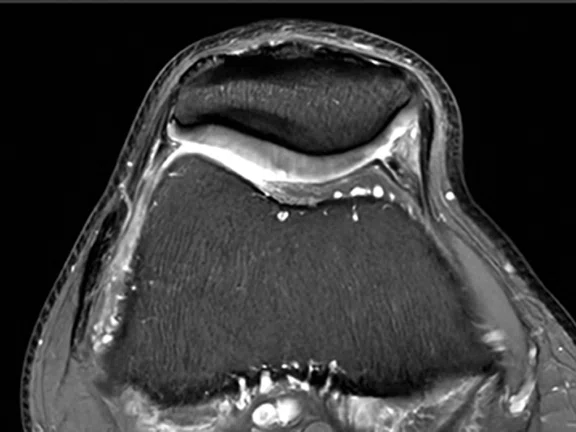
Figure 5.
Representative images demonstrating AIR™ Recon DL for simultaneous scan time reduction and spatial resolution improvement. Shown are PDw FatSat knee images. (A) Conventional reconstruction image, (B) AIR™ Recon DL reconstruction of the same raw data as in (A), (C) AIR™ Recon DL protocol from (B) with higher in-plane pixel size, reduced slice thickness and increased BW, and (D) the final AIR™ Recon DL image, protocol from (C) with reduced NEX to attain a shorter scan time and higher resolution compared to the conventional image in (A).
C
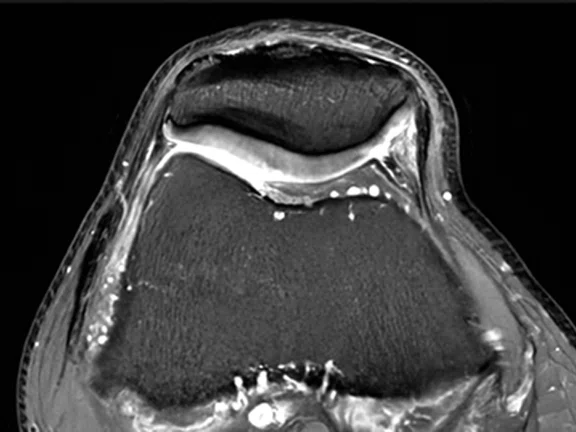
Figure 5.
Representative images demonstrating AIR™ Recon DL for simultaneous scan time reduction and spatial resolution improvement. Shown are PDw FatSat knee images. (A) Conventional reconstruction image, (B) AIR™ Recon DL reconstruction of the same raw data as in (A), (C) AIR™ Recon DL protocol from (B) with higher in-plane pixel size, reduced slice thickness and increased BW, and (D) the final AIR™ Recon DL image, protocol from (C) with reduced NEX to attain a shorter scan time and higher resolution compared to the conventional image in (A).
D
Figure 5.
Representative images demonstrating AIR™ Recon DL for simultaneous scan time reduction and spatial resolution improvement. Shown are PDw FatSat knee images. (A) Conventional reconstruction image, (B) AIR™ Recon DL reconstruction of the same raw data as in (A), (C) AIR™ Recon DL protocol from (B) with higher in-plane pixel size, reduced slice thickness and increased BW, and (D) the final AIR™ Recon DL image, protocol from (C) with reduced NEX to attain a shorter scan time and higher resolution compared to the conventional image in (A).
3. Zafar W, Masood A, Iqbal B, Murad S. Resolution, SNR, Signal Averaging and Scan Time in MRI for Metastatic lesion in spine. A case report. J Radiol Med Imaging. 2019; 2(1): 1014. https://meddocsonline.org/journal-of-radiology-and-medical-imaging/resolution-snr-signalaveraging-and-scan-time-in-mri-formetastatic-lesion-in-spine-a-case-report.pdf
Figure 4.
Comparison of (A) conventional reconstructed image and (B) AIR™ Recon DL reconstructed image.
Figure 4.
Comparison of (A) conventional reconstructed image and (B) AIR™ Recon DL reconstructed image.
A
Figure 5.
Representative images demonstrating AIR™ Recon DL for simultaneous scan time reduction and spatial resolution improvement. Shown are PDw FatSat knee images. (A) Conventional reconstruction image, (B) AIR™ Recon DL reconstruction of the same raw data as in (A), (C) AIR™ Recon DL protocol from (B) with higher in-plane pixel size, reduced slice thickness and increased BW, and (D) the final AIR™ Recon DL image, protocol from (C) with reduced NEX to attain a shorter scan time and higher resolution compared to the conventional image in (A).
B
Figure 5.
Representative images demonstrating AIR™ Recon DL for simultaneous scan time reduction and spatial resolution improvement. Shown are PDw FatSat knee images. (A) Conventional reconstruction image, (B) AIR™ Recon DL reconstruction of the same raw data as in (A), (C) AIR™ Recon DL protocol from (B) with higher in-plane pixel size, reduced slice thickness and increased BW, and (D) the final AIR™ Recon DL image, protocol from (C) with reduced NEX to attain a shorter scan time and higher resolution compared to the conventional image in (A).
C
Figure 5.
Representative images demonstrating AIR™ Recon DL for simultaneous scan time reduction and spatial resolution improvement. Shown are PDw FatSat knee images. (A) Conventional reconstruction image, (B) AIR™ Recon DL reconstruction of the same raw data as in (A), (C) AIR™ Recon DL protocol from (B) with higher in-plane pixel size, reduced slice thickness and increased BW, and (D) the final AIR™ Recon DL image, protocol from (C) with reduced NEX to attain a shorter scan time and higher resolution compared to the conventional image in (A).
D
Figure 5.
Representative images demonstrating AIR™ Recon DL for simultaneous scan time reduction and spatial resolution improvement. Shown are PDw FatSat knee images. (A) Conventional reconstruction image, (B) AIR™ Recon DL reconstruction of the same raw data as in (A), (C) AIR™ Recon DL protocol from (B) with higher in-plane pixel size, reduced slice thickness and increased BW, and (D) the final AIR™ Recon DL image, protocol from (C) with reduced NEX to attain a shorter scan time and higher resolution compared to the conventional image in (A).
result


PREVIOUS
${prev-page}
NEXT
${next-page}
Subscribe Now
Manage Subscription
FOLLOW US
Contact Us • Cookie Preferences • Privacy Policy • California Privacy PolicyDo Not Sell or Share My Personal Information • Terms & Conditions • Security
© 2024 GE HealthCare. GE is a trademark of General Electric Company. Used under trademark license.
TECH TRENDS
Practical protocol conversion and optimization with AIR Recon DL
Practical protocol conversion and optimization with AIR Recon DL
by Robert D. Peters, PhD, Global Product Marketing Director, MR Applications & Visualization, Holly Blahnik, RT(R)(MR), Lead Clinical Development Specialist, Heide Harris, RT(R)(MR), Global Product Marketing Director, MR Applications & Visualization and Steve Lawson, RT(R)(MR), Global MR Clinical Marketing Manager, GE Healthcare
There’s a saying in MRI that, "there’s no free lunch." That’s because there are often tradeoffs when it comes to MR, especially with protocols. While there are many ways to optimize a protocol, there are certain parameters that can give sharper images or save scan time. However, these can contribute to more noise in the image, which impacts SNR. In order to obtain sufficient SNR in current MR protocols, adjustments to these parameters tend to be more conservative to achieve a good balance between scan time and image quality.
AIR™ Recon DL‡, a novel deep-learning-based reconstruction technique that uses a trained convolutional neural network, delivers enhanced clinical benefits1 and technical performance2 in clinical settings. The algorithm includes a means of both SNR improvement and image sharpening, which provides for multiple clinical benefits over conventional image reconstruction, helping users manage the delicate balance between spatial resolution, signal-to-noise ratio (SNR) and scan time.
By expanding the useable "protocol space," AIR™ Recon DL enables more choices that meet the clinical demands for higher spatial resolution and SNR, overall better image quality and sharpness, and lower scan times – all while avoiding the tradeoffs that can lead to inconsistent imaging results.
AIR™ Recon DL provides users with the capability of scanning at significantly higher spatial resolutions, higher SNR and greater speed, which were not attainable with conventional image reconstruction.
This article introduces an effective way to optimize current protocols to get the most out of AIR™ Recon DL. First, it’s important to consider your overall scanning goals. Some users want to achieve an improvement in scan times to accommodate more time slots in their schedule each day or to open up the ability to add another patient into an already full schedule. Others prefer to drive the system to previously unattainable resolution, such as smaller FOVs or higher spatial resolution. In other cases, it can be a mix of both.
With AIR™ Recon DL, it is important to remember that increasing resolution will still allow for faster scan times. Figure 1 is a simple and easy chart to follow utilizing the three primary parameters when optimizing protocols for AIR™ Recon DL, based on your scanning goals. Early adopters of AIR™ Recon DL have found this process to be a simple and effective way to drive consistency and performance, and change the way they think about optimizing MR protocols.
Getting the most from AIR™ Recon DL
Resolution
Resolution provides the ability to resolve small structures and details within the image. In MR, the resolution is determined by the number of voxels in a specific FOV. The higher the image resolution, the better that small structures can be visualized3. Adjusting resolution typically includes a few basic parameters: in-plane (frequency and phase) matrix, slice thickness and FOV. These factors make up the voxel size and overall resolution. Adjusting any of these factors (i.e., decreasing slice thickness or increasing the matrix) will have an effect on your overall voxel size and thus SNR and scan time. For example, a higher matrix costs more time and reduces SNR since the voxel is smaller. However, with AIR™ Recon DL these tradeoffs are removed.
Whether you’re looking to maintain your resolution or level up your resolution, there’s a few considerations to keep in mind:
- There is spatial resolution improvement with AIR™ Recon DL even if they don’t reduce the voxel size.
- Increasing frequency matrix will improve resolution with minimal impact to scan time.
- Increasing phase matrix will improve resolution with a proportionate impact to scan time.
- Thinner slices improves spatial resolution and slice volume averaging, producing sharper images.
- Smaller FOV will increase spatial resolution without any scan time impact. For example, it’s easy to decrease your FOV on a small part, such as a finger, in order improve resolution. If you do not change your phase or frequency matrix, a smaller FOV will increase spatial resolution.
- All of these techniques affect voxel size and they introduce more noise on an image. However, AIR™ Recon DL boosts the SNR, making thinner slices and higher resolution more feasible.
Bandwidth
Bandwidth (BW) can have an effect on many parameters such as SNR, minimum FOV, noise, chemical shift, TR/TE, susceptibility/distortion/metal artifacts and echo spacing. Most importantly, increasing bandwidth can reduce echo spacing (ESP). ESP is the space between the 180 degree refocusing pulses on FSE sequences, so decreasing ESP can help to decrease overall scan time while also reducing blurring. Increasing bandwidth adds more noise to an image. However, with AIR™ Recon DL, noise is reduced, allowing the user to get the best benefit from bandwidth.
Consider this:
- With FSE scans, BW should be increased to reduce the ESP, which will reduce T2-related blurring.
- ESP is also dependent on the frequency matrix, so determine the spatial resolution first and then increase the BW. Adjusting the BW will update the BW per pixel and the ESP directly on the user interface for easy selection.
- A good starting point on a 3.0T system is to increase your BW until your BW/pixel is above 300 Hz/pixel. This will balance your ESP and SNR. For 1.5T, that number will be lower.
NEX
NEX is the most commonly used parameter to reduce scan time. In fact, it’s probably the most commonly used factor to go fast for the novice technologist. However, it comes at a detriment of signal loss. Technically, SNR is directly proportional to the square root of the NEX (✓NEX). It directly impacts scan time, so the more NEX on a sequence, the more time is added. And some sequences such as STIR or FatSat need more signal because signal is suppressed.
Consider this:
- NEX is most commonly used to achieve sufficient signal at the expense of scan time. AIR™ Recon DL will boost the SNR and allows you to reduce NEX to save scan time. In many cases, it can be reduced to 1 NEX.
- Some believe that using more than 1 NEX may reduce physiologic motion (e.g., peristalsis, respiration, flow). Scanning with more than 1 NEX remains possible, when preferred.
What other parameters can be used to optimize protocols with AIR™ Recon DL?
- Parallel imaging is another factor to continue decreasing scan time. Whether it’s ASSET or ARC, it’s important to remember the amount of acceleration will depend on the coil, the acceleration factor and the patient habitus. Generally, parallel imaging should only be used when NEX has been reduced. AIR™ Recon DL does not have a direct effect on artifacts related to acceleration. If you’re already using acceleration, either keep the same acceleration factor or incrementally increase it until the desired scan time is achieved.
- Echo Train Length (ETL) – FSE scans, the ETL can be increased to proportionately reduce scan time with minor reduction in SNR. When increasing ETL, the readout BW should also be increased to reduce the ESP to preserve ESP ∗ ETL product. Note that if Auto TR is used, an increase in the ETL will lead to a longer TR and eliminate the scan time reduction benefit.
Choosing SNR improvement level
Users can select the level of SNR improvement – low, medium or high – on the user interface under Recon DL Strength. Users can also decide to save the conventional reconstruction and the AIR™ Recon DL images, saving both for comparison to help determine the best level for the facility and radiologists. This option is located in the system preferences toolbox.
Helpful Hints:
- Setting AIR™ Recon DL strength to "high" will allow the biggest improvement in noise reduction. Following the steps outlined above will help achieve this impact in overall image quality. All GE supplied AIR™ Recon DL protocols are set to "high".
Summary
To fully realize the clinical benefits of AIR™ Recon DL is to understand how it can provide more freedom to achieve higher spatial resolution, higher SNR and shorter scan times, separately or simultaneously. The concept of an expanded protocol space can be helpful, in particular, to realize what type of scans were simply not attainable with conventional image reconstruction. All users have some amount of preference when it comes to spatial resolution, SNR and scan time, and utilizing these step-by-step guidelines can help your facility make the most of AIR™ Recon DL.
Differentiators of AIR™ Recon DL:
- Use of raw data for the most effective result
- Compatible with all anatomies
- Sharpens images in addition to denoising
- User-selectable SNR improvement level
- Images that appear directly on the MR console
- Thoroughly tested in clinical settings with multiple peer-reviewed published studies
Key considerations when implementing:
- How to reduce scan time (keeping spatial resolution preserved)?
- How to increase spatial resolution (keeping scan time preserved)?
- How to reduce scan time and increase spatial resolution?
- What SNR improvement level is preferred?
Conventional
0.42 x 0.42 x 3.0 mm
BW = ± 42 kHz
NEX = 3
Scan time = 3:40 min
AIR™ Recon DL - high
0.42 x 0.42 x 3.0 mm
BW = ± 42 kHz
NEX = 3
Scan time = 3:40 min.
AIR™ Recon DL - high
0.34 x 0.34 x 2.5 mm
BW = ± 62 kHz
NEX = 3
Scan time = 5:08 min.
AIR™ Recon DL - high
0.34 x 0.34 x 2.5 mm
BW = ± 62 kHz
NEX = 1
Scan time = 1:46 min.
Figure 5.
Representative images demonstrating AIR™ Recon DL for simultaneous scan time reduction and spatial resolution improvement. Shown are PDw FatSat knee images. (A) Conventional reconstruction image, (B) AIR™ Recon DL reconstruction of the same raw data as in (A), (C) AIR™ Recon DL protocol from (B) with higher in-plane pixel size, reduced slice thickness and increased BW, and (D) the final AIR™ Recon DL image, protocol from (C) with reduced NEX to attain a shorter scan time and higher resolution compared to the conventional image in (A).
A
Conventional
0.6 x 1.0 mm (20 FOV)
BW = 31.2 kHz
NEX = 1.5
Scan time = 3:50 min.
B
AIR™ Recon DL
0.4 x .6 mm (15 FOV)
BW = 50.0 kHz
NEX = 1
Scan time = 1:35 min.
Figure 4.
Comparison of (A) conventional reconstructed image and (B) AIR™ Recon DL reconstructed image.
Conventional
0.42 x 0.42 x 3.0 mm
BW = ± 42 kHz
NEX = 3
Scan time = 3:40 min
AIR™ Recon DL - high
0.42 x 0.42 x 3.0 mm
BW = ± 42 kHz
NEX = 3
Scan time = 3:40 min.
AIR™ Recon DL - high
0.34 x 0.34 x 2.5 mm
BW = ± 62 kHz
NEX = 3
Scan time = 5:08 min.
AIR™ Recon DL - high
0.34 x 0.34 x 2.5 mm
BW = ± 62 kHz
NEX = 1
Scan time = 1:46 min.
Figure 5.
Representative images demonstrating AIR™ Recon DL for simultaneous scan time reduction and spatial resolution improvement. Shown are PDw FatSat knee images. (A) Conventional reconstruction image, (B) AIR™ Recon DL reconstruction of the same raw data as in (A), (C) AIR™ Recon DL protocol from (B) with higher in-plane pixel size, reduced slice thickness and increased BW, and (D) the final AIR™ Recon DL image, protocol from (C) with reduced NEX to attain a shorter scan time and higher resolution compared to the conventional image in (A).


