‡Not yet CE marked for 1.5T. Not available for sale in all regions.
A
Figure 1.
AIR™ Recon DL Intelligent Ringing Suppression for sharper images as demonstrated in an imaging phantom. (A) Conventional image reconstruction with apodization still results in significant Gibbs ringing. (B) Magnified A showing ringing and a loss of fine detail in the circular structures. (C) The same raw data as reconstructed using AIR™ Recon DL shows elimination of Gibbs ringing artifacts and (D) considerably sharper images. Note that the AIR™ Recon DL images also show the added benefit of noise reduction, however, this is considered unrelated to the improved sharpness of the images.
B
Figure 1.
AIR™ Recon DL Intelligent Ringing Suppression for sharper images as demonstrated in an imaging phantom. (A) Conventional image reconstruction with apodization still results in significant Gibbs ringing. (B) Magnified A showing ringing and a loss of fine detail in the circular structures. (C) The same raw data as reconstructed using AIR™ Recon DL shows elimination of Gibbs ringing artifacts and (D) considerably sharper images. Note that the AIR™ Recon DL images also show the added benefit of noise reduction, however, this is considered unrelated to the improved sharpness of the images.
C
Figure 1.
AIR™ Recon DL Intelligent Ringing Suppression for sharper images as demonstrated in an imaging phantom. (A) Conventional image reconstruction with apodization still results in significant Gibbs ringing. (B) Magnified A showing ringing and a loss of fine detail in the circular structures. (C) The same raw data as reconstructed using AIR™ Recon DL shows elimination of Gibbs ringing artifacts and (D) considerably sharper images. Note that the AIR™ Recon DL images also show the added benefit of noise reduction, however, this is considered unrelated to the improved sharpness of the images.
D
Figure 1.
AIR™ Recon DL Intelligent Ringing Suppression for sharper images as demonstrated in an imaging phantom. (A) Conventional image reconstruction with apodization still results in significant Gibbs ringing. (B) Magnified A showing ringing and a loss of fine detail in the circular structures. (C) The same raw data as reconstructed using AIR™ Recon DL shows elimination of Gibbs ringing artifacts and (D) considerably sharper images. Note that the AIR™ Recon DL images also show the added benefit of noise reduction, however, this is considered unrelated to the improved sharpness of the images.
A
Figure 2.
Expanded clinical protocol space with AIR™ Recon DL. (A) Conventional reconstruction with the clinically acceptable SNR contour, as indicated in red, the only protocol combinations of voxel volume and scan time that are simultaneously clinically acceptable for SNR, scan time and spatial resolution is the triangular area in red. (B) An expanded protocol space with AIR™ Recon DL reconstruction showing the clinically acceptable SNR contour to be shifted lower and the clinically acceptable resolution threshold is further to the right, compared to conventional reconstruction in (A, red solid and dotted lines). The area in blue represents more protocol combinations of voxel volumes and scan times that are clinically acceptable for SNR, scan time and spatial resolution with AIR™ Recon DL.
B
Figure 2.
Expanded clinical protocol space with AIR™ Recon DL. (A) Conventional reconstruction with the clinically acceptable SNR contour, as indicated in red, the only protocol combinations of voxel volume and scan time that are simultaneously clinically acceptable for SNR, scan time and spatial resolution is the triangular area in red. (B) An expanded protocol space with AIR™ Recon DL reconstruction showing the clinically acceptable SNR contour to be shifted lower and the clinically acceptable resolution threshold is further to the right, compared to conventional reconstruction in (A, red solid and dotted lines). The area in blue represents more protocol combinations of voxel volumes and scan times that are clinically acceptable for SNR, scan time and spatial resolution with AIR™ Recon DL.
A
Figure 3.
SNR improvement with AIR™ Recon DL. Shown is a short axis T2 Double IR black-blood FatSat breath-hold scan, 1.3 x 1.4 x 6 mm, 2:13 min. scan time with 11 sec. breath hold. (A, B) Conventional image reconstruction and (C, D) AIR™ Recon DL high setting of the same raw data showing considerable SNR improvement.
B
Figure 3.
SNR improvement with AIR™ Recon DL. Shown is a short axis T2 Double IR black-blood FatSat breath-hold scan, 1.3 x 1.4 x 6 mm, 2:13 min. scan time with 11 sec. breath hold. (A, B) Conventional image reconstruction and (C, D) AIR™ Recon DL high setting of the same raw data showing considerable SNR improvement.
D
Figure 3.
SNR improvement with AIR™ Recon DL. Shown is a short axis T2 Double IR black-blood FatSat breath-hold scan, 1.3 x 1.4 x 6 mm, 2:13 min. scan time with 11 sec. breath hold. (A, B) Conventional image reconstruction and (C, D) AIR™ Recon DL high setting of the same raw data showing considerable SNR improvement.
C
Figure 3.
SNR improvement with AIR™ Recon DL. Shown is a short axis T2 Double IR black-blood FatSat breath-hold scan, 1.3 x 1.4 x 6 mm, 2:13 min. scan time with 11 sec. breath hold. (A, B) Conventional image reconstruction and (C, D) AIR™ Recon DL high setting of the same raw data showing considerable SNR improvement.
A
Figure 4.
Sharper images with AIR™ Recon DL. Shown is a coronal FSE PDw, 0.3 x 0.3 x 1.0 mm of the first metatarsal. (A) Conventional image reconstruction and (B) AIR™ Recon DL high setting of the same raw data (same matrix and scan time) showing sharper trabecular structure.
B
Figure 4.
Sharper images with AIR™ Recon DL. Shown is a coronal FSE PDw, 0.3 x 0.3 x 1.0 mm of the first metatarsal. (A) Conventional image reconstruction and (B) AIR™ Recon DL high setting of the same raw data (same matrix and scan time) showing sharper trabecular structure.
A
Figure 5.
Lumbar spine exam demonstrating (A) conventional reconstructed image, 0.9 x 1.3 x 3 mm, BW 32.2 kHz, NEX 2, 2:47 min. and (B) AIR™ Recon DL reconstructed image, 0.7 x 0.9 x 3 mm, BW 41.7 kHz, NEX 1, 1:16 min.
B
Figure 5.
Lumbar spine exam demonstrating (A) conventional reconstructed image, 0.9 x 1.3 x 3 mm, BW 32.2 kHz, NEX 2, 2:47 min. and (B) AIR™ Recon DL reconstructed image, 0.7 x 0.9 x 3 mm, BW 41.7 kHz, NEX 1, 1:16 min.
A
Figure 6.
Shoulder exam demonstrating a 46 percent improvement in resolution and a 36 percent reduction in scan time with AIR™ Recon DL. (A) Conventional reconstructed image, 0.4 x 0.6 x 3 mm, BW 41.7 kHz, NEX 1, 2:14 min. and (B) AIR™ Recon DL reconstructed image, 0.3 x 0.5 x 3 mm, BW 62.5 kHz, NEX 1, 1:33 min.
B
Figure 6.
Shoulder exam demonstrating a 46 percent improvement in resolution and a 36 percent reduction in scan time with AIR™ Recon DL. (A) Conventional reconstructed image, 0.4 x 0.6 x 3 mm, BW 41.7 kHz, NEX 1, 2:14 min. and (B) AIR™ Recon DL reconstructed image, 0.3 x 0.5 x 3 mm, BW 62.5 kHz, NEX 1, 1:33 min.
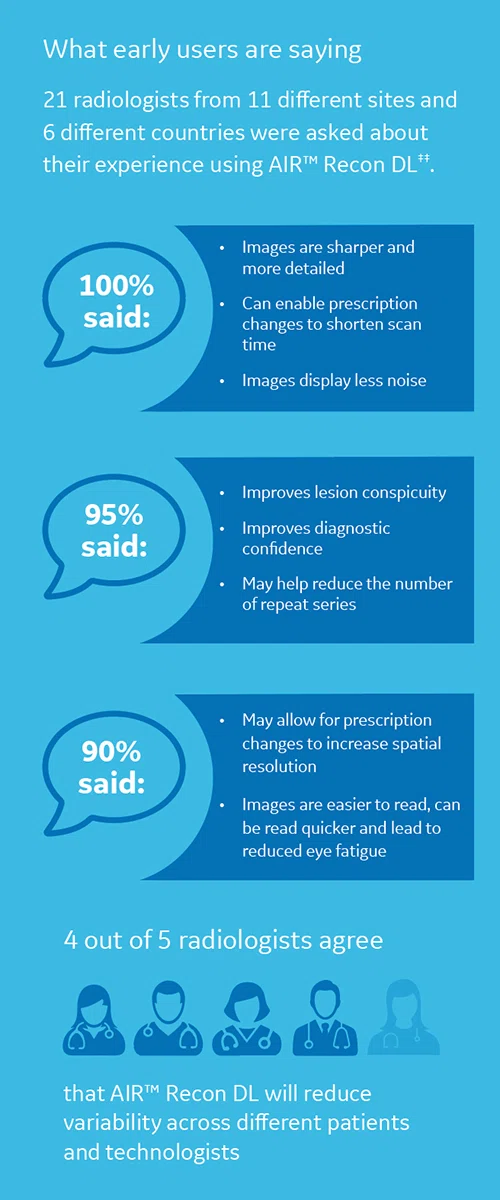
‡‡Based on an early adopter survey of 21 radiologists from 11 different sites and 6 different countries.
‡‡Based on an early adopter survey of 21 radiologists from 11 different sites and 6 different countries.
1. Lebel, R.M. Performance characterization of a novel deep learning-based MR image reconstruction pipeline. August 2020. http://arxiv.org/abs/2008.06559.
1. Lebel, R.M. Performance characterization of a novel deep learning-based MR image reconstruction pipeline. August 2020. http://arxiv.org/abs/2008.06559.
A
Figure 3.
SNR improvement with AIR™ Recon DL. Shown is a short axis T2 Double IR black-blood FatSat breath-hold scan, 1.3 x 1.4 x 6 mm, 2:13 min. scan time with 11 sec. breath hold. (A, B) Conventional image reconstruction and (C, D) AIR™ Recon DL high setting of the same raw data showing considerable SNR improvement.
B
Figure 3.
SNR improvement with AIR™ Recon DL. Shown is a short axis T2 Double IR black-blood FatSat breath-hold scan, 1.3 x 1.4 x 6 mm, 2:13 min. scan time with 11 sec. breath hold. (A, B) Conventional image reconstruction and (C, D) AIR™ Recon DL high setting of the same raw data showing considerable SNR improvement.
D
Figure 3.
SNR improvement with AIR™ Recon DL. Shown is a short axis T2 Double IR black-blood FatSat breath-hold scan, 1.3 x 1.4 x 6 mm, 2:13 min. scan time with 11 sec. breath hold. (A, B) Conventional image reconstruction and (C, D) AIR™ Recon DL high setting of the same raw data showing considerable SNR improvement.
C
Figure 3.
SNR improvement with AIR™ Recon DL. Shown is a short axis T2 Double IR black-blood FatSat breath-hold scan, 1.3 x 1.4 x 6 mm, 2:13 min. scan time with 11 sec. breath hold. (A, B) Conventional image reconstruction and (C, D) AIR™ Recon DL high setting of the same raw data showing considerable SNR improvement.


result
PREVIOUS
${prev-page}
NEXT
${next-page}
Subscribe Now
Manage Subscription
FOLLOW US
Contact Us • Cookie Preferences • Privacy Policy • California Privacy PolicyDo Not Sell or Share My Personal Information • Terms & Conditions • Security
© 2024 GE HealthCare. GE is a trademark of General Electric Company. Used under trademark license.
TECH TRENDS
The clinical benefits of AIR Recon DL for MR image reconstruction
The clinical benefits of AIR Recon DL for MR image reconstruction
By Robert D. Peters, PhD, Global Product Marketing Director, MR Applications & Visualization, Heide Harris, RT(R)(MR), Global Product Marketing Director, MR Applications & Visualization, and Steve Lawson, RT(R)(MR), Global MR Clinical Marketing Manager, GE Healthcare
The advantages of MR as a medical imaging modality are well documented, including the lack of ionizing radiation, volumetric capabilities, superior soft tissue contrast and the potential for quantitative imaging. Unfortunately, long imaging times and a lack of high spatial resolution remain as common clinical complaints and represent a major focus of present-day technical development activities.
To this end, the MR industry has addressed these needs with innovations such as parallel imaging, compressed sensing and simultaneous multi-slice for scan time acceleration.
Artificial intelligence, particularly deep-learning (DL) techniques such as AIR™ Recon DL‡, have recently been introduced to improve image quality (SNR and sharpness) as well as enable scan time reductions.
In MR imaging, raw data is collected in the form of so-called k-space, which represents the Fourier transform of the object being imaged. Due to the finite amount of k-space that is collected in MR imaging, certain artifacts result, such as Gibbs ringing, which is also known as a truncation artifact, and occur irrespective of the pulse sequence. Gibbs ringing manifests as duplication or ringing of sharp edge structures, like cerebrospinal fluid (CSF). To reduce Gibbs ringing artifacts, raw data is routinely filtered or apodized, effectively suppressing the peripheral regions and consequently attenuating high-resolution structures. However, suppression of Gibbs ringing through raw data filtering comes at a cost in image sharpness or spatial resolution. This delicate balance of Gibbs ringing suppression and spatial resolution is a well-known tradeoff in MR imaging.
One image quality metric that is often used to describe image quality is SNR. In MR, there are multiple sources of noise, such as thermal and electrical noise, which impacts the raw data that is collected. Noise in raw data translates into noise in the final image. The typical approach to improving SNR is to perform multiple averaging, which comes at the expense of prolonged scan time, or to increase the voxel volume at the expense of lower spatial resolution. Other hardware-related solutions to improve SNR include using a higher field strength, quality surface coils and low-noise receiver components, which add to overall system cost.
MR users have become familiar with managing the tradeoff and compromise with respect to spatial resolution, SNR and scan time with conventional MR image reconstruction. In some facilities, this tradeoff has led to multiple imaging protocols. Compounding this is the increased pressure to meet ever demanding schedules and the need to manage variables such as patient shape, size and level of cooperation. Re-scans and patient callbacks are no longer options for managing unexpected results.

Enter AIR™ Recon DL
What if there was an alternative to conventional MR image reconstruction where the user did not have to choose between spatial resolution, SNR or scan time? Well, now there is. In 2020, GE Healthcare introduced AIR™ Recon DL, an algorithm that is embedded in the MR image reconstruction pipeline1, where a neural network model is applied to remove noise and Gibbs ringing artifacts prior to final image formation. The network employs a cascade of over 100,000 unique pattern recognitions for noise and low resolution to reconstruct only the ideal object image.
AIR™ Recon DL performs two separate functions within the MR image reconstruction pipeline: ringing suppression and SNR improvement. These provide for clinical benefits such as scan time reduction, sharper images, greater tolerance of protocol variations and images that are easier and faster to read.
With AIR™ Recon DL’s Intelligent Ringing Suppression, part of the reconstruction-embedded deep neural network, the tradeoff of ringing suppression for spatial resolution is avoided by making images sharper and having higher spatial resolution. As such, the clinically acceptable voxel volumes for AIR™ Recon DL are larger than for conventional reconstructed images.
Based on a phantom study for equivalent spatial resolution, it is estimated that the AIR™ Recon DL in-plane voxel dimension can be approximately 1.4 times larger than that of the conventional image. This 1.4 factor is consistent with an independent study that found a factor of 1.6, based on edge gradient analysis1. Results from this phantom study suggest that a lower in-plane matrix setting can be used with AIR™ Recon DL to obtain equivalent spatial resolution and image sharpness as a conventional image, independent of the SNR improvement.

A

B

C

D
Figure 1.
AIR™ Recon DL Intelligent Ringing Suppression for sharper images as demonstrated in an imaging phantom. (A) Conventional image reconstruction with apodization still results in significant Gibbs ringing. (B) Magnified A showing ringing and a loss of fine detail in the circular structures. (C) The same raw data as reconstructed using AIR™ Recon DL shows elimination of Gibbs ringing artifacts and (D) considerably sharper images. Note that the AIR™ Recon DL images also show the added benefit of noise reduction, however, this is considered unrelated to the improved sharpness of the images.
Addressing the tradeoff
AIR™ Recon DL provides a solution to the tradeoff with SNR, spatial resolution and scan time. To begin, SNR is usually thought of as an output metric of the image, which depends on various input protocol settings of the MR scan such as voxel volume (e.g., spatial resolution) and number of averages (e.g., scan time). There generally is no direct SNR parameter; SNR simply results from the selected MR parameters.
SNR is directly dependent on voxel volume, which is the product of the in-plane pixel dimensions with slice thickness. Voxel volume is typically used to characterize the prescribed spatial resolution. It is generally intuitive to most MR users that the larger the signal-bearing voxel volume, the greater the SNR and that this dependence is linear, i.e., if the voxel volume doubles then the SNR doubles.
In MR imaging, the most common way to increase SNR is to acquire additional signal averages or excitations, effectively collecting more raw data. Unfortunately, due to the nature of MR noise statistics, a doubling of the number of excitations (NEX) only results in a square root 2 increase in the resultant SNR. The well-known relationship is that SNR varies as the square root of the total scan time.
Acceptable clinical protocols are those that simultaneously meet three criteria: SNR, spatial resolution and scan time. Figure 2A is an example of conventional reconstruction. Given a clinically acceptable SNR level, as indicated by the red contour line, any protocol with a larger voxel volume or longer scan time will result in higher SNR. However, the acceptable clinical protocol is also bounded by the clinical spatial resolution threshold (vertical dotted line) and clinical scan time threshold (horizontal dotted line), leaving the only clinical acceptable protocols as being those in the red triangular shaped region in Figure 2A.
We can redraw the protocol space for AIR™ Recon DL to see how the SNR gain and improved image sharpness manifest in the protocol space. As shown in Figure 2B, the SNR contour with AIR™ Recon DL is shifted lower for scan time and voxel volume due to the SNR advantage over conventional reconstruction. To clarify, the red contour in Figure 2A and the blue contour in Figure 2B represent the same clinically acceptable SNR, however, AIR™ Recon DL delivers this with shorter scan times and smaller voxel volumes. Also note the positioning of the clinical resolution threshold (vertical dotted line) as being further to the right on Figure 2B compared to Figure 2A. This reflects AIR™ Recon DL’s Intelligent Ringing Suppression that can deliver equivalently sharp images with larger voxel volumes.

A

B
Figure 2.
Expanded clinical protocol space with AIR™ Recon DL. (A) Conventional reconstruction with the clinically acceptable SNR contour, as indicated in red, the only protocol combinations of voxel volume and scan time that are simultaneously clinically acceptable for SNR, scan time and spatial resolution is the triangular area in red. (B) An expanded protocol space with AIR™ Recon DL reconstruction showing the clinically acceptable SNR contour to be shifted lower and the clinically acceptable resolution threshold is further to the right, compared to conventional reconstruction in (A, red solid and dotted lines). The area in blue represents more protocol combinations of voxel volumes and scan times that are clinically acceptable for SNR, scan time and spatial resolution with AIR™ Recon DL.
AIR™ Recon DL reconstruction allows for an expanded protocol space, or more protocol combinations of voxel volumes and scan times that are clinically acceptable for SNR, scan time and spatial resolution.
Users have the freedom to select their own level of SNR improvement through a user interface that provides a low, medium or high setting. It is anticipated that, once familiar with the product, users will choose to use the AIR™ Recon DL high setting.
Benefits and early adopter feedback
There are many benefits to AIR™ Recon DL which extend to clinical, operational and financial aspects of MR imaging. Clinical benefits are best demonstrated with images that span multiple anatomies, which compare AIR™ Recon DL to conventional image reconstruction and are shown in Figures 3-6.
Figure 3.
SNR improvement with AIR™ Recon DL. Shown is a short axis T2 Double IR black-blood FatSat breath-hold scan, 1.3 x 1.4 x 6 mm, 2:13 min. scan time with 11 sec. breath hold. (A, B) Conventional image reconstruction and (C, D) AIR™ Recon DL high setting of the same raw data showing considerable SNR improvement.

A

B
Figure 4.
Sharper images with AIR™ Recon DL. Shown is a coronal FSE PDw, 0.3 x 0.3 x 1.0 mm of the first metatarsal. (A) Conventional image reconstruction and (B) AIR™ Recon DL high setting of the same raw data (same matrix and scan time) showing sharper trabecular structure.

A

B
Figure 5.
Lumbar spine exam demonstrating (A) conventional reconstructed image, 0.9 x 1.3 x 3 mm, BW 32.2 kHz, NEX 2, 2:47 min. and (B) AIR™ Recon DL reconstructed image, 0.7 x 0.9 x 3 mm, BW 41.7 kHz, NEX 1, 1:16 min.

A

B
Figure 6.
Shoulder exam demonstrating a 46 percent improvement in resolution and a 36 percent reduction in scan time with AIR™ Recon DL. (A) Conventional reconstructed image, 0.4 x 0.6 x 3 mm, BW 41.7 kHz, NEX 1, 2:14 min. and (B) AIR™ Recon DL reconstructed image, 0.3 x 0.5 x 3 mm, BW 62.5 kHz, NEX 1, 1:33 min.
Operationally, it is expected that AIR™ Recon DL will lead to more predictable patient scheduling as a result of fewer repeat scans and shorter scan times. This may also allow for disinfection time between patients during the COVID-19 pandemic. The scan time savings and more consistent image quality may help reduce stress among the MR technologists and radiographers.
Of the thousands of cases collected with both conventional and AIR™ Recon DL reconstructions, no pathologies were reported to have been missed compared to the conventional reconstructed images§. In addition, no instances were identified where structures were hallucinated with AIR™ Recon DL.
Anatomical coverage is also a key consideration and can sometimes be dependent on the training of the DL algorithm. AIR™ Recon DL is compatible with all anatomies.
GE provides users the capability to generate the conventional reconstruction images for comparison with AIR™ Recon DL images, which can be useful for establishing clinical confidence during the initial phase of familiarity.
As AIR™ Recon DL makes use of raw data and is integrated in the reconstruction pipeline, it delivers images to the MR console in real-time, allowing the MR technologist to assess the image quality while the patient is still on the table.
In summary, AIR™ Recon DL offers many clinical benefits over conventional image reconstruction, including increased SNR and sharper images due to the Intelligent Ringing Suppression, as demonstrated on both phantom and in vivo. Functioning on raw data, AIR™ Recon DL can help users manage the delicate balance between spatial resolution, SNR and scan time. With an understanding of the relationship between SNR, voxel volume and scan time, AIR™ Recon DL can significantly expand the clinically useable protocol space, allowing users more freedom and flexibility in prescribing MR scans to suit their needs.
‡‡Based on an early adopter survey of 21 radiologists from 11 different sites and 6 different countries.