result
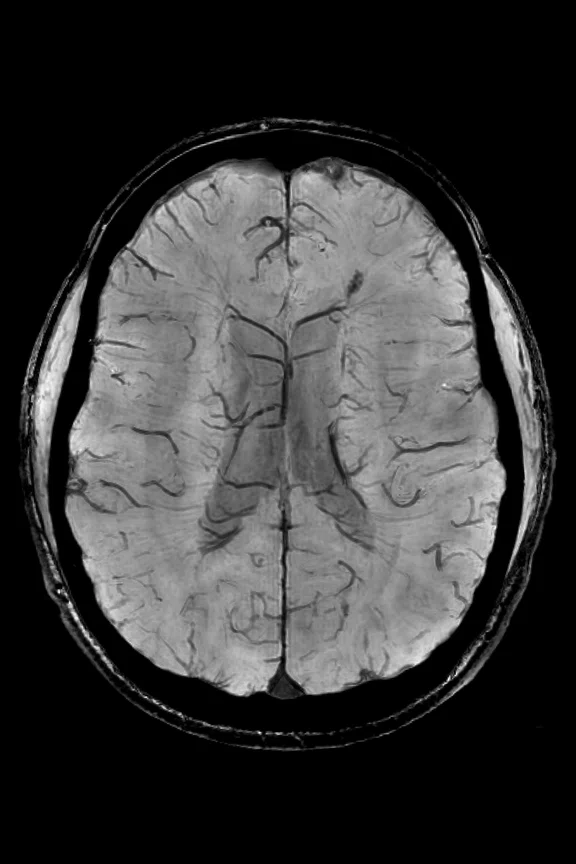
A
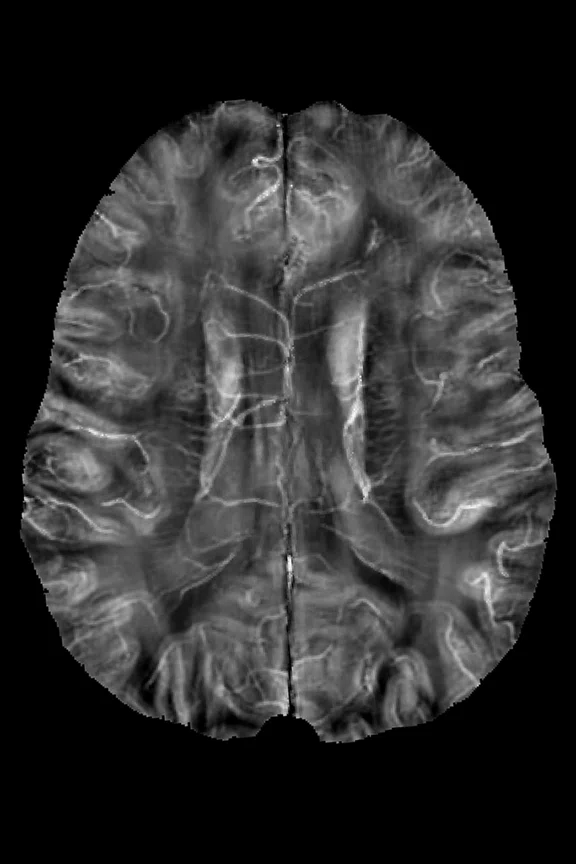
Figure 2.
(A) SWAN minimal intensity projection and (B) QSM summation projection images with 8 mm thickness.
B
Figure 2.
(A) SWAN minimal intensity projection and (B) QSM summation projection images with 8 mm thickness.
2. Deh K, Ponath GD, Molvi Z, et al. Magnetic susceptibility increases as diamagnetic molecules breakdown: Myelin digestion during multiple sclerosis lesion formation contributes to increase on QSM. J Magn Reson Imaging. 2018 Nov;48(5):1281-1287.
‡Technology in development and not cleared for clinical use on SIGNA™ 7.0T in the US or any other country.
1. Liu T, Eskreis-Winkler S, Schweitzer AD, et al. Improved subthalamic nucleus depiction with quantitative susceptibility mapping. Radiology. 2013 Oct;269(1):216-23.
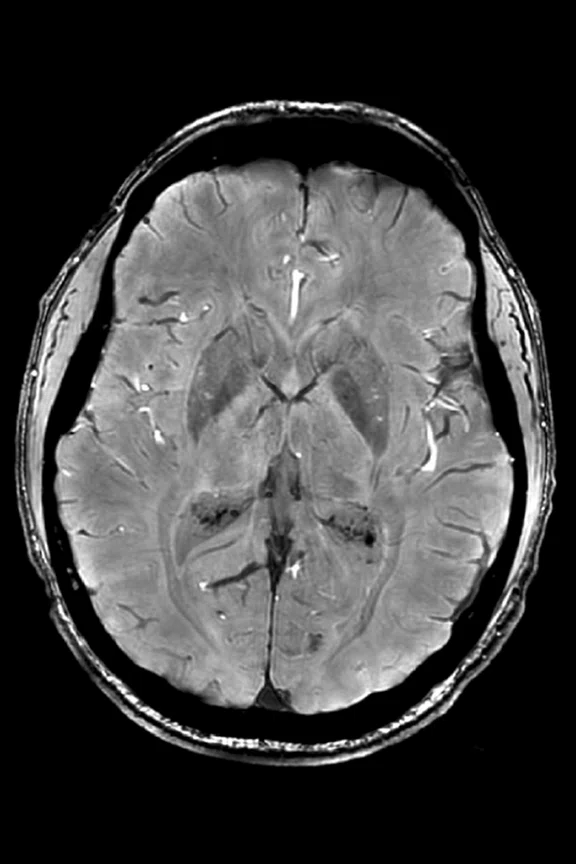
A
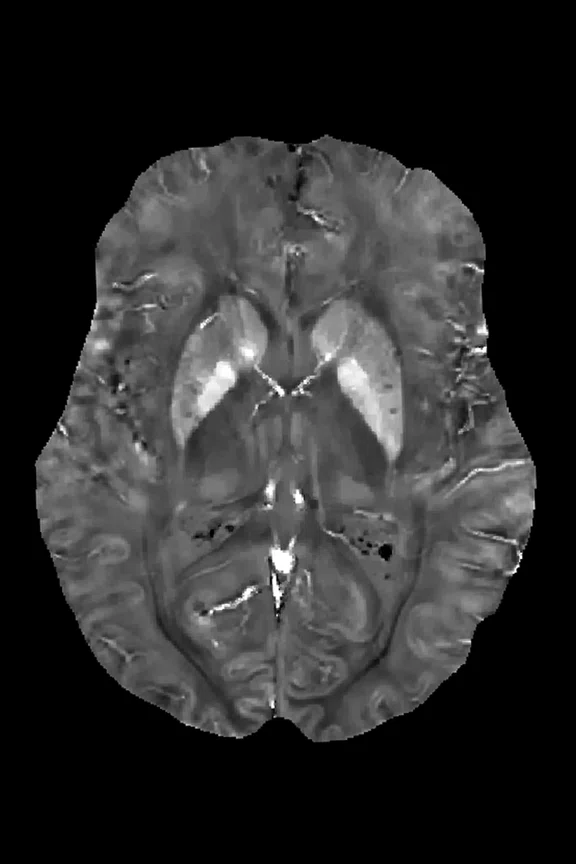
Figure 1.
(A) SWAN and (B) QSM images show an axial section through the mid brain (basal ganglia iron, ventricle calcification).
B
Figure 1.
(A) SWAN and (B) QSM images show an axial section through the mid brain (basal ganglia iron, ventricle calcification).
‡‡Not yet CE marked. Not available for sale in all regions.
3. Ndayisaba A, Kaindlstorfer C, Wenning GK. Iron in Neurodegeneration - Cause or Consequence?. Front Neurosci. 2019 Mar 1;13:180.
**Investigational device. Not 510(k)-cleared and not for sale in any region.
‡Technology in development and not cleared for clinical use on SIGNA™ 7.0T in the US or any other country.


PREVIOUS
${prev-page}
NEXT
${next-page}
Subscribe Now
Manage Subscription
FOLLOW US
Contact Us • Cookie Preferences • Privacy Policy • California Privacy PolicyDo Not Sell or Share My Personal Information • Terms & Conditions • Security
© 2024 GE HealthCare. GE is a trademark of General Electric Company. Used under trademark license.
TECH TRENDS
Quantitative susceptibility mapping at 7.0T
Quantitative susceptibility mapping at 7.0T
In MR imaging, the main magnetic field induces paramagnetic or diamagnetic magnetization in tissue, and this tissue magnetization generates its own magnetic field, which affects the MR signal. This tissue magnetic field determines the phase evolution and the magnitude T2* decay time.
Techniques such as susceptibility- weighted imaging (SWI) and T2*-weighted magnitude and phase images only provide non-local tissue susceptibility effects known as blooming artifacts, because the field at a location is a summation of contributions from all surrounding susceptibility sources. Quantitative Susceptibility Mapping (QSM)‡ is a new MR contrast mechanism that is being investigated for use in providing a map of local tissue magnetic susceptibility.
Yi Wang, PhD, the Faculty Distinguished Professor in the Department of Radiology, Director of MRI Research Institute Radiology, tenured Professor of Physics in Radiology at Weill Cornell Medicine and Professor of Biomedical Engineering at Cornell University, leads the Cornell MRI Lab that has pioneered QSM.
“QSM is designed to solve the ill-posed inverse problem from magnetic field to tissue susceptibility distribution using additional morphology information,” Dr. Wang says. He has used QSM to quantitatively map exogenous contrast agents, such as gadolinium or iron oxide nanoparticles, and endogenous contrast agents, such as iron and calcium depositions. In the brain, the QSM image can allow visualization of deoxyheme iron in the capillaries and veins, ferritin iron in deep gray nuclei neurons and in multiple sclerosis (MS) lesions, hemosiderin iron in microbleeds and hemorrhages, and calcification in the ventricles and malformations.
Dr. Wang’s lab is working with neurosurgeons, neurologists, neuroradiologists and neuroscientists at Weill Cornell to map iron distribution in deep gray nuclei for guiding deep brain stimulation; map iron deposition in neurodegenerative diseases, such as MS and Parkinson’s disease (PD) and Alzheimer’s disease (AD); evaluate oxygen metabolism in ischemic strokes and tumors; and assess blood products in hemorrhagic stroke and cerebral microhemorrhage. Currently, all GE Healthcare 3.0T scanners at Weill Cornell have the automated QSM research prototype capability. In a comparison study using 3.0T MR in the Cornell MRI Research Lab1, the contrast-to-noise ratio (CNR) for mapping brain iron increased by 10-fold using QSM compared to conventional T2-weighted images.
Susceptibility-Weighted ANgiography (SWAN), a GE commercially-available sequence, is part of each 3.0T MR neuroimaging protocol at Weill Cornell, and Dr. Wang believes the SWAN acquisition with phase or complex data work well for QSM post-processing. For example, QSM processed from SWAN complex data may help identify new MS lesions without gadolinium injection. As new MS lesions form, macrophages are involved in digesting diamagnetic myelin while the blood brain barrier (BBB) is open. The process causes a susceptibility increase that may be monitored with QSM2.
“We may actually get more information with QSM than with gadolinium enhancement for monitoring MS patients,” he explains. “The neurodegenerative aspect of MS involves smoldering inflammation behind the sealed BBB, which cannot be assessed by gadolinium. We may use QSM to map the iron in the proinflammatory activated microglia in these MS lesions.”
Early research indicates that in AD and PD patients, the microglia containing iron is activated and this process is believed to be a catalyst accelerating neurodegeneration3. Dr. Wang is also exploring SWAN and QSM to map deoxyheme iron in red blood cells, which may be useful for detecting reduced regional oxygen consumption in AD and stroke patients.
Because much of neuroimaging involves microscopic cells and molecules, Dr. Wang sees tremendous potential for high resolution at ultra-high field MR imaging, such as the recently FDA-cleared SIGNA™ 7.0T‡‡.
“7.0T MR is well-suited for QSM research because of the increase in magnetic signals, the higher SNR and the ability to see many other contrasts,” Dr. Wang says. He adds that 7.0T with QSM may provide the high-resolution information on contrasts from iron in the deep brain nuclei that surgeons need for precision in deep brain stimulation, for example. The higher resolution at 7.0T enables better evaluation and characterization of small MS lesions in white matter and gray matter using QSM.
In addition to the increase in SNR and spatial resolution, 7.0T can be used to shorten scan times. He compared QSM at 3.0T with 10 echoes and at 7.0T with 5 echoes and found them quantitatively comparable. However, the 7.0T 5-echo acquisition took less than half the scan time as the 3.0T 10- echo – from 6 minutes and 36 seconds down to 2 minutes and 51 seconds.
Dr. Wang recently had the opportunity to evaluate the new SIGNA™ 7.0T scanner at GE’s MR headquarters in Waukesha, WI. He found the software and user interface easy to use, taking a similar amount of time at 7.0T as 3.0T to set up the protocol, which is much less than GE’s prior generation, the Discovery™ MR950** research-only 7.0T system.
In summary, Dr. Wang says 7.0T MR may be an effective tool to map iron in the microglia for inflammation, iron in the neurons for neurodegeneration and iron in red blood cells for oxygen consumption.
The best of advanced MR technology for research and clinical needs
The SIGNA™ 7.0T is a great fit for facilities that conduct research but are also in need of an option to do clinical scanning. On the clinical side, this scanner shines with the power to image the head and extremities. For research, advanced capabilities with state-of-the-art applications elevate high-field imaging to help researchers meet their goals.
The SIGNA™ 7.0T boasts new technology that allows the scanner to overcome common challenges associated with operating at a higher field strength. This new technology includes UltraG, GE's newest and most powerful whole-body gradient technology, advanced shimming and a Precision RF chain. These new features are then combined with the best of GE’s existing advanced MR technology - such as the SuperG gradient amplifiers and gradient drivers from the SIGNA™ Premier 3.0T and the zero boil-off actively-shielded 7.0T magnet from the Discovery™ MR950 research-only system. The magnet, the result of a partnership with Tesla Engineering in Storrington, UK, delivers top-of-the-line performance, uniformity and stability.
The system features a new 60 cm gradient coil with a large (>45 cm) FOV capability. It is torque balanced to significantly lower vibrations and acoustics and is also designed for uniform heat dissipation and thermal control. Because the coil doesn’t interact with the magnet, the system can deliver a complete performance solution at a higher operating point.
In addition to the UltraG gradient platform, the system features a Precision RF transmitter architecture with two modes, clinical and research‡. In clinical mode, the system transmits on two channels, giving the facility flexibility in optimizing the system for uniformity and pushing the system to get the most of its 7.0T capabilities. The SIGNA™ 7.0T RF transmit architect includes two 7.5kW RF power amplifiers, with capabilities to optimize phase and amplitude for improved uniformity, regardless of patient shape size and/or body habitus.


