A
Figure 1.
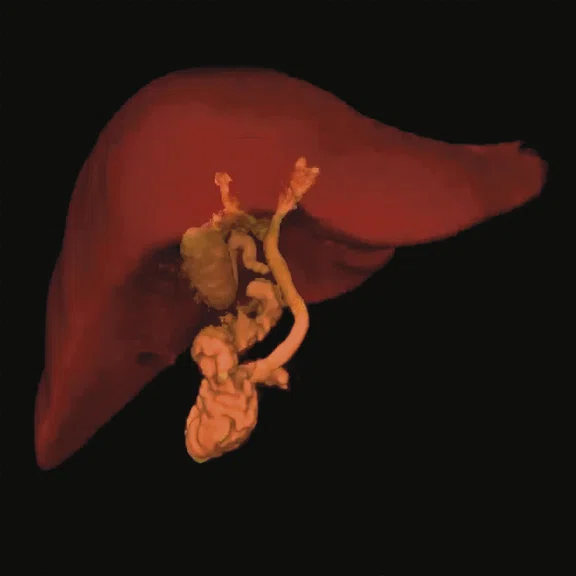
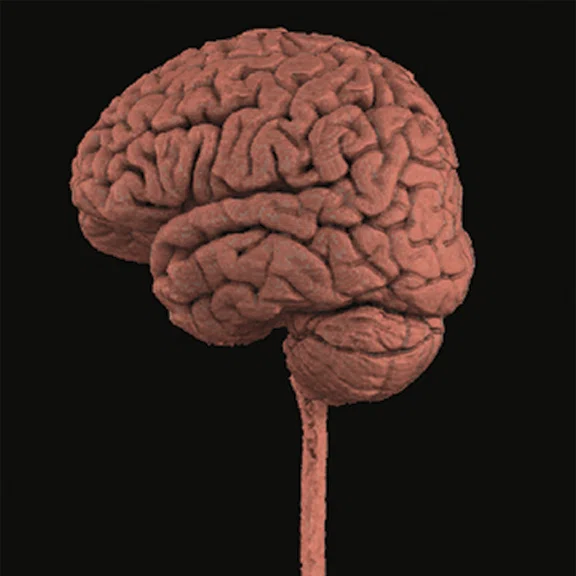
AW Volume Viewer with Volume Illumination delivers a richer, more humanistic, volume-rendered viewing experience.
B
Figure 1.
AW Volume Viewer with Volume Illumination delivers a richer, more humanistic, volume-rendered viewing experience.
1. Mills AF, Sakai O, Anderson SW, Jara H. Principles of Quantitative MR Imaging with Illustrated Review of Applicable Modular Pulse Diagrams. Radiographics. 2017;37(7):2083–2105. doi:10.1148/rg.2017160099.
2. Rosenkrantz AB, Mendiratta-Lala M, Bartholmai BJ, et al. Clinical utility of quantitative imaging. Acad Radiol. 2015;22(1):33–49. doi:10.1016/j.acra.2014.08.011.
3. Quantitative Imaging Biomarkers Alliance. RSNA. Available at: https://www.rsna.org/en/research/quantitative-imaging-biomarkers-alliance.
4. Based on double blinded survey with 142 global radiologists. 2019. Data on file at GE.
4. Based on double blinded survey with 142 global radiologists. 2019. Data on file at GE.
4. Based on double blinded survey with 142 global radiologists. 2019. Data on file at GE.
A
Figure 2.
READY View is designed to help improve productivity and accuracy through factory protocols, as in the example above (top), showing spectroscopy review steps of READY View. It also adapts to user preferences through custom hanging protocols, as shown in the example of a 3D Cube scan (bottom) with multiplanar reconstructions. Custom protocols can decrease the time and enhance precision when interpreting MR images.
B
Figure 2.
READY View is designed to help improve productivity and accuracy through factory protocols, as in the example above (top), showing spectroscopy review steps of READY View. It also adapts to user preferences through custom hanging protocols, as shown in the example of a 3D Cube scan (bottom) with multiplanar reconstructions. Custom protocols can decrease the time and enhance precision when interpreting MR images.
A
Figure 3.
Time course curves provide information on lesion characteristics and treatment response.
B
Figure 3.
Time course curves provide information on lesion characteristics and treatment response.
A
Figure 4.
(A) Advanced measurement tools allow the radiologist to segment anatomy, in this case a liver, and then reformat into (B) oblique, (C) coronal and (D) sagittal views that can then be measured for a comprehensive evaluation.
B
Figure 4.
(A) Advanced measurement tools allow the radiologist to segment anatomy, in this case a liver, and then reformat into (B) oblique, (C) coronal and (D) sagittal views that can then be measured for a comprehensive evaluation.
C
Figure 4.
(A) Advanced measurement tools allow the radiologist to segment anatomy, in this case a liver, and then reformat into (B) oblique, (C) coronal and (D) sagittal views that can then be measured for a comprehensive evaluation.
D
Figure 4.
(A) Advanced measurement tools allow the radiologist to segment anatomy, in this case a liver, and then reformat into (B) oblique, (C) coronal and (D) sagittal views that can then be measured for a comprehensive evaluation.
6. IMV 2018 MR Market Outlook report. Available at www.imvinfo.com.
5. American Cancer Society. Global Cancer Facts & Figures. Available at: https://www.cancer.org/research/cancer-facts-statistics/global.html.
6. IMV 2018 MR Market Outlook report. Available at www.imvinfo.com.
‡510(k) pending at FDA. Not available for sale.
A
Figure 5.
PROView provides easy and intuitive guided workflow and multiparametric assessment of the prostate for reviewing, scoring and reporting. The deep-learning-based Auto Segmentation‡ is designed for automated contouring and measurement of the prostate gland. The PROView report can be exported into HTML format for easy editing and/or intergrated into dictation software.
B
Figure 5.
PROView provides easy and intuitive guided workflow and multiparametric assessment of the prostate for reviewing, scoring and reporting. The deep-learning-based Auto Segmentation‡ is designed for automated contouring and measurement of the prostate gland. The PROView report can be exported into HTML format for easy editing and/or intergrated into dictation software.
A
Figure 6.
From a single scan, MAGiC automatically post-processes (A) T1, T2, PD, T1 FLAIR, T2 FLAIR‡‡, STIR, DIR and PSIR, as well as (B) T1, PD and T2 quantitative (parametric) maps. Images were processed from a MAGiC axial scan, 0.7 x 0.9 x 0.5 mm, 4:00 min.
B
Figure 6.
From a single scan, MAGiC automatically post-processes (A) T1, T2, PD, T1 FLAIR, T2 FLAIR‡‡, STIR, DIR and PSIR, as well as (B) T1, PD and T2 quantitative (parametric) maps. Images were processed from a MAGiC axial scan, 0.7 x 0.9 x 0.5 mm, 4:00 min.
7. Abeysekera KWM, Fernandes, GS, Hammerton G, et al. Prevalence of steatosis and fibrosis in young adults in the UK: a population-based study. Lancet Gastroenterol Hepatol. March, 2020;5(3):295-305. DOI: 10.1016/S2468-1253(19)30419-4.
8. Schwimmer JB, Deutsch R, Kahen T, Lavine JE, Stanley C, and Behling C. Prevalence of fatty liver in children and adolescents. Pediatrics. 2006;118(4):1388–1393. doi: 10.1542/peds.2006-1212.
‡‡It is recommended to acquire conventional T2 FLAIR images in addition to MAGiC.
A
Figure 7.
Quantib Brain is a critical tool for the longitudinal clinical assessment of neurological conditions. (A, B) Brain tissue volume segmentation provides information on white matter (purple), grey matter (green) and CSF (red). (C, D) White matter hyperintensity (WMH) segmentation data includes consistent WMH (yellow), disappearing WMH (blue) and new WMH (pink). (E) Longitudinal report generated by Quantib.
B
Figure 7.
Quantib Brain is a critical tool for the longitudinal clinical assessment of neurological conditions. (A, B) Brain tissue volume segmentation provides information on white matter (purple), grey matter (green) and CSF (red). (C, D) White matter hyperintensity (WMH) segmentation data includes consistent WMH (yellow), disappearing WMH (blue) and new WMH (pink). (E) Longitudinal report generated by Quantib.
C
Figure 7.
Quantib Brain is a critical tool for the longitudinal clinical assessment of neurological conditions. (A, B) Brain tissue volume segmentation provides information on white matter (purple), grey matter (green) and CSF (red). (C, D) White matter hyperintensity (WMH) segmentation data includes consistent WMH (yellow), disappearing WMH (blue) and new WMH (pink). (E) Longitudinal report generated by Quantib.
D
Figure 7.
Quantib Brain is a critical tool for the longitudinal clinical assessment of neurological conditions. (A, B) Brain tissue volume segmentation provides information on white matter (purple), grey matter (green) and CSF (red). (C, D) White matter hyperintensity (WMH) segmentation data includes consistent WMH (yellow), disappearing WMH (blue) and new WMH (pink). (E) Longitudinal report generated by Quantib.
E
Figure 7.
Quantib Brain is a critical tool for the longitudinal clinical assessment of neurological conditions. (A, B) Brain tissue volume segmentation provides information on white matter (purple), grey matter (green) and CSF (red). (C, D) White matter hyperintensity (WMH) segmentation data includes consistent WMH (yellow), disappearing WMH (blue) and new WMH (pink). (E) Longitudinal report generated by Quantib.
5American Cancer Society. Global Cancer Facts & Figures. Available at: https://www.cancer.org/research/cancer-facts-statistics/global.html.
A
Figure 8.
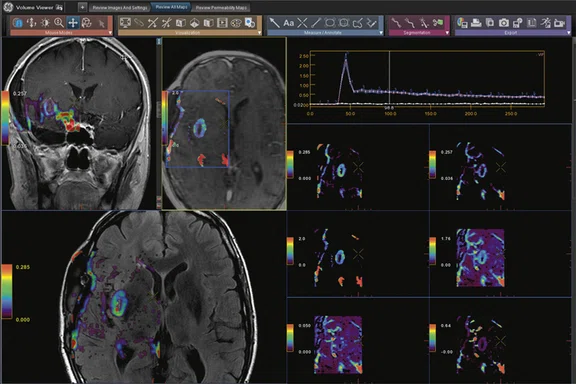
GenIQ uses rapid 3D T1 perfusion (LAVA, VIBRANT or DISCO) data to provide a quantitative, noninvasive approach to help grade and diagnose tumors.
A
Figure 9.
ViosWorks 4D Flow provides flow velocity and direction of flow information for (A) valvular and (B) congenital heart disease.
B
Figure 9.
ViosWorks 4D Flow provides flow velocity and direction of flow information for (A) valvular and (B) congenital heart disease.
9. Salerno M, Sharif B, Arheden H, et al. Recent Advances in Cardiovascular Magnetic Resonance: Techniques and Applications. Circ Cardiovasc Imaging. 2017;10(6):e003951. doi:10.1161/CIRCIMAGING.116.003951.
9. Salerno M, Sharif B, Arheden H, et al. Recent Advances in Cardiovascular Magnetic Resonance: Techniques and Applications. Circ Cardiovasc Imaging. 2017;10(6):e003951. doi:10.1161/CIRCIMAGING.116.003951.
A
Figure 10.
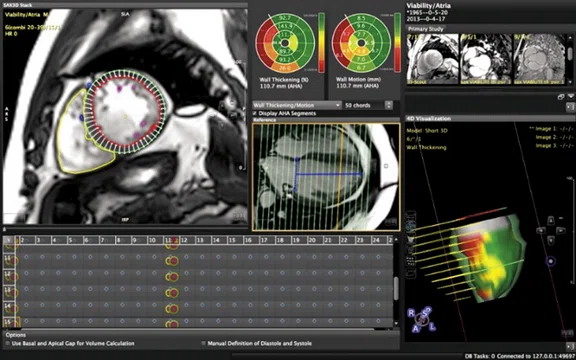
The deeplearning-based contour detection capability of cvi42 provides comprehensive cardiac post-processing for basic and advanced clinical cardiac evaluations.
result


‡510(k) pending at FDA. Not available for sale.
‡‡ It is recommended to acquire conventional T2 FLAIR images in addition to MAGiC.
PREVIOUS
${prev-page}
NEXT
${next-page}
Subscribe Now
Manage Subscription
FOLLOW US
Contact Us • Cookie Preferences • Privacy Policy • California Privacy PolicyDo Not Sell or Share My Personal Information • Terms & Conditions • Security
© 2024 GE HealthCare. GE is a trademark of General Electric Company. Used under trademark license.
TECH TRENDS
Advanced visualization applications for quantitative MR imaging
Advanced visualization applications for quantitative MR imaging
by Heide Harris, RT(R)(MR), Global Product Marketing Director, MR Applications and Visualization, and Steve Lawson, RT(R)(MR), Global MR Clinical Marketing Manager
Quantitative imaging has been described as the next evolution in MR imaging, with the potential for improved diagnostic accuracy and workflow1. As medicine moves toward personalized/precision healthcare, it is expected that there will be an increased demand for quantitative imaging, both in MR and in other imaging modalities. Quantitative imaging helps the radiologist assess the patient’s current condition and provides data for diagnosis, prognosis and therapy planning through biomarkers across a spectrum of disease states2. The Quantitative Imaging Biomarkers Alliance (QIBA) was formed by the RSNA to accelerate the development and adoption of hardware and software standards for accurate and reproducible quantitative imaging results3.
Yet, many radiologists are faced with growing demands to read more studies per hour while juggling more data from these studies, including the desire to quantitate the data. Compounding this situation is that the radiologist may not have seamless access to the latest post-processing technology. MR administrators may hold off on upgrades and updates until the next capital budget plan, which can be years away. Or, the quantitative imaging and post-processing tools the radiologist needs are on a separate workstation, requiring an interruption in their reading workflow. The radiologist may move from reading station to workstations in other areas, suspend reading/reporting to track down images and data, create manual workflows or their own reporting templates, or report the case without extracting all the quantitative clinical information. This disruption leads to inefficiencies, reducing the quality of care and leading to longer report turnaround times.
Also consider that as technology advances so too does obsolescence. In a double-blinded survey of 142 radiologists, 49 percent were using visualization software older than three years4. Across a healthcare system, purchases made over time can result in different capabilities in different locations, making it more difficult to manage software versions and systems. Forty-eight percent of radiologists spend more than 15 minutes each day on non-value add tasks to report a case4. Nearly 2.5 GB of data is transferred per case, often multiple times, with 2.6 errors per day4.
MR visualization applications
At GE Healthcare, advanced visualization starts with the Advantage Workstation (AW) Volume Viewer. It’s the starting block for all postprocessing application for all modalities with customized layouts, basic reformats, MIP and IVI features. The next level is Integrated Registration, a key application for MR-to-MR and multi-modality alignment and fusion, based on a rigid-motion algorithm.
Volume Viewer delivers a rich 3D image processing toolset to create different views and further streamline interpretation and reporting with visualization tools that require minimal clicks and user input. Specifically, tools such as AutoContour provide an automated, two-click measurement of a lesion based on the maximum dimension and volume. The AutoSelect segmentation tool helps to add or remove any continuous structures of interest by a simple point and click. Users can also access advanced segmentation tools like scalpel, threshold and subtraction, which are commonly used to finely tune the image data. The collection of measurements can be captured in the Summary Table that is accessible by date and exported and/or copied into a clipboard for easy communication via email or to embed in reports.
Figure 2.
READY View is designed to help improve productivity and accuracy through factory protocols, as in the example above (top), showing spectroscopy review steps of READY View. It also adapts to user preferences through custom hanging protocols, as shown in the example of a 3D Cube scan (bottom) with multiplanar reconstructions. Custom protocols can decrease the time and enhance precision when interpreting MR images.
Specific to MR is READY View, designed to help improve productivity and accuracy through factory or custom hanging protocols that can decrease the time and enhance precision when interpreting MR images. READY View offers ADC, DTI, T2 Map, R2∗, single and CSI spectroscopy, fusion and multi-parametric review. A multi-parametric MR approach generates zones within a lesion that reflect heterogeneity and often display characteristic patterns. These attributes have proven to be useful in the diagnosis of tumors, monitoring tumor growth and guiding biopsies. Yet, quantifying the information from multi-parametric studies, which often include both a diffusion and perfusion scan, can be very challenging and time consuming. READY View streamlines multi-parametric analysis of MR data sets with multiple images for each scan location. The user experience driven framework offers a combination of protocols and tools that help make quantified analyses of multiple data sets quick and easy.
Integrated with READY View are BodyView and BrainView. BodyView is GE’s primary application for streamlining the review of dynamic MR imaging of the body, including the liver, breast and prostate. It provides algorithms, tools and workflows for processing time series data acquired in the body. It also calculates parametric images from contrast enhanced images based on the temporal evolution of signal intensity before and after contrast. Time course curve shapes can be viewed to determine lesion characteristics and treatment response.
In the brain, spectroscopy, DWI, DTI, Time Course series and functional imaging techniques provide physiological information on metabolism and hemodynamics beyond conventional anatomic and structural imaging data. BrainView combines hemodynamics (BrainStat/ASL) and microstructure (FiberTrak) information for fast characterization of vascular-deficient or vascular-rich brain regions and white matter damage. It includes BrainSTAT AIF/GVF for brain (T2*) perfusion DSC imaging, including leakage indicator maps for more accuate AIF curves in tumor imaging, 3D ASL and FiberTrak (quantitative) in all orientations.
Body visualization
The demand for body imaging in MR continues to rise, particularly in the pelvis and abdomen, liver, prostate and breast. Many body MR procedures are for oncology patients and the global incidence of cancer continues to increase5. As the MR exams become more frequent – a 31 percent increase in the utilization of MR from 2007 to 20186 – and the exams become more complex, the use of advanced quantitative visualization applications becomes more important.
Along with the growing demand for prostate MR imaging, up 23 percent over the last seven years, so too has the need for more efficient tools grown. In fact, according to the 2019 IMV Outlook Report, "fast and focused prostate imaging with improved CAD analysis," was specifically called out as top of mind for customers performing prostate MR imaging6. Building off this growing demand and need, PROView provides easy and intuitive guided workflow and multi-parametric assessment of the prostate for reviewing, scoring and reporting. PROView integrates PI-RADS® v2.1 compliant reporting guidelines to help standardize the MR evaluation of prostate cancer and produces an exportable report for referring physicians. GE anticipates that PROView will utilize deep-learning-based Auto Segmentation‡ that is designed for automated contouring and measurement of the prostate gland. When the information from Auto Segmentation is combined with a patient’s PSA level, it may help determine the PSA density of the prostate, which is relative to its size, to provide consistent results that are critical in a radiologist’s evaluations. PROView is integrated into the Volume Viewer framework and can be incorporated into customized protocols within READY View, for example to generate the ADC map series.
Just as PI-RADS® standardizes prostate MR, BI-RADS® standardizes breast MR. CADstream® is an automated breast reporting, data visualization and segmentation solution that simplifies workflow for characterizing abnormalities accessing prior studies and planning intervention, such as surgery. Extensive visualization options for breast review assists radiologists by accelerating and simplifying the interpretation of large studies like digital breast tomosynthesis. It has a BI-RADS® centric user interface and deep analytic tools including registration and kinetics. CADstream® can be launched from PACS for multiple users and decreased post-processing time.
Figure 5.
PROView provides easy and intuitive guided workflow and multiparametric assessment of the prostate for reviewing, scoring and reporting. The deep-learning-based Auto Segmentation‡ is designed for automated contouring and measurement of the prostate gland. The PROView report can be exported into HTML format for easy editing and/or intergrated into dictation software.
Liver disease, including NAFLD and NASH, is also growing worldwide with one in five young adults and nearly one in 10 children having fatty liver disease7,8. MyLiver Check-up pairs MR Touch and IDEAL IQ with the MRE+ reporting from Resoundant for a comprehensive, non-invasive approach to assessing early liver disease in less than 10 minutes. MRE+ provides automatic ROI placement and calculation, driving consistent results for liver stiffness, fat and iron calculation. MyLiver Check-up provides a rapid, quantitative evaluation of the whole liver that delivers consistent and reproducible results as opposed to selective liver biopsy.
For more information on MyLiver Check-up, visit https://tinyurl.com/yd6zn77j.
Neuro visualization
Neuro imaging has been a staple for MR, with more than half of all exams focused on the spine (26 percent) and the brain (30 percent). Continued growth is expected as MR is being tapped to assess mental health, neurodegenerative, stroke and traumatic brain injury patients. In many cases, neuro MR imaging requires consistency and repeatability across scans to evaluate the progression of disease and response to treatment. For many neurological diseases, multi-parametric techniques and quantitative analysis of the MR imaging data are crucial components guiding patient care decisions.
In one single scan, MAGiC combines the power of the scanning acquisition with powerful processing to automatically deliver T1, T2, PD, T1 FLAIR, T2 FLAIR‡‡, STIR, DIR and PSIR, as well as parametric maps, in approximately 5 minutes of scan time. After the scan, MAGiC generates images of any TR, TE and TI with the flexibility to change image contrasts even after the exam has ended on the MR console or on AW.
Figure 7.
Quantib Brain is a critical tool for the longitudinal clinical assessment of neurological conditions. (A, B) Brain tissue volume segmentation provides information on white matter (purple), grey matter (green) and CSF (red). (C, D) White matter hyperintensity (WMH) segmentation data includes consistent WMH (yellow), disappearing WMH (blue) and new WMH (pink). (E) Longitudinal report generated by Quantib.
Quantib Brain, in conjunction with Quantib B.V., provides a seamless integration of brain volume quantification on the AW and AW Server and delivers a comprehensive, exportable report. Quantib’s deep-learning-based segmentation of the brain for auto labeling, visualization and volumetric quantification of structures, as well as detection of white matter hyperintensities, is based on 3D T1 and T2 FLAIR (3D and 2D) acquisitions. Quantib Brain is a critical tool for the longitudinal clinical assessment of neurological conditions such as age associated neurodegenerative conditions, Alzheimer’s disease or multiple sclerosis.
NeuroQuant from CorTechs Labs is a cloud-based solution that automatically segments, measures and quantifies volumes of brain structures and compares the volumes to a normative database adjusted for age, sex and intracranial volume. It assists with identifying and assessing neurodegeneration in its earliest stages to aid in treatment and lifestyle planning for patients.
For a one-stop-shop fMRI solution from paradigm creation through acquisition to visualization and exporting/reporting, BrainWave is available on the MR scanner or AW. It delivers real time monitoring of data to ensure quality of the acquisition before a patient leaves and fully automates processing – when the exam is done, the images are ready.
Oncology visualization
In 2018, there were an estimated 17 million new cancer cases worldwide and that number is expected to increase to 27.5 million by 20405. MR imaging, including whole-body MR, is increasingly being used to detect and evaluate cancer in the body and the brain due to its high soft-tissue contrast and excellent spatial resolution. In addition to anatomical imaging, MR applications include advanced functional assessment techniques. In oncology, some of these new techniques can provide beneficial information on angiogenesis inhibitors in addition to the tumor size criteria (determined by the World Health Organization) and Response Evaluation Criteria in Solid Tumors (RECIST). Because of its capability to noninvasively measure angiogenesis, dynamic contrast-enhanced MR (DCE-MR) is becoming a standard method for directly assessing the vascular properties in lesions.
GenIQ delivers quantified DCE-MR image analysis and permeability maps to assess vascular properties in lesions. It helps to assess tissue vascular properties in lesions – quantitative pharmacokinetic (PK) modeling – with a contrast-perfusion (dynamic contrast-enhanced) approach to help assess angiogenesis. GenIQ uses rapid 3D T1 perfusion (LAVA, VIBRANT or DISCO) data to provide a quantitative, non-invasive approach to help grade and diagnose tumors. (kTrans is the key quantitative data provided.)
OncoQuant is the multi-modality, multi-time point oncology diagnosis, follow-up, reporting and management tool. Due to the expanding breadth of data associated with today’s oncology studies, reviewing these exams can be time consuming and labor intensive. AW’s OncoQuant application is designed to help organize and display oncology data to facilitate quick review. Both routine comparisons and advanced clinical evaluations may benefit from the OncoQuant workflow to navigate through findings and interact with results.
Cardiovascular visualization
Cardiac MR (CMR) is a valuable tool for assessing a vast array of anatomical and functional cardiac abnormalities, including myocardial edema, myocardial siderosis, myocardial perfusion, diffuse myocardial fibrosis, congenital heart disease, heart failure, cardiac masses, pericardial disease and coronary artery disease9. Continued advances in visualization and image reconstruction techniques may further increase the clinical utility of CMR with 3D volumetric imaging and accelerate image acquisition and quantitative analysis9.
ViosWorks leverages the imaging analytic power of the Arterys™ cloud-based platform to precisely visualize and quantify cardiac flow. It’s platform integrates seamlessly into clinical practice to provide simple and quick cardiac MR imaging data that is uploaded to the cloud for processing, facilitating immediate reconstruction of a 2 mm3 scan and enabling clinical review before the patient gets off the table. It improves patient comfort through a free-breathing 4D Flow scan, simplifies patient set-up with one slab to cover the whole heart and provides precise quantitative measurements that can be accessible from any computer. ViosWorks 4D Flow delivers functional cine information along with flow velocity and direction of flow information.
cvi42 from Circle Cardiovascular Imaging uses artificial intelligence trained algorithms to provide single click results, from basic cardiac assessments to advanced clinical cardiac evaluations. In just seconds, the deep-learning-based contour detection capability of cvi42 provides comprehensive cardiac post-processing on the AW, AW Server or a stand-alone system that saves time with improved reading and reporting efficiency and optimized module performance.
suiteHeart® enables function and flow analyses, time course, delayed enhancement and more; MR VesselIQ Xpress provides 3D visualization, tracks vessel centerline, quantifies abnormalities and enables assessment of vessel tortuosity, longitude and cross section and profile.


