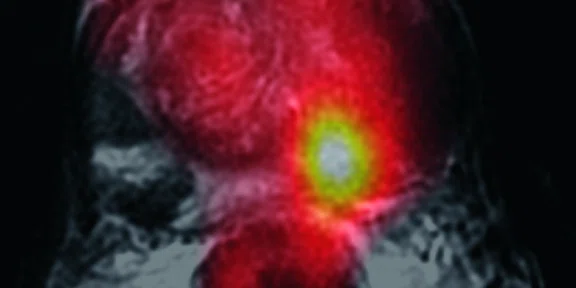
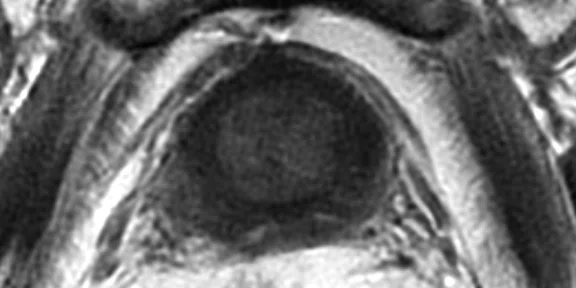
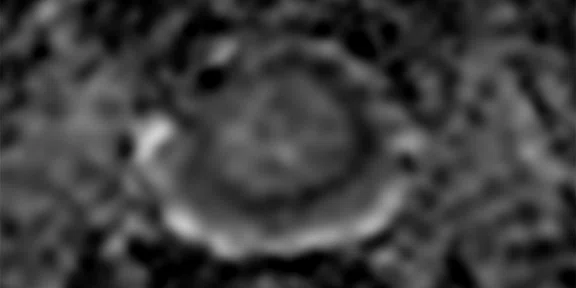
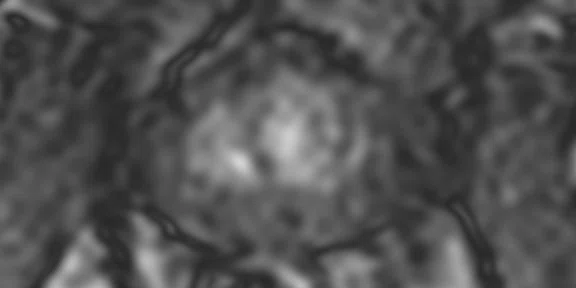
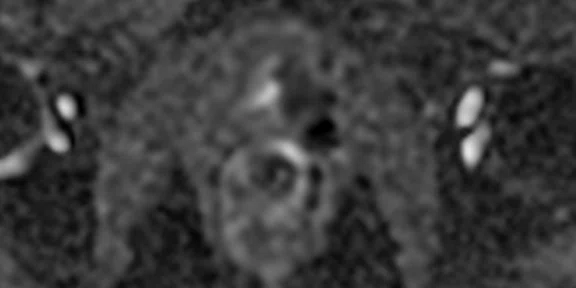
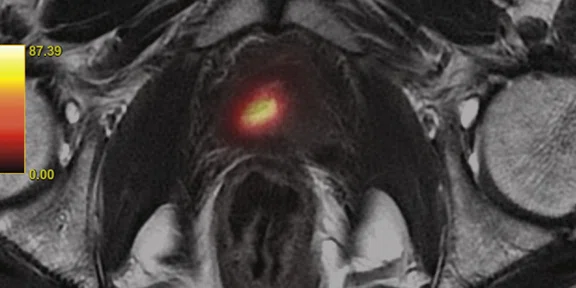
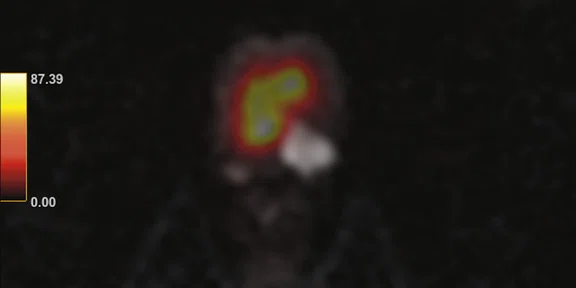
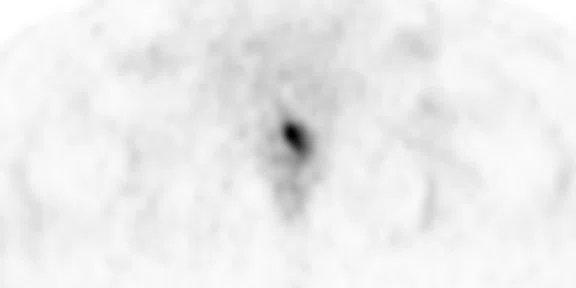
A
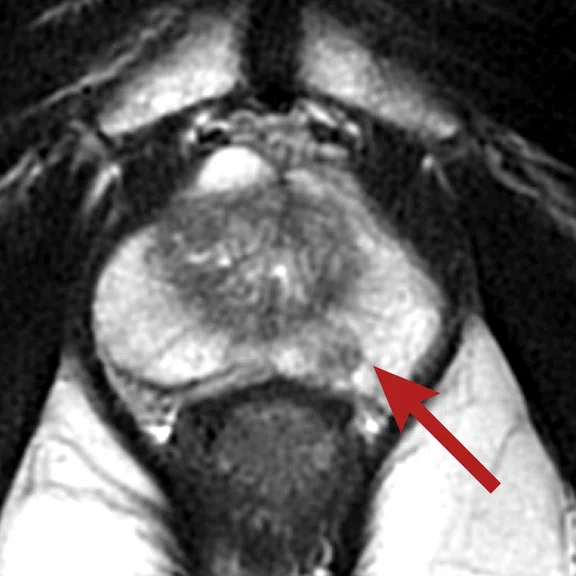
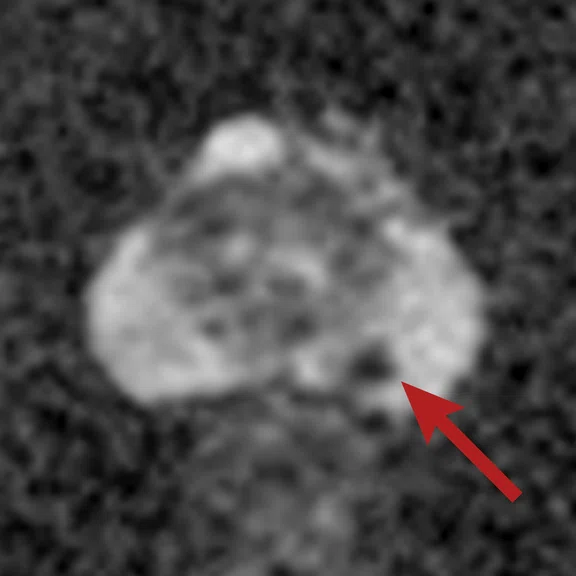
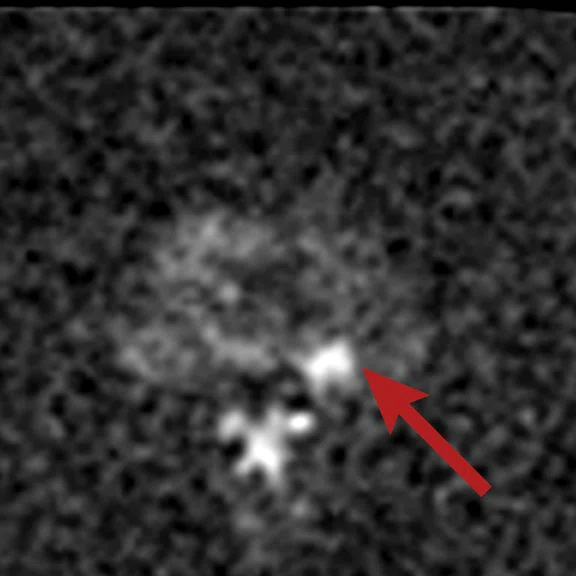
Figure 1.
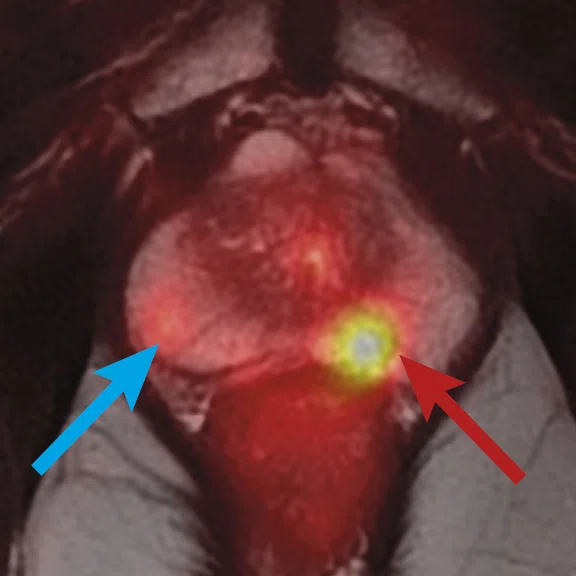
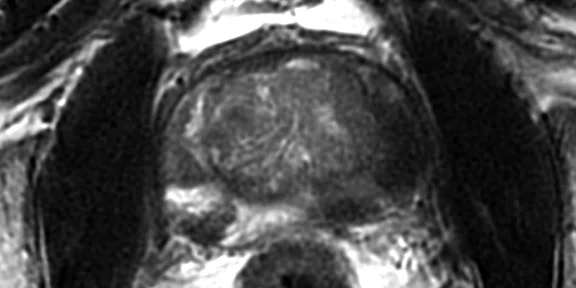
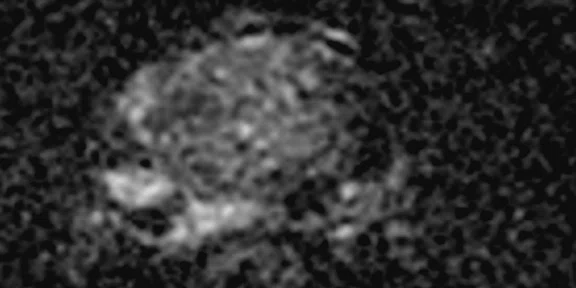
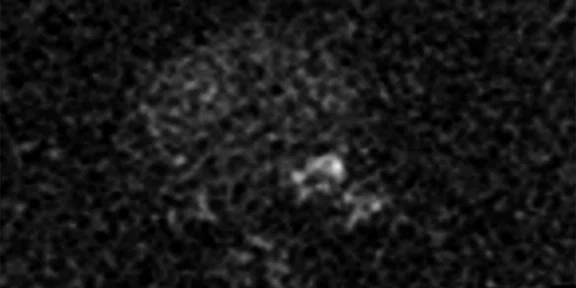
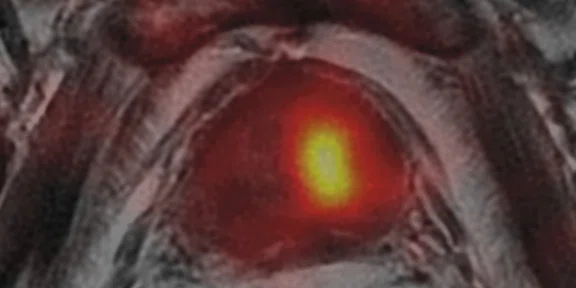
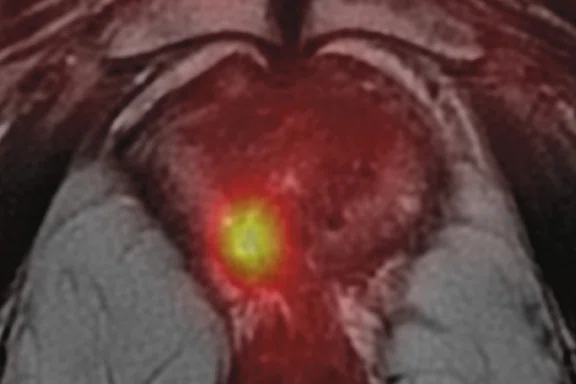
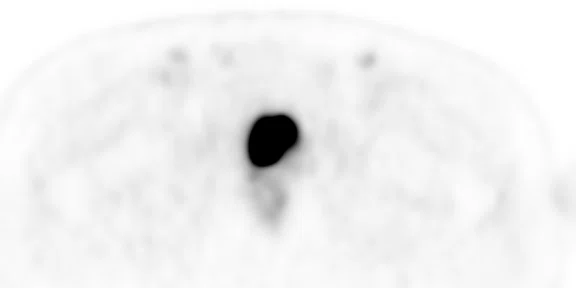
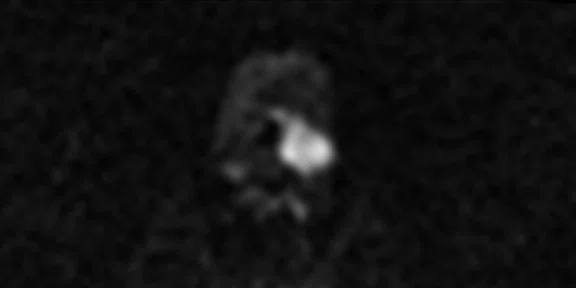
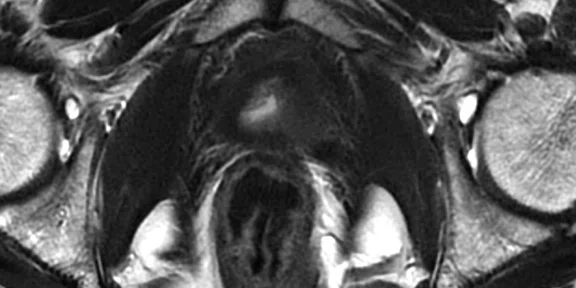
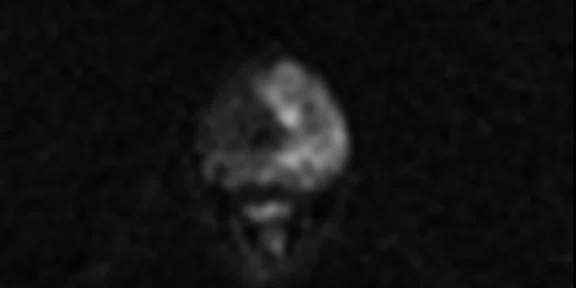
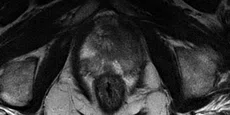
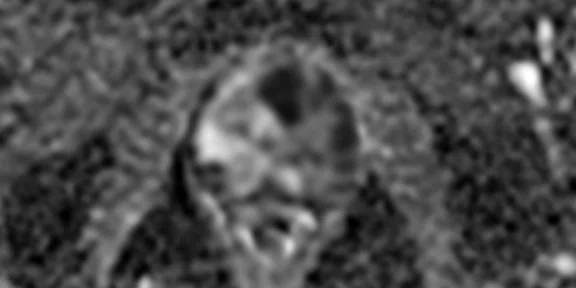
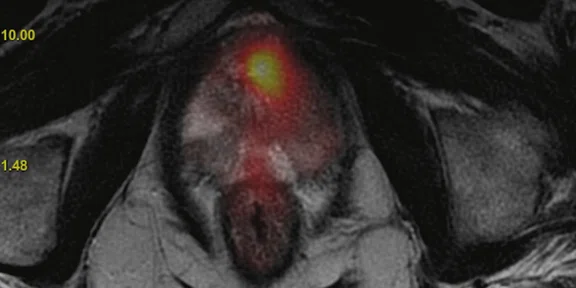
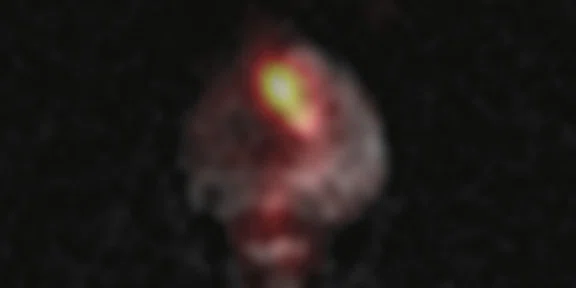
(A) Axial T2w, (B) ADC map, (C) high b-value DWI and (D) 68Ga PSMA PET/MR fused image.
B
Figure 1.
(A) Axial T2w, (B) ADC map, (C) high b-value DWI and (D) 68Ga PSMA PET/MR fused image.
C
Figure 1.
(A) Axial T2w, (B) ADC map, (C) high b-value DWI and (D) 68Ga PSMA PET/MR fused image.
D
Figure 1.
(A) Axial T2w, (B) ADC map, (C) high b-value DWI and (D) 68Ga PSMA PET/MR fused image.
1Kranzbühler B, Müller J, Becker AS, et al. Detection Rate and Localization of Prostate Cancer Recurrence Using 68Ga-PSMA-11 PET/MRI in Patients with Low PSA Values ≤ 0.5 ng/mL. J Nucl Med. 2020;61(2):194–201.
2Barbosa FG, Queiroz MA, Nunes RF, Marin JFG, Buchpiguel CA, Cerri GG. Clinical perspectives of PSMA PET/MRI for prostate cancer. Clinics (Sao Paulo). 2018;73(suppl 1):e586s. Published 2018 Sep 21.
3Hicks RM, Simko JP, Westphalen AC, et al. Diagnostic Accuracy of 68Ga-PSMA-11 PET/MRI Compared with Multiparametric MRI in the Detection of Prostate Cancer. Radiology. 2018;289(3):730–737.
4Muehlematter UJ, Rupp NJ, Mueller J, Eberli D, Burger IA. 68Ga-PSMA PET/MR-Positive, Histopathology-Proven Prostate Cancer in a Patient With Negative Multiparametric Prostate MRI. Clin Nucl Med. 2018;43(8):e282–e284.
‡68Ga PSMA is not approved by the US FDA and may not be available for clinical use in all markets.
A
Figure 2.
(A) Axial T2w, (B) ADC map, (C) b1400 DWI and (D) 68Ga PSMA PET/MR fused image.
B
Figure 2.
(A) Axial T2w, (B) ADC map, (C) b1400 DWI and (D) 68Ga PSMA PET/MR fused image.
C
Figure 2.
(A) Axial T2w, (B) ADC map, (C) b1400 DWI and (D) 68Ga PSMA PET/MR fused image.
D
Figure 2.
(A) Axial T2w, (B) ADC map, (C) b1400 DWI and (D) 68Ga PSMA PET/MR fused image.
A
Figure 3.
(A) Axial T2w, (B) ADC map, (C) postcontrast T1w image and (D) 68Ga PSMA PET/MR fused image.
B
Figure 3.
(A) Axial T2w, (B) ADC map, (C) postcontrast T1w image and (D) 68Ga PSMA PET/MR fused image.
C
Figure 3.
(A) Axial T2w, (B) ADC map, (C) postcontrast T1w image and (D) 68Ga PSMA PET/MR fused image.
D
Figure 3.
(A) Axial T2w, (B) ADC map, (C) postcontrast T1w image and (D) 68Ga PSMA PET/MR fused image.
A
Figure 4.
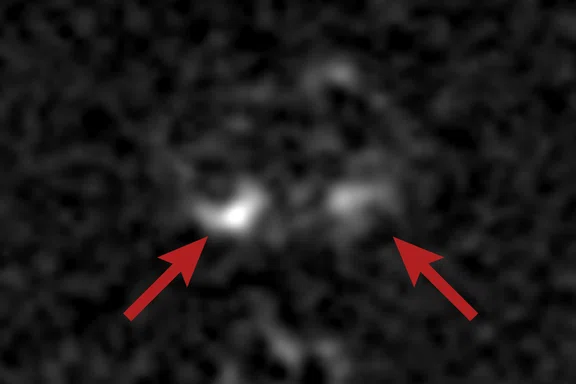
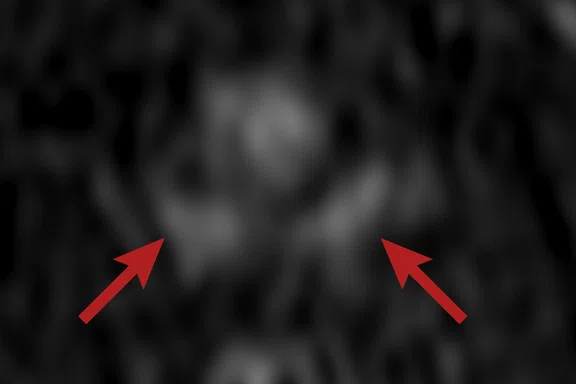
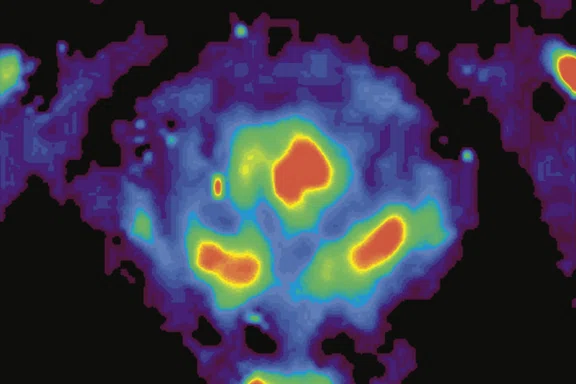
(A) DWI, (B) T1 post-contrast, (C) perfusion k-trans mapping and (D) 68Ga PSMA PET/MR fused image.
B
Figure 4.
(A) DWI, (B) T1 post-contrast, (C) perfusion k-trans mapping and (D) 68Ga PSMA PET/MR fused image.
C
Figure 4.
(A) DWI, (B) T1 post-contrast, (C) perfusion k-trans mapping and (D) 68Ga PSMA PET/MR fused image.
D
Figure 4.
(A) DWI, (B) T1 post-contrast, (C) perfusion k-trans mapping and (D) 68Ga PSMA PET/MR fused image.
A
Figure 5.
(A) 68Ga PSMA PET, (B) b1400 DWI, (C) axial T2w, (D) ADC map and 68Ga PSMA PET fused with (E) T2w and (F) DWI.
B
Figure 5.
(A) 68Ga PSMA PET, (B) b1400 DWI, (C) axial T2w, (D) ADC map and 68Ga PSMA PET fused with (E) T2w and (F) DWI.
C
Figure 5.
(A) 68Ga PSMA PET, (B) b1400 DWI, (C) axial T2w, (D) ADC map and 68Ga PSMA PET fused with (E) T2w and (F) DWI.
D
Figure 5.
(A) 68Ga PSMA PET, (B) b1400 DWI, (C) axial T2w, (D) ADC map and 68Ga PSMA PET fused with (E) T2w and (F) DWI.
E
Figure 5.
(A) 68Ga PSMA PET, (B) b1400 DWI, (C) axial T2w, (D) ADC map and 68Ga PSMA PET fused with (E) T2w and (F) DWI.
F
Figure 5.
(A) 68Ga PSMA PET, (B) b1400 DWI, (C) axial T2w, (D) ADC map and 68Ga PSMA PET fused with (E) T2w and (F) DWI.
A
Figure 6.
(A) 68Ga PSMA PET, (B) b1400 DWI, (C) axial T2w, (D) ADC map and 68Ga PSMA PET fused with (E) T2w and (F) DWI.
B
Figure 6.
(A) 68Ga PSMA PET, (B) b1400 DWI, (C) axial T2w, (D) ADC map and 68Ga PSMA PET fused with (E) T2w and (F) DWI.
C
Figure 6.
(A) 68Ga PSMA PET, (B) b1400 DWI, (C) axial T2w, (D) ADC map and 68Ga PSMA PET fused with (E) T2w and (F) DWI.
D
Figure 6.
(A) 68Ga PSMA PET, (B) b1400 DWI, (C) axial T2w, (D) ADC map and 68Ga PSMA PET fused with (E) T2w and (F) DWI.
E
Figure 6.
(A) 68Ga PSMA PET, (B) b1400 DWI, (C) axial T2w, (D) ADC map and 68Ga PSMA PET fused with (E) T2w and (F) DWI.
F
Figure 6.
(A) 68Ga PSMA PET, (B) b1400 DWI, (C) axial T2w, (D) ADC map and 68Ga PSMA PET fused with (E) T2w and (F) DWI.
result


PREVIOUS
${prev-page}
NEXT
${next-page}
Subscribe Now
Manage Subscription
FOLLOW US
Contact Us • Cookie Preferences • Privacy Policy • California Privacy PolicyDo Not Sell or Share My Personal Information • Terms & Conditions • Security
© 2024 GE HealthCare. GE is a trademark of General Electric Company. Used under trademark license.
CASE STUDIES
Concurrent multiparametric MR with PET/MR for prostate cancer
Concurrent multiparametric MR with PET/MR for prostate cancer
By Bariş Bakir, MD, PhD, Professor of Radiology at Istanbul University School of Medicine, and Lebriz Uslu Beşli, MD, and Sertaç Asa, MD, Istanbul University-Cerrahpaşa, Cerrahpaşa School of Medicine, Nuclear Medicine Department, Istanbul, Turkey
In the past 10 years, there have been groundbreaking developments in the field of prostate cancer. Among these, developments in PET and MR radiopharmaceuticals specific to receptors stand out. Multiparametric MR (mpMR) helps in the detection and localization of prostate cancer, as well as biopsy guidance. Although mpMR is an effective imaging method, the false negative rates of up to 20 percent may create challenges.
The ability of Gallium-68 (68Ga) prostate-specific membrane antigen (PSMA)‡ PET imaging, offering up to 90 percent detection sensitivity, complements MR when mpMR falls short. Thus, PET/MR systems combining 68Ga PSMA PET and mpMR provide a substantial increase in lesion detection rates1,2. It has been shown that 68Ga PSMA PET/MR has a higher accuracy rate with respect to mpMR in primary lesion detection3,4.
It is expected that mpMR performed concurrently with 68Ga PSMA PET/MR may have more prominent significance in clinical practice. The following cases demonstrate, although not yet with histopathological confirmation, how PET and MR reinforce (cases 1 and 5) or complement (cases 2-4) each other.
Case 1
Consistent with both mpMR and 68Ga PSMA PET scans, a prostatic lesion (red arrow) is observed at the left posteromedial peripheral zone with a suspicion of malignancy that could indicate prostate cancer.
A less significant PSMA uptake (blue arrow) with cancer suspicion that was observed in the 68Ga PSMA PET images of the prostatic gland right peripheral zone were non-existent in the multi-parametric prostatic MR sequences.
Case 2
The 68Ga PSMA PET images of the left peripheral zone posteromedial show PSMA uptake with prostatic cancer suspicion. In the mpMR sequences, the same lesion is not clearly visible among the hemorrhage foci.
The patient’s pathology results indicate a Gleason Score of 3+3 on two foci after transrectal ultrasound biopsy (TRUS) biopsy.
All mpMR images taken concurrently with 68Ga PSMA PET/MR images are courtesy of Cerrahpaşa School of Medicine, Nuclear Medicine Department.
Case 3
The 68Ga PSMA PET images of the left transition zone show PSMA uptake with prostatic cancer suspicion. The same lesion cannot be observed in the mpMR sequences.
Case 4
In the sections that intercept the mid-gland level at the prostatic gland, the presence of two recurrent tumoral lesions in both posteromedial peripheral zones indicate growth in the follow-up mpMR assays, observed due to prostate cancer and after brachytherapy. Lesions in the diffusion-weighted MR image are observed as hyperintense. Distinct early arterial contrast uptake is observed at the post-contrast subtraction T1 images. Lesions are observed with a different color code at the perfusion k-trans mapping. At the 68Ga PSMA PET/MR fused image, only the right lesion can be observed while the one on the left is non-existent.
Case 5
A 64-year-old patient with a Gleason Score 3+5 prostate cancer after radical prostatectomy operation was referred for PET/MR. The patient had metastatic pelvic lymph nodes and bone lesions, which showed complete or near-complete regression on the 68Ga PSMA PET after hormone therapy. A 23 × 12 × 10 mm sized residual prostatic lesion on the left side of the bladder neck with diffusion restriction was observed on mpMR. The lesion also showed increased perfusion (not shown). The 68Ga PSMA PET image exhibited no uptake on the residual mass, likely due to response to therapy similar to the other metastatic foci.
Case 6
A 69-year-old patient with Gleason Score 4+4 prostate cancer after TRUS biopsy. mpMR shows a PI-RADS® 5 lesion extending from the left transitional zone to the left peripheral zone of the prostate gland. 68Ga PSMA uptake is observed only on left transitional zone, underestimating the tumor extension in the peripheral zone.
Histopathology results after radical prostatectomy operation revealed Gleason Score 4+3 prostate cancer extending from the transitional zone to the peripheral zone of the gland, which was in accordance with the mpMR images.
Discussion
68Ga PSMA PET/MR imaging offers a significant advancement in the diagnosis and management of prostate cancer, including for the detection of primary lesions and designation of prognosis and staging. We anticipate the simultaneous 68Ga PSMA PET and mpMR method will be an effective component of our diagnostic and treatment algorithms in the near future.


