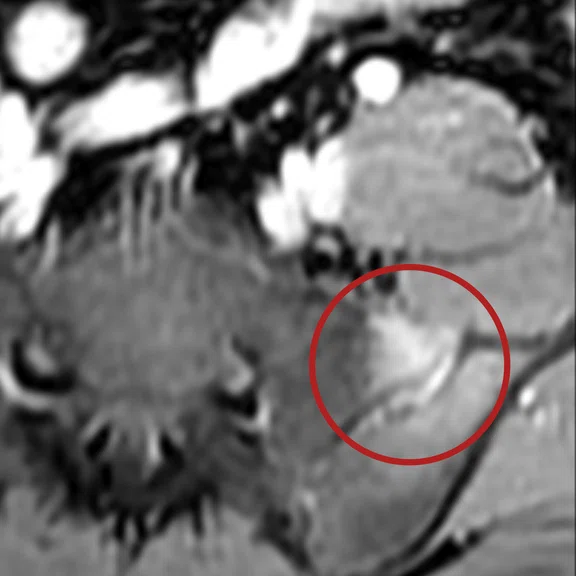
A
Figure 1.
(A) Coronal PD FatSat, (B) axial T1, (C) axial maximum slope of increase, (D) fused and zoomed axial T1 images, and (E-L) DCE LAVA FatSat, 8 phases.
B
Figure 1.
(A) Coronal PD FatSat, (B) axial T1, (C) axial maximum slope of increase, (D) fused and zoomed axial T1 images, and (E-L) DCE LAVA FatSat, 8 phases.
C
Figure 1.
(A) Coronal PD FatSat, (B) axial T1, (C) axial maximum slope of increase, (D) fused and zoomed axial T1 images, and (E-L) DCE LAVA FatSat, 8 phases.
D
Figure 1.
(A) Coronal PD FatSat, (B) axial T1, (C) axial maximum slope of increase, (D) fused and zoomed axial T1 images, and (E-L) DCE LAVA FatSat, 8 phases.
E
Figure 1.
(A) Coronal PD FatSat, (B) axial T1, (C) axial maximum slope of increase, (D) fused and zoomed axial T1 images, and (E-L) DCE LAVA FatSat, 8 phases.
F
Figure 1.
(A) Coronal PD FatSat, (B) axial T1, (C) axial maximum slope of increase, (D) fused and zoomed axial T1 images, and (E-L) DCE LAVA FatSat, 8 phases.
G
Figure 1.
(A) Coronal PD FatSat, (B) axial T1, (C) axial maximum slope of increase, (D) fused and zoomed axial T1 images, and (E-L) DCE LAVA FatSat, 8 phases.
H
Figure 1.
(A) Coronal PD FatSat, (B) axial T1, (C) axial maximum slope of increase, (D) fused and zoomed axial T1 images, and (E-L) DCE LAVA FatSat, 8 phases.
I
Figure 1.
(A) Coronal PD FatSat, (B) axial T1, (C) axial maximum slope of increase, (D) fused and zoomed axial T1 images, and (E-L) DCE LAVA FatSat, 8 phases.
J
Figure 1.
(A) Coronal PD FatSat, (B) axial T1, (C) axial maximum slope of increase, (D) fused and zoomed axial T1 images, and (E-L) DCE LAVA FatSat, 8 phases.
K
Figure 1.
(A) Coronal PD FatSat, (B) axial T1, (C) axial maximum slope of increase, (D) fused and zoomed axial T1 images, and (E-L) DCE LAVA FatSat, 8 phases.
L
Figure 1.
(A) Coronal PD FatSat, (B) axial T1, (C) axial maximum slope of increase, (D) fused and zoomed axial T1 images, and (E-L) DCE LAVA FatSat, 8 phases.
A
Figure 2.
(A) Axial PD FatSat, (B) axial 3D MERGE, (C) coronal T1 FatSat post-contrast and (D) sagittal PD FatSat.
B
Figure 2.
(A) Axial PD FatSat, (B) axial 3D MERGE, (C) coronal T1 FatSat post-contrast and (D) sagittal PD FatSat.
C
Figure 2.
(A) Axial PD FatSat, (B) axial 3D MERGE, (C) coronal T1 FatSat post-contrast and (D) sagittal PD FatSat.
D
Figure 2.
(A) Axial PD FatSat, (B) axial 3D MERGE, (C) coronal T1 FatSat post-contrast and (D) sagittal PD FatSat.
A
Figure 3.
(A-F) DCE LAVA FatSat, 6 phases, (G) coronal T1, (H) coronal maximum slope of increase and (I) fused and zoomed coronal image (H, rectangle).
B
Figure 3.
(A-F) DCE LAVA FatSat, 6 phases, (G) coronal T1, (H) coronal maximum slope of increase and (I) fused and zoomed coronal image (H, rectangle).
C
Figure 3.
(A-F) DCE LAVA FatSat, 6 phases, (G) coronal T1, (H) coronal maximum slope of increase and (I) fused and zoomed coronal image (H, rectangle).
G
Figure 3.
(A-F) DCE LAVA FatSat, 6 phases, (G) coronal T1, (H) coronal maximum slope of increase and (I) fused and zoomed coronal image (H, rectangle).
I
Figure 3.
(A-F) DCE LAVA FatSat, 6 phases, (G) coronal T1, (H) coronal maximum slope of increase and (I) fused and zoomed coronal image (H, rectangle).
H
Figure 3.
(A-F) DCE LAVA FatSat, 6 phases, (G) coronal T1, (H) coronal maximum slope of increase and (I) fused and zoomed coronal image (H, rectangle).
A
Figure 4.
(A) Coronal PD FatSat, (B) coronal T1, (C) sagittal PD FatSat, (D) axial PD FatSat, (E) axial T1, (F) axial DWI b50 and (G) axial DWI b1000.
B
Figure 4.
(A) Coronal PD FatSat, (B) coronal T1, (C) sagittal PD FatSat, (D) axial PD FatSat, (E) axial T1, (F) axial DWI b50 and (G) axial DWI b1000.
C
Figure 4.
(A) Coronal PD FatSat, (B) coronal T1, (C) sagittal PD FatSat, (D) axial PD FatSat, (E) axial T1, (F) axial DWI b50 and (G) axial DWI b1000.
A
Figure 5.
(A-H) Axial DCE LAVA Flex, 8 phases.
B
Figure 5.
(A-H) Axial DCE LAVA Flex, 8 phases.
C
Figure 5.
(A-H) Axial DCE LAVA Flex, 8 phases.
D
Figure 5.
(A-H) Axial DCE LAVA Flex, 8 phases.
E
Figure 5.
(A-H) Axial DCE LAVA Flex, 8 phases.
F
Figure 5.
(A-H) Axial DCE LAVA Flex, 8 phases.
G
Figure 5.
(A-H) Axial DCE LAVA Flex, 8 phases.
H
Figure 5.
(A-H) Axial DCE LAVA Flex, 8 phases.
A
Figure 6.
(A) Coronal PD FatSat, (B) coronal T1 FatSat post-contrast, (C) axial T1, (D) axial maximum slope of increase, (E) fused and zoomed axial image (D, rectangle), (F) axial PD FatSat, (G) axial DWI b50 and (H) axial DWI b1000.
B
Figure 6.
(A) Coronal PD FatSat, (B) coronal T1 FatSat post-contrast, (C) axial T1, (D) axial maximum slope of increase, (E) fused and zoomed axial image (D, rectangle), (F) axial PD FatSat, (G) axial DWI b50 and (H) axial DWI b1000.
C
Figure 6.
(A) Coronal PD FatSat, (B) coronal T1 FatSat post-contrast, (C) axial T1, (D) axial maximum slope of increase, (E) fused and zoomed axial image (D, rectangle), (F) axial PD FatSat, (G) axial DWI b50 and (H) axial DWI b1000.
D
Figure 6.
(A) Coronal PD FatSat, (B) coronal T1 FatSat post-contrast, (C) axial T1, (D) axial maximum slope of increase, (E) fused and zoomed axial image (D, rectangle), (F) axial PD FatSat, (G) axial DWI b50 and (H) axial DWI b1000.
E
Figure 6.
(A) Coronal PD FatSat, (B) coronal T1 FatSat post-contrast, (C) axial T1, (D) axial maximum slope of increase, (E) fused and zoomed axial image (D, rectangle), (F) axial PD FatSat, (G) axial DWI b50 and (H) axial DWI b1000.
F
Figure 6.
(A) Coronal PD FatSat, (B) coronal T1 FatSat post-contrast, (C) axial T1, (D) axial maximum slope of increase, (E) fused and zoomed axial image (D, rectangle), (F) axial PD FatSat, (G) axial DWI b50 and (H) axial DWI b1000.
D
Figure 3.
(A-F) DCE LAVA FatSat, 6 phases, (G) coronal T1, (H) coronal maximum slope of increase and (I) fused and zoomed coronal image (H, rectangle).
E
Figure 3.
(A-F) DCE LAVA FatSat, 6 phases, (G) coronal T1, (H) coronal maximum slope of increase and (I) fused and zoomed coronal image (H, rectangle).
F
Figure 3.
(A-F) DCE LAVA FatSat, 6 phases, (G) coronal T1, (H) coronal maximum slope of increase and (I) fused and zoomed coronal image (H, rectangle).
G
Figure 6.
(A) Coronal PD FatSat, (B) coronal T1 FatSat post-contrast, (C) axial T1, (D) axial maximum slope of increase, (E) fused and zoomed axial image (D, rectangle), (F) axial PD FatSat, (G) axial DWI b50 and (H) axial DWI b1000.
H
Figure 6.
(A) Coronal PD FatSat, (B) coronal T1 FatSat post-contrast, (C) axial T1, (D) axial maximum slope of increase, (E) fused and zoomed axial image (D, rectangle), (F) axial PD FatSat, (G) axial DWI b50 and (H) axial DWI b1000.
A
Figure 1.
(A) Coronal PD FatSat, (B) axial T1, (C) axial maximum slope of increase, (D) fused and zoomed axial T1 images, and (E-L) DCE LAVA FatSat, 8 phases.
B
Figure 1.
(A) Coronal PD FatSat, (B) axial T1, (C) axial maximum slope of increase, (D) fused and zoomed axial T1 images, and (E-L) DCE LAVA FatSat, 8 phases.
C
Figure 1.
(A) Coronal PD FatSat, (B) axial T1, (C) axial maximum slope of increase, (D) fused and zoomed axial T1 images, and (E-L) DCE LAVA FatSat, 8 phases.
D
Figure 1.
(A) Coronal PD FatSat, (B) axial T1, (C) axial maximum slope of increase, (D) fused and zoomed axial T1 images, and (E-L) DCE LAVA FatSat, 8 phases.
E
Figure 1.
(A) Coronal PD FatSat, (B) axial T1, (C) axial maximum slope of increase, (D) fused and zoomed axial T1 images, and (E-L) DCE LAVA FatSat, 8 phases.
F
Figure 1.
(A) Coronal PD FatSat, (B) axial T1, (C) axial maximum slope of increase, (D) fused and zoomed axial T1 images, and (E-L) DCE LAVA FatSat, 8 phases.
G
Figure 1.
(A) Coronal PD FatSat, (B) axial T1, (C) axial maximum slope of increase, (D) fused and zoomed axial T1 images, and (E-L) DCE LAVA FatSat, 8 phases.
H
Figure 1.
(A) Coronal PD FatSat, (B) axial T1, (C) axial maximum slope of increase, (D) fused and zoomed axial T1 images, and (E-L) DCE LAVA FatSat, 8 phases.
I
Figure 1.
(A) Coronal PD FatSat, (B) axial T1, (C) axial maximum slope of increase, (D) fused and zoomed axial T1 images, and (E-L) DCE LAVA FatSat, 8 phases.
J
Figure 1.
(A) Coronal PD FatSat, (B) axial T1, (C) axial maximum slope of increase, (D) fused and zoomed axial T1 images, and (E-L) DCE LAVA FatSat, 8 phases.
K
Figure 1.
(A) Coronal PD FatSat, (B) axial T1, (C) axial maximum slope of increase, (D) fused and zoomed axial T1 images, and (E-L) DCE LAVA FatSat, 8 phases.
L
Figure 1.
(A) Coronal PD FatSat, (B) axial T1, (C) axial maximum slope of increase, (D) fused and zoomed axial T1 images, and (E-L) DCE LAVA FatSat, 8 phases.
A
Figure 4.
(A) Coronal PD FatSat, (B) coronal T1, (C) sagittal PD FatSat, (D) axial PD FatSat, (E) axial T1, (F) axial DWI b50 and (G) axial DWI b1000.
B
Figure 4.
(A) Coronal PD FatSat, (B) coronal T1, (C) sagittal PD FatSat, (D) axial PD FatSat, (E) axial T1, (F) axial DWI b50 and (G) axial DWI b1000.
C
Figure 4.
(A) Coronal PD FatSat, (B) coronal T1, (C) sagittal PD FatSat, (D) axial PD FatSat, (E) axial T1, (F) axial DWI b50 and (G) axial DWI b1000.
D
Figure 4.
(A) Coronal PD FatSat, (B) coronal T1, (C) sagittal PD FatSat, (D) axial PD FatSat, (E) axial T1, (F) axial DWI b50 and (G) axial DWI b1000.
E
Figure 4.
(A) Coronal PD FatSat, (B) coronal T1, (C) sagittal PD FatSat, (D) axial PD FatSat, (E) axial T1, (F) axial DWI b50 and (G) axial DWI b1000.
F
Figure 4.
(A) Coronal PD FatSat, (B) coronal T1, (C) sagittal PD FatSat, (D) axial PD FatSat, (E) axial T1, (F) axial DWI b50 and (G) axial DWI b1000.
G
Figure 4.
(A) Coronal PD FatSat, (B) coronal T1, (C) sagittal PD FatSat, (D) axial PD FatSat, (E) axial T1, (F) axial DWI b50 and (G) axial DWI b1000.
A
Figure 6.
(A) Coronal PD FatSat, (B) coronal T1 FatSat post-contrast, (C) axial T1, (D) axial maximum slope of increase, (E) fused and zoomed axial image (D, rectangle), (F) axial PD FatSat, (G) axial DWI b50 and (H) axial DWI b1000.
B
Figure 6.
(A) Coronal PD FatSat, (B) coronal T1 FatSat post-contrast, (C) axial T1, (D) axial maximum slope of increase, (E) fused and zoomed axial image (D, rectangle), (F) axial PD FatSat, (G) axial DWI b50 and (H) axial DWI b1000.
C
Figure 6.
(A) Coronal PD FatSat, (B) coronal T1 FatSat post-contrast, (C) axial T1, (D) axial maximum slope of increase, (E) fused and zoomed axial image (D, rectangle), (F) axial PD FatSat, (G) axial DWI b50 and (H) axial DWI b1000.
D
Figure 6.
(A) Coronal PD FatSat, (B) coronal T1 FatSat post-contrast, (C) axial T1, (D) axial maximum slope of increase, (E) fused and zoomed axial image (D, rectangle), (F) axial PD FatSat, (G) axial DWI b50 and (H) axial DWI b1000.
E
Figure 6.
(A) Coronal PD FatSat, (B) coronal T1 FatSat post-contrast, (C) axial T1, (D) axial maximum slope of increase, (E) fused and zoomed axial image (D, rectangle), (F) axial PD FatSat, (G) axial DWI b50 and (H) axial DWI b1000.
F
Figure 6.
(A) Coronal PD FatSat, (B) coronal T1 FatSat post-contrast, (C) axial T1, (D) axial maximum slope of increase, (E) fused and zoomed axial image (D, rectangle), (F) axial PD FatSat, (G) axial DWI b50 and (H) axial DWI b1000.
G
Figure 6.
(A) Coronal PD FatSat, (B) coronal T1 FatSat post-contrast, (C) axial T1, (D) axial maximum slope of increase, (E) fused and zoomed axial image (D, rectangle), (F) axial PD FatSat, (G) axial DWI b50 and (H) axial DWI b1000.
H
Figure 6.
(A) Coronal PD FatSat, (B) coronal T1 FatSat post-contrast, (C) axial T1, (D) axial maximum slope of increase, (E) fused and zoomed axial image (D, rectangle), (F) axial PD FatSat, (G) axial DWI b50 and (H) axial DWI b1000.
result


PREVIOUS
${prev-page}
NEXT
${next-page}


Subscribe Now
Manage Subscription
FOLLOW US
Contact Us • Cookie Preferences • Privacy Policy • California Privacy PolicyDo Not Sell or Share My Personal Information • Terms & Conditions • Security
© 2024 GE HealthCare. GE is a trademark of General Electric Company. Used under trademark license.
CASE STUDIES
DCE-MR for the detection of bony lesions
By Amjed Kadhim, MD, Head of Radiology Department, Al-Kafeel Hospital, Karbala, Iraq
Medical imaging has an important role in diagnosing and evaluating tumors and inflammation, with MR regarded as an ideal modality for this assessment. Compared with morphological imaging and functional imaging techniques, dynamic contrast enhanced (DCE) MR provides physiological information and has advantages to extract lesion mechanisms. DCE-MR involves the serial acquisition of T1-weighted images before, during and after the injection of a paramagnetic contrast agent.
Currently, DCE-MR has been used to evaluate treatment efficacy for glioblastoma, nasopharyngeal carcinomas and other cancers. Using DCE-MR, we can perform a perfusion study to evaluate how contrast flows inside organs and masses. It is valuable for detecting abdominal and pelvic lesions in the liver, pancreas, spleen and uterus. For example, an endometrial polyp could be missed without a dynamic study. A perianal fistula brightens and is easily followed in the early phases of a dynamic study. High vascular lesions, such as an osteoid osteoma, cannot be confirmed without perfusion and the staging of femoral avascular necrosis (AVN) can be estimated with perfusion.
In our hospital, we have applied the same concept in cases of bony lesion tumors, as well as the inflammatory process in bone. The combination of diffusion-weighted MR and DCE-MR in the diagnosis and assessment of therapy response for solid tumors is routinely used in many radiology departments globally.
GE Healthcare brought Dixon imaging to the forefront of MR with LAVA Flex. LAVA Flex is a 3D, FSPGR sequence that generates water-only, fat-only, in-phase and out-of-phase echoes in a single acquisition that is typically completed in a very short time. This technique provides excellent homogenous fat separation over the entire field of view, including areas that are difficult to image using conventional fat suppression due to magnetic susceptibility effect. Today, LAVA Flex is very fast and efficient with virtually no inhomogeneity and provides an improvement in SNR. LAVA and LAVA Flex deliver thin slices with good resolution and contrast needed to evaluate bones and joints. With LAVA, we can visualize the chondral surface of the joint. With LAVA Flex DCE, our radiologists can potentially detect inflammatory enhancement.
LAVA and LAVA Flex sequences are essential in our DCE protocol. We quantify the data using the Arterial Input Function (AIF) analysis tool on GE’s READY View. The AIF is a measure of the contrast agent concentration in the plasma, and is a necessary component for quantitative modeling as it provides the "input" to the system. The AIF can be measured via blood sampling, but this requires frequent, rapid samplings, which is often uncomfortable in the clinical setting.
Case 1
Patient history
A nine-year-old weighing 30 kg (66 lbs.) complained of hip joint pain, particularly at night, and had an abnormal gait. Ultrasound shows thick synovium and a small amount of joint effusion. Suspected arthritis.
Findings
On the proton density sequence, a small abnormally high signal lesion is seen below the growth plate of the left femoral head. A perfusion study shows significant early wash-in enhancement in this lesion, indicating a small osteoid osteoma.
Case 2
Patient history
A 17-year-old male with right mid-thigh pain that becomes very sharp and worsens with activity as well as occurs most frequently at night. X-ray shows focal cortical thickening in the femur.
Findings
There is a thick and regular periosteal reaction in the mid third of the right femur with presence of a small PD lesion in the same region. Dynamic study of this lesion shows bright, early wash-in enhancement suggestive of osteoid osteoma.
Case 3
Patient history
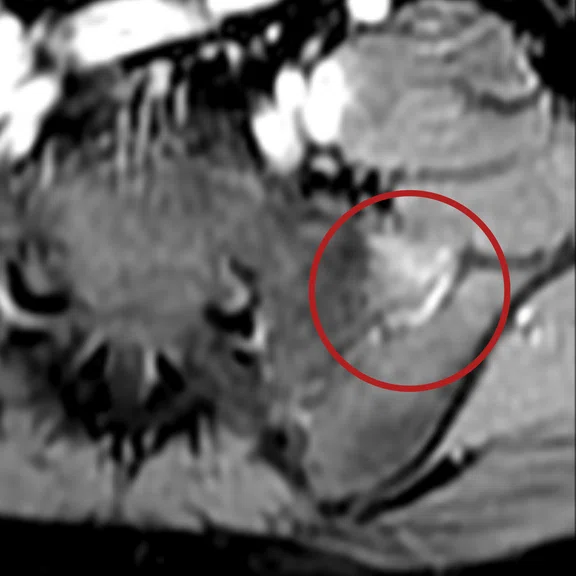
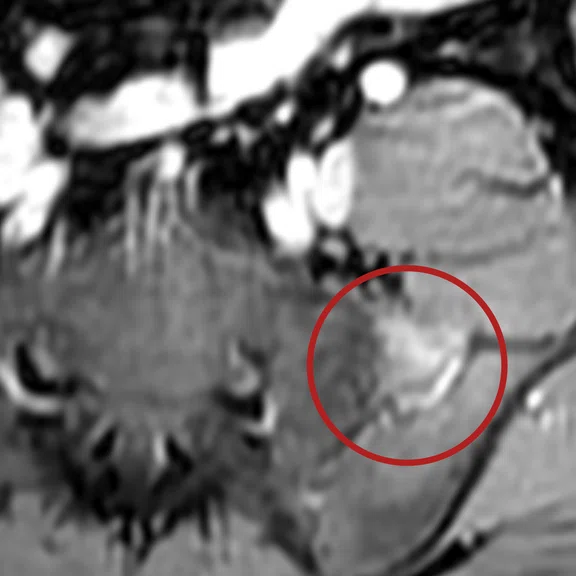
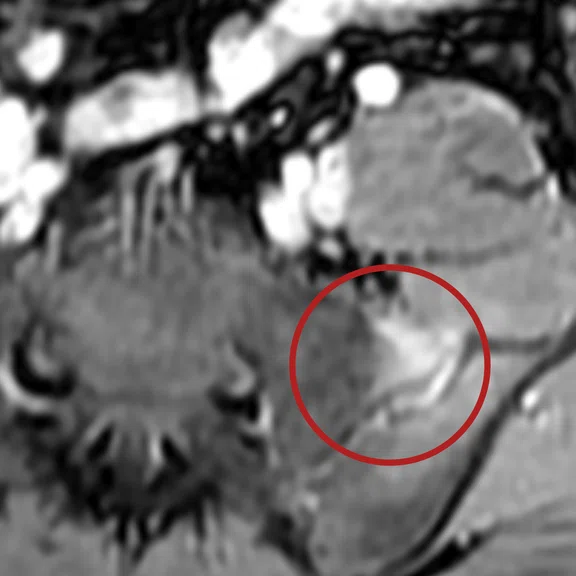
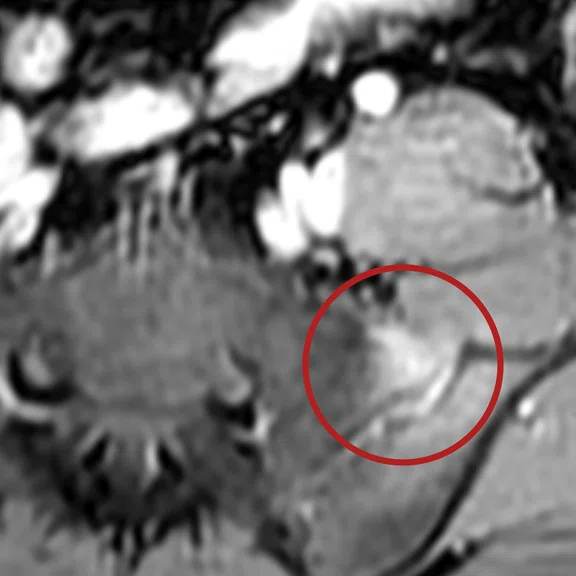
A 38-year-old female with lower back pain radiating to left lower leg, with stiffness in the left hip.
Findings
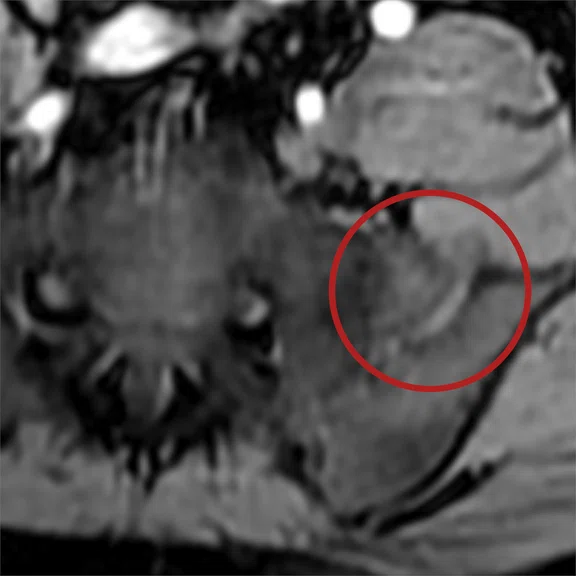
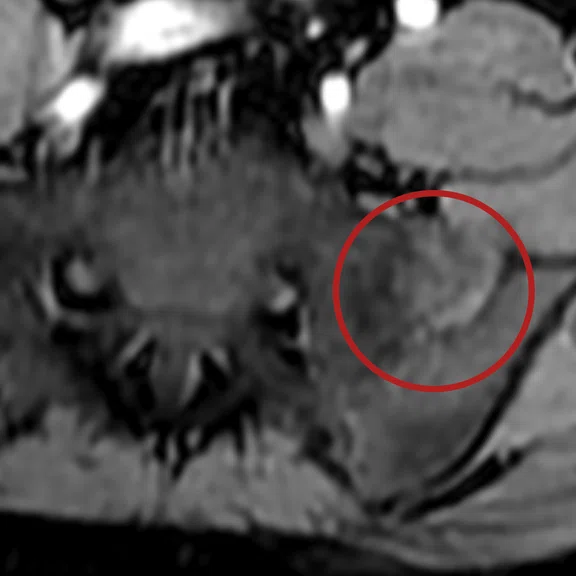
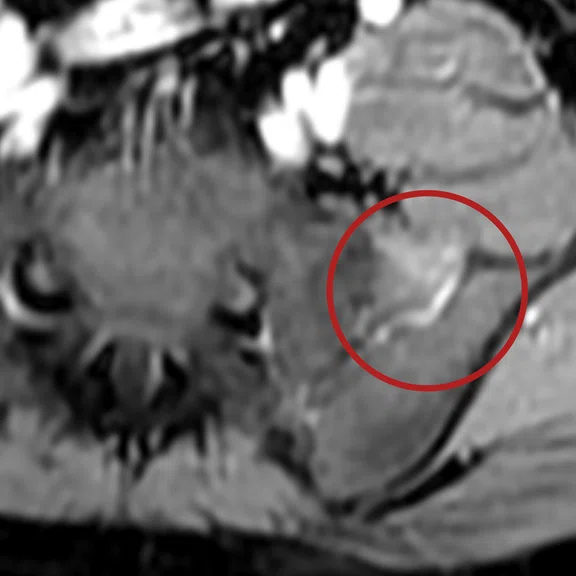
There is bone marrow edema in both sides of the left sacroiliac (SI) joint. Dynamic contrast study shows bright, early wash-in enhancement on both sides of the left SI joint suggestive of acute sacroiliitis.
Discussion
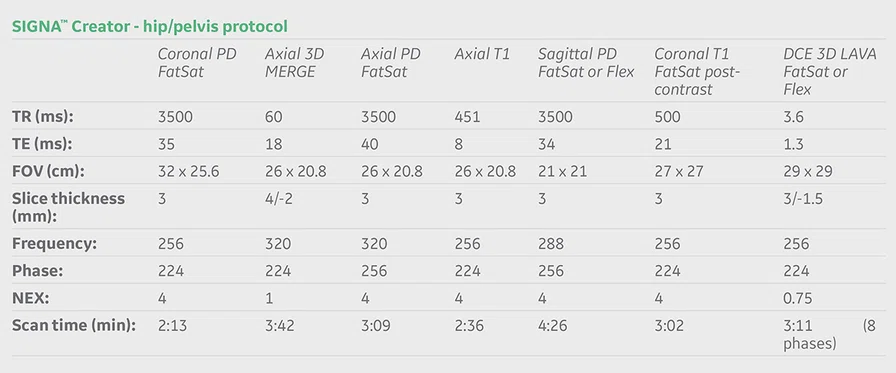
With rising healthcare costs, we strive to find a more efficient care pathway for our patients, moving them along to treatment more quickly. In the case of bone lesions or inflammation, we have a one-stop-shop with SIGNA™ Creator, DCE, LAVA and LAVA Flex, enabling diagnosis of bone mass lesions and assessing the wash-in and wash-out of lesions for staging.
In combination with DCE LAVA and LAVA Flex, we are using enhanced DWI (eDWI), another important sequence in our MR protocol for oncology imaging, including bony lesion detection. eDWI depicts corresponding areas of restricted diffusion and is a key marker for bone lesions, especially when used with the bony enhancement visualization provided by DCE LAVA Flex. Together, LAVA Flex and eDWI provide us with a tremendous ability to detect disease in both pediatrics and adults.
References
- Zhu J, Zhang F, Luan Y, et al. Can Dynamic ContrastEnhanced MRI (DCE-MRI) and Diffusion-Weighted MRI (DW-MRI) Evaluate Inflammation Disease: A Preliminary Study of Crohn’s Disease. Medicine (Baltimore). 2016;95(14):e3239. doi:10.1097/MD.0000000000003239
- Victor M. Uniting Modalities to Create Efficient Cancer Care Pathways. SIGNA Pulse of MR, Autumn 2012; (13):56-59. Available at: http://www.gesignapulse.com/signapulse/signapulseautumn2012?pm=2&pg=56#pg56
- Developing a Rapid MR Exam for Pediatric Acute Appendicitis. SIGNA Pulse of MR, Autumn 2014; (17):29-35. Available at: http://www.gesignapulse.com/signapulse/signapulse2014autumn?pg=34#pg34


