A
Figure 1.
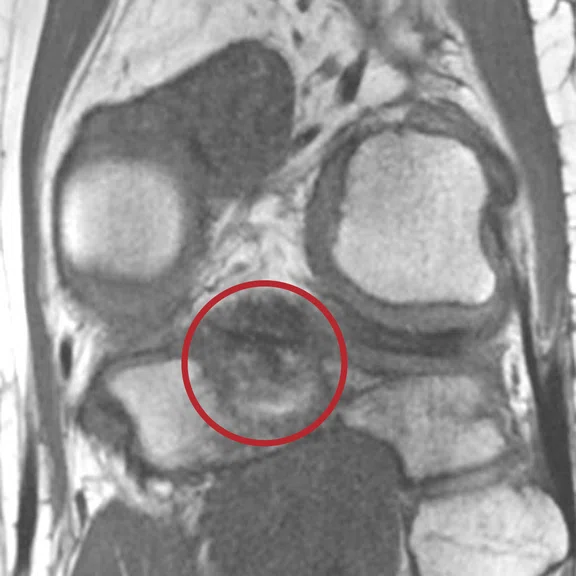
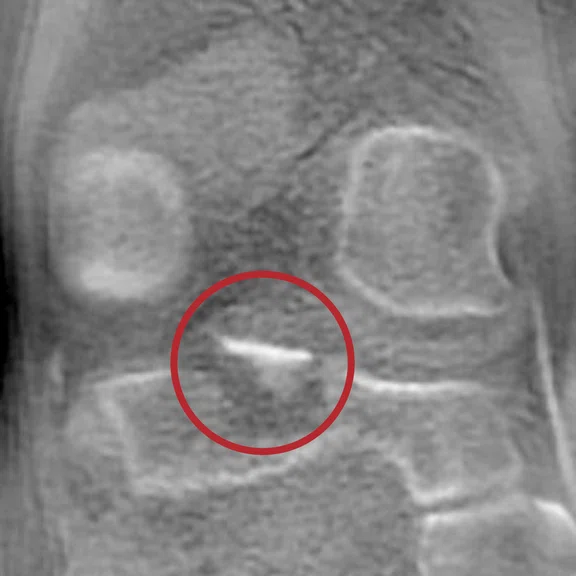
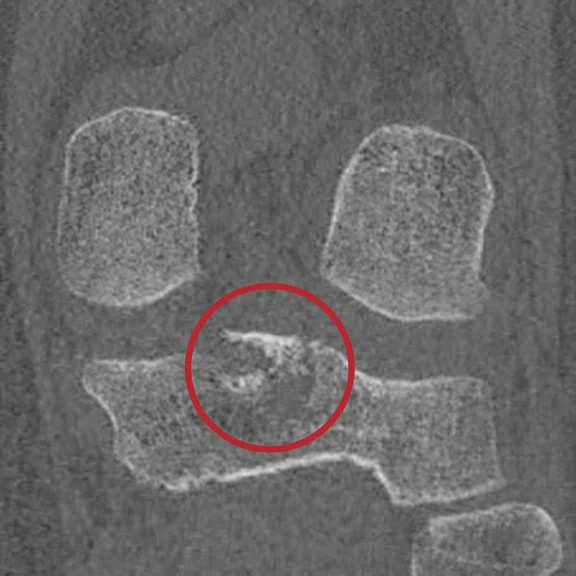
(A) MPR Cube PD FatSat, (B) MPR T1 Cube, (C) ZTE, (D) CT, (E) MPR T1 Cube and (F) ZTE.
B
Figure 1.
(A) MPR Cube PD FatSat, (B) MPR T1 Cube, (C) ZTE, (D) CT, (E) MPR T1 Cube and (F) ZTE.
C
Figure 1.
(A) MPR Cube PD FatSat, (B) MPR T1 Cube, (C) ZTE, (D) CT, (E) MPR T1 Cube and (F) ZTE.
D
Figure 1.
(A) MPR Cube PD FatSat, (B) MPR T1 Cube, (C) ZTE, (D) CT, (E) MPR T1 Cube and (F) ZTE.
E
Figure 1.
(A) MPR Cube PD FatSat, (B) MPR T1 Cube, (C) ZTE, (D) CT, (E) MPR T1 Cube and (F) ZTE.
F
Figure 1.
(A) MPR Cube PD FatSat, (B) MPR T1 Cube, (C) ZTE, (D) CT, (E) MPR T1 Cube and (F) ZTE.
A
Figure 2.
(A) MPR T1 Cube, (B) ZTE , and(C) CT.
B
Figure 2.
(A) MPR T1 Cube, (B) ZTE , and(C) CT.
C
Figure 2.
(A) MPR T1 Cube, (B) ZTE , and(C) CT.
A
Figure 4.
(A) Sagittal T2 Flex and (B) ZTE.
B
Figure 4.
(A) Sagittal T2 Flex and (B) ZTE.
A
Figure 5.
(A) MPR T2 and (B) Cube ZTE.
B
Figure 5.
(A) MPR T2 and (B) Cube ZTE.
A
Figure 6.
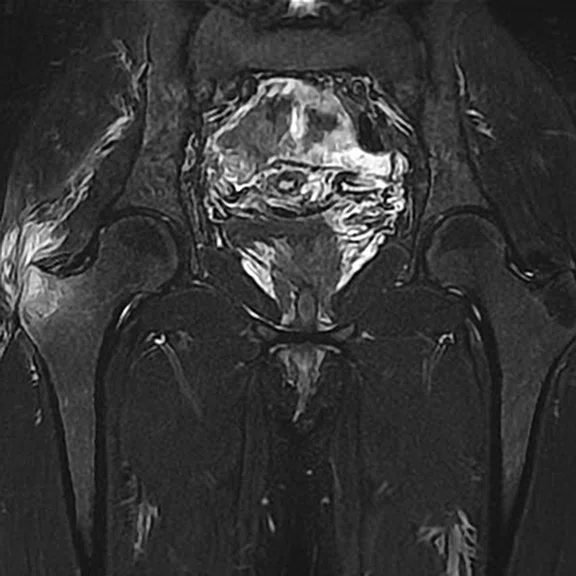
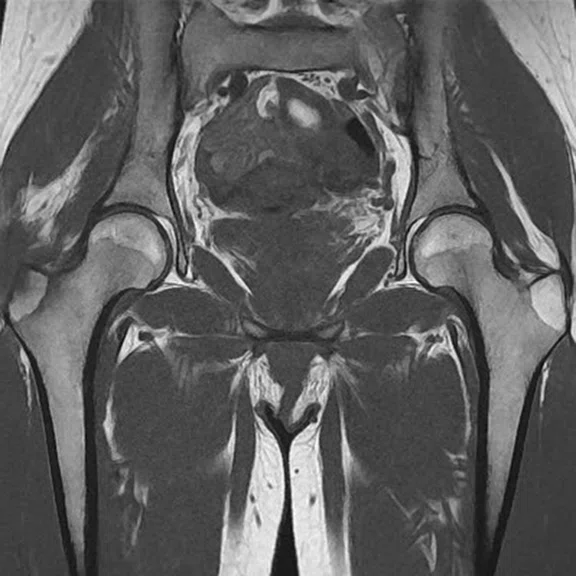
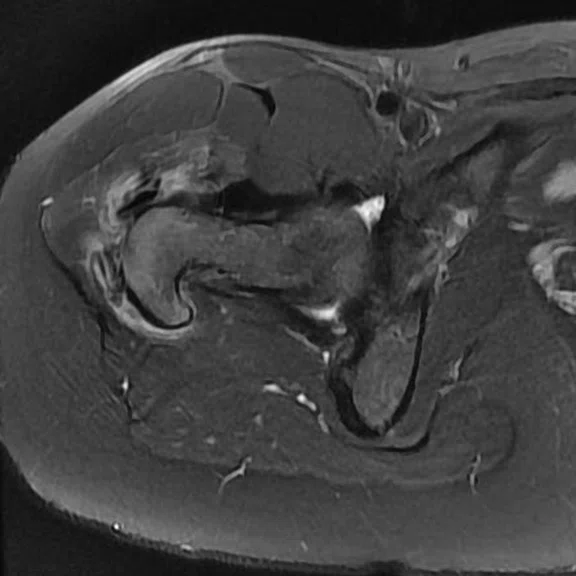
(A) Coronal T2 FatSat, (B) coronal T1 and (C) unilateral axial T2 FatSat.
B
Figure 6.
(A) Coronal T2 FatSat, (B) coronal T1 and (C) unilateral axial T2 FatSat.
C
Figure 6.
(A) Coronal T2 FatSat, (B) coronal T1 and (C) unilateral axial T2 FatSat.
A
Figure 7.
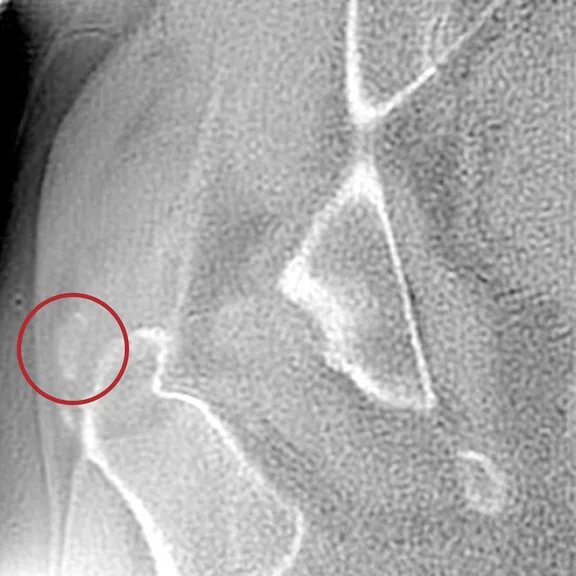
(A, B) ZTE and (C) CT image.
B
Figure 7.
(A, B) ZTE and (C) CT image.
C
Figure 7.
(A, B) ZTE and (C) CT image.
A
Figure 8.
(A) Coronal T2 FatSat, (B) coronal T1 and (C) ZTE.
B
Figure 8.
(A) Coronal T2 FatSat, (B) coronal T1 and (C) ZTE.
C
Figure 8.
(A) Coronal T2 FatSat, (B) coronal T1 and (C) ZTE.
A
Figure 9.
(A) Sagittal T2 FatSat, (B) sagittal T1 and (C) ZTE.
B
Figure 9.
(A) Sagittal T2 FatSat, (B) sagittal T1 and (C) ZTE.
C
Figure 9.
(A) Sagittal T2 FatSat, (B) sagittal T1 and (C) ZTE.
A
Figure 10.
(A) Sagittal T1, (B) axial T2 FatSat, (C) coronal T1 and (D-F) ZTE images.
B
Figure 10.
(A) Sagittal T1, (B) axial T2 FatSat, (C) coronal T1 and (D-F) ZTE images.
C
Figure 10.
(A) Sagittal T1, (B) axial T2 FatSat, (C) coronal T1 and (D-F) ZTE images.
D
Figure 10.
(A) Sagittal T1, (B) axial T2 FatSat, (C) coronal T1 and (D-F) ZTE images.
E
Figure 10.
(A) Sagittal T1, (B) axial T2 FatSat, (C) coronal T1 and (D-F) ZTE images.
F
Figure 10.
(A) Sagittal T1, (B) axial T2 FatSat, (C) coronal T1 and (D-F) ZTE images.
A
Figure 3.
(A) Sagittal T2 Flex, (B) sagittal T1 FLAIR, (C) ZTE and (D) CT.
B
Figure 3.
(A) Sagittal T2 Flex, (B) sagittal T1 FLAIR, (C) ZTE and (D) CT.
C
Figure 3.
(A) Sagittal T2 Flex, (B) sagittal T1 FLAIR, (C) ZTE and (D) CT.
D
Figure 3.
(A) Sagittal T2 Flex, (B) sagittal T1 FLAIR, (C) ZTE and (D) CT.
result


PREVIOUS
${prev-page}
NEXT
${next-page}
Subscribe Now
Manage Subscription
FOLLOW US
Contact Us • Cookie Preferences • Privacy Policy • California Privacy PolicyDo Not Sell or Share My Personal Information • Terms & Conditions • Security
© 2024 GE HealthCare. GE is a trademark of General Electric Company. Used under trademark license.
CASE STUDIES
ZTE a valuable tool for osteoarticular MR
ZTE a valuable tool for osteoarticular MR
By Eric Lévêque, RT(R)(MR), MR Supervisor, Clinique du Sport and IRM Jardin des Plantes, Paris, France
Introduction
The Zero-TE (ZTE) sequence is a 3D technique originally developed to obtain T1-weighted images of the brain in complete silent mode. It has also been useful for MR angiography at 3.0T. Recently, the sequence has been explored for use in morphological imaging of bone. It can also demonstrate calcium deposits in locations other than bone or dental tissue. The generated dataset can be isotropic to produce reformats of equal resolution in any orientation. Because the ZTE sequence receives the MR signal before any T2-relaxation decay, it is particularity useful for studying very short T2 tissues such as cortical bone, which usually appears black due to its extremely short T2.
"In our experience, the routine use of ZTE has made it possible to highlight bone pathologies or the presence of calcifications. Our MR exams have become more efficient since they now combine the usual soft tissue differentiation of conventional MR with the almost CT-like appearance of ZTE."
Eric Lévêque
Technique
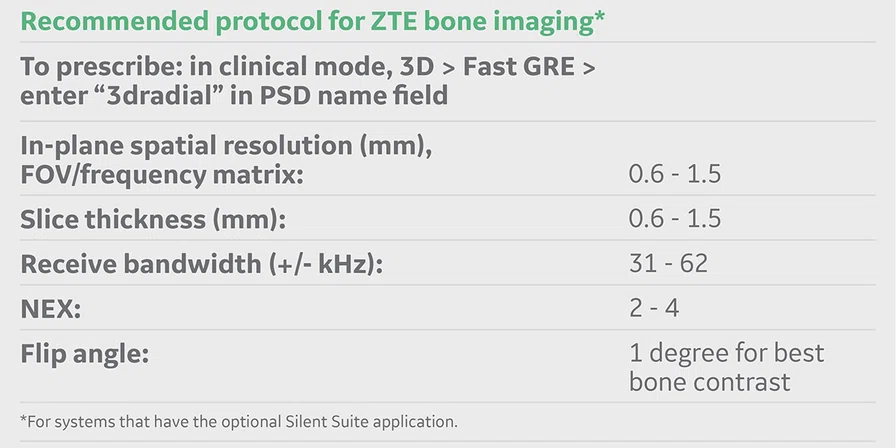
With the purchase of Silent Suite, the ZTE sequence on our Optima™ MR450w GEM with SIGNA™Works can be used on any anatomy and with any RF coil. Its SNR allows us to produce high resolution imaging on most anatomies ranging from 0.6 mm to 1.4 mm with the choice of resolution parameters linked to the anatomy under study. For a typical knee exam we use a field of view (FOV) of 22 cm, 2752 matrix and 0.8 mm slice thickness; for the wrist the typical protocol is 16 cm FOV, 2702 matrix and 0.6 mm thickness; and for the lumbar spine 40 cm FOV, 2902 matrix and 1.4 mm slice thickness. Scan times range from 3 to 4:30 minutes. Apart from the resolution parameter, the flip angle has a real impact on the image contrast and SNR. A higher flip angle results in higher SNR but also increases T1-weighted contrast in soft tissues, such as muscle or fat. For a CT-like appearance, the contrast in soft tissues should be kept at a minimum. A value of 1 degree is recommended to produce CT-like images and 2 degrees is recommended for the highest SNR. In general, the ZTE images are viewed in reverse contrast for the best CT-like appearance in which the bone surfaces are rendered bright. Unlike CT, the MR ZTE background is also bright.
Case 1
Patient presented with a fracture of the posterior intercondylar eminence associated with a fracture of the head of the fibula. Note the almost identical aspect of the CT and the ZTE MR images. Even if the ZTE images have lower resolution, the CT scan, performed after the MR, confirmed all the bone lesions shown by ZTE.
Case 2
A case of traumatic fracture of the C7 spinous process. In this case, the C7 fracture was known and visible on the CT scan. It is, however, interesting to see that ZTE was able to highlight the fracture with similar quality.
Case 3
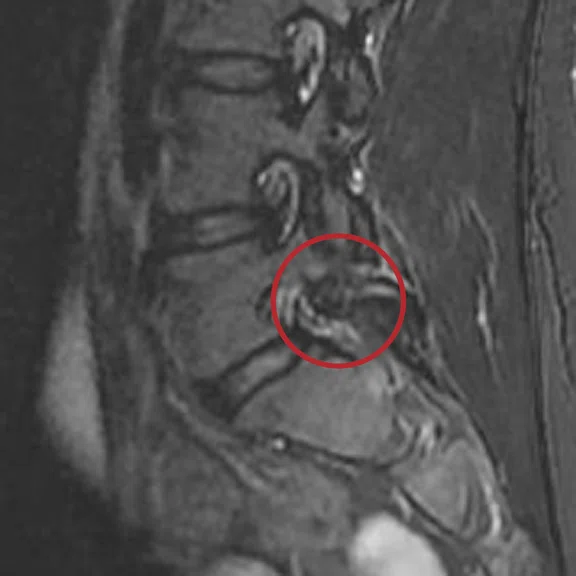
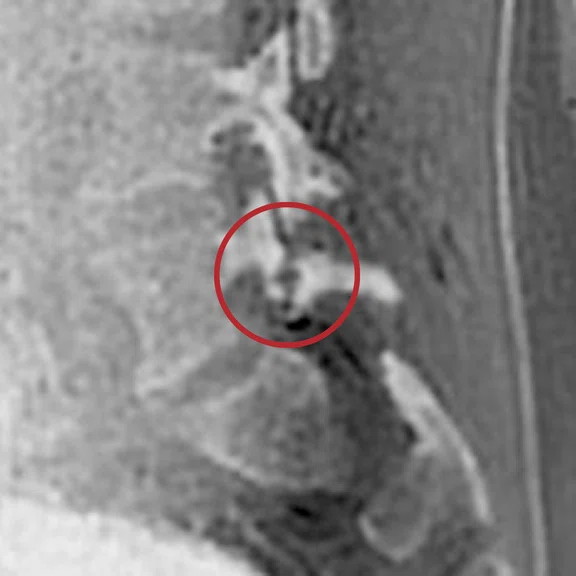
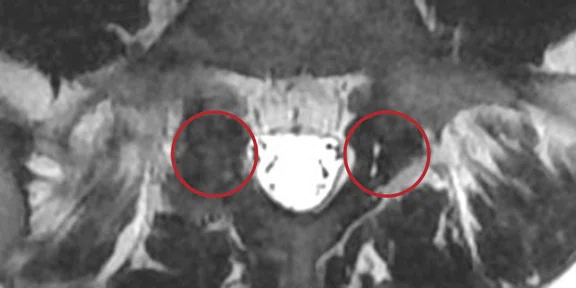
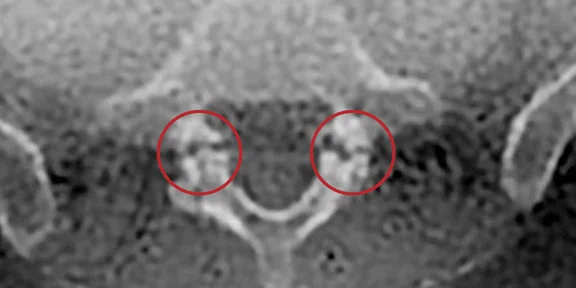
Patient with isthmic lysis and low back pain. The visualization of an isthmic lysis is sometimes difficult and, in case of doubt, it calls for a complementary CT scan. In this case, the ZTE sequence provided an univocal answer, clearly showing both lyses in the sagittal and axial planes.
Case 4
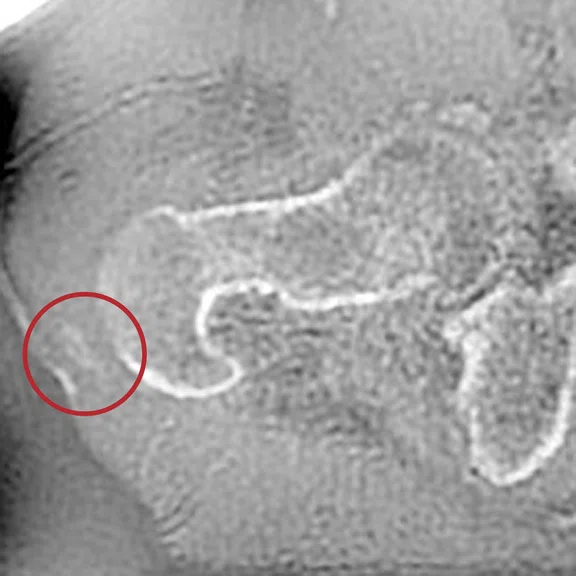
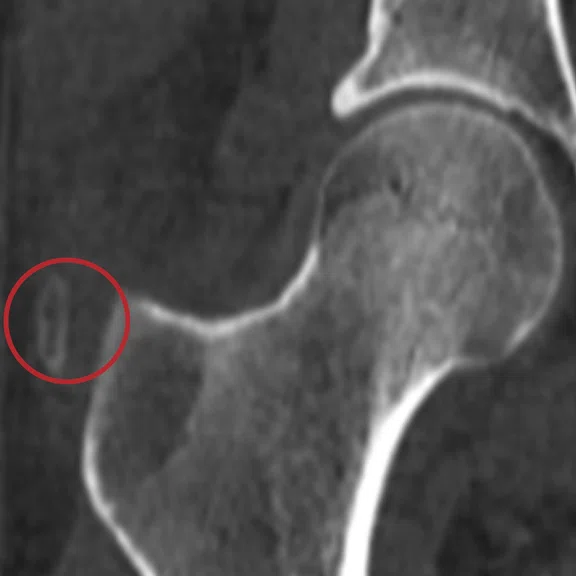
Chronic pain of the right hip in a patient follow up for psoriatic arthritis. The ZTE sequence highlighted calcifications of the right gluteus medius, later confirmed by CT.
Case 5
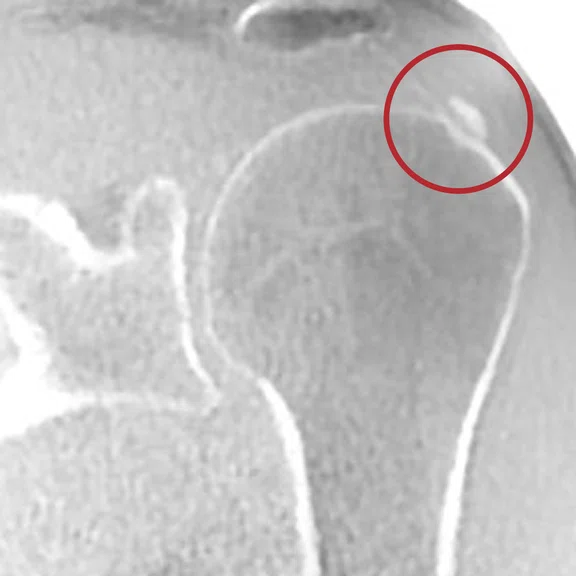
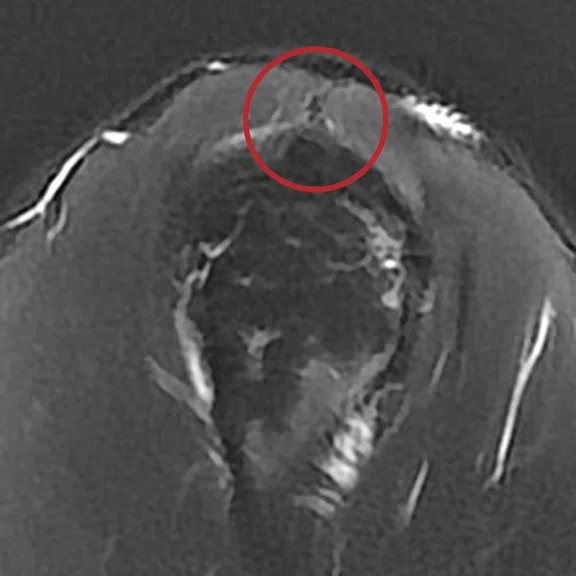
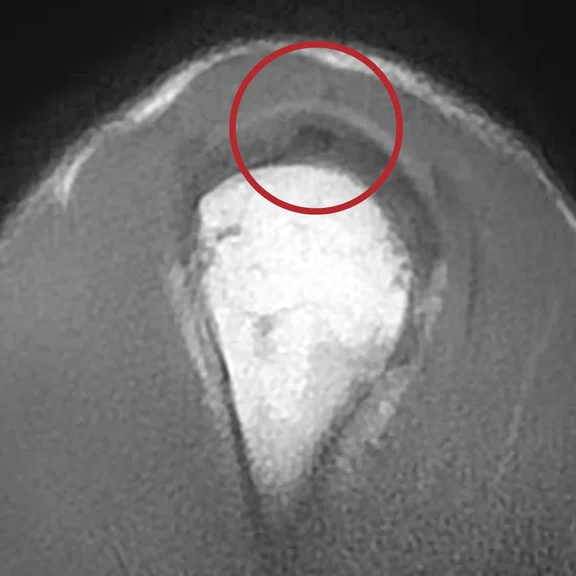
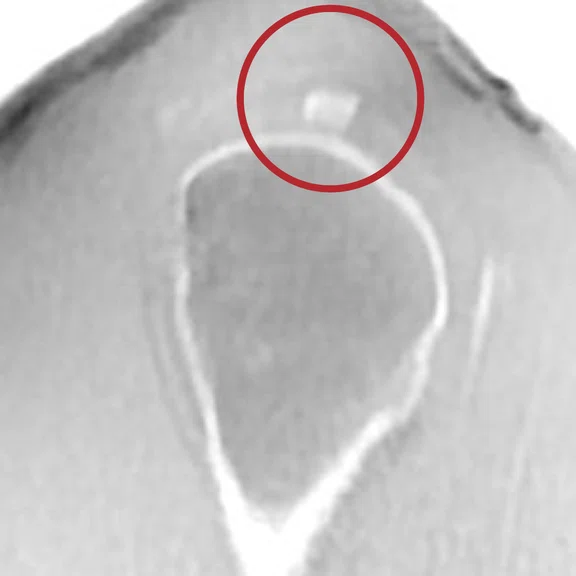
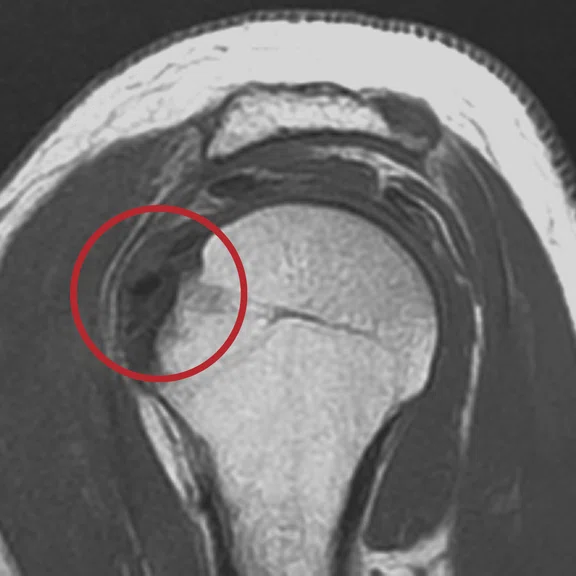
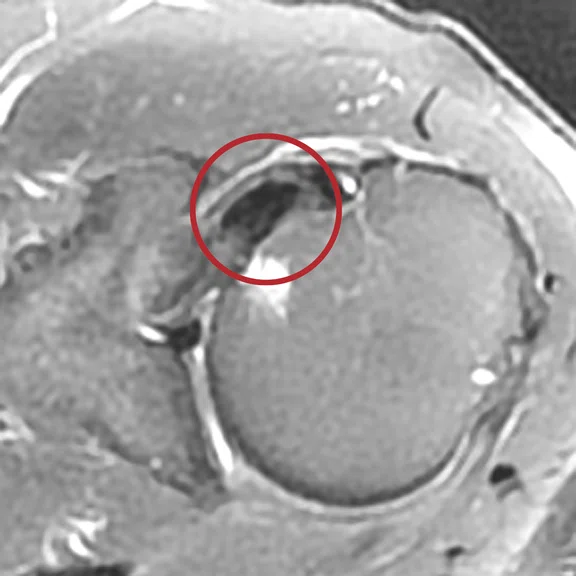
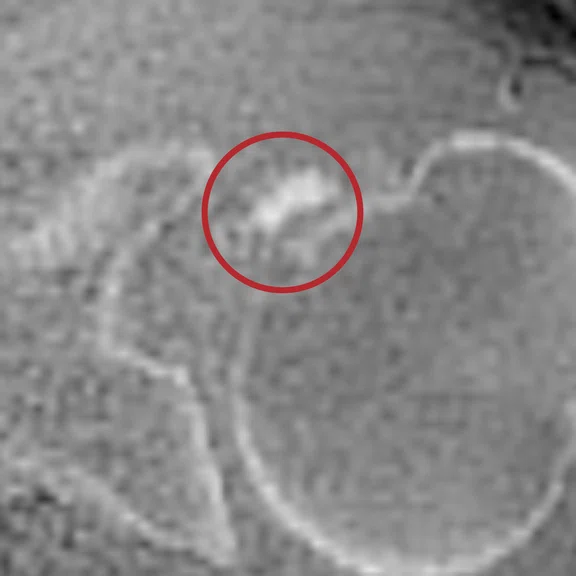
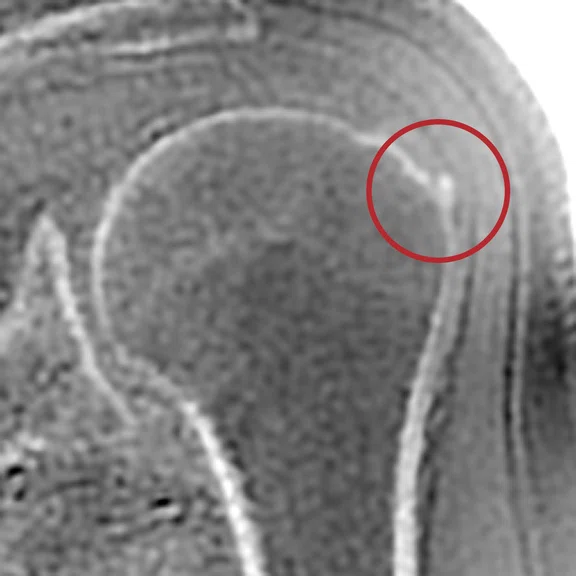
Mechanical chronic pain of the shoulder. The ZTE sequence confirms with certainty the presence of a calcified mass on the supraspinatus tendon.
Case 6
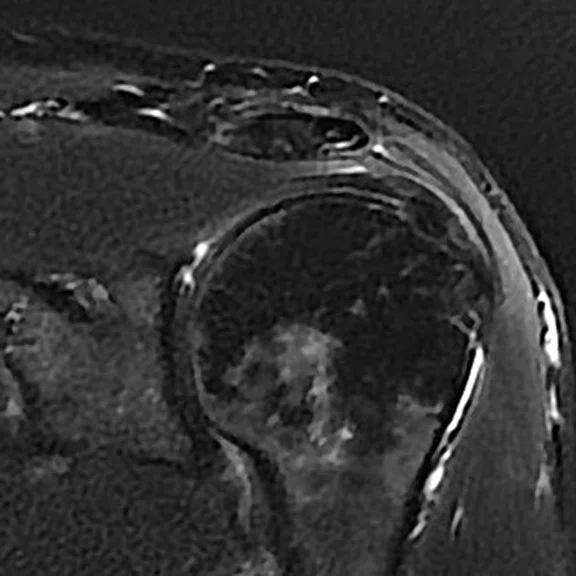
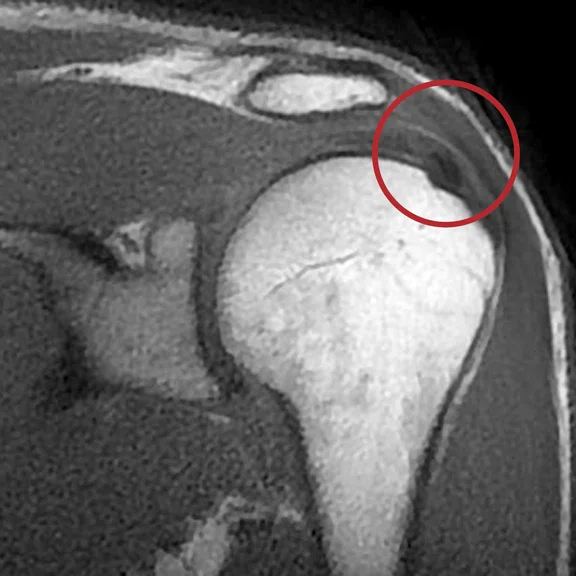
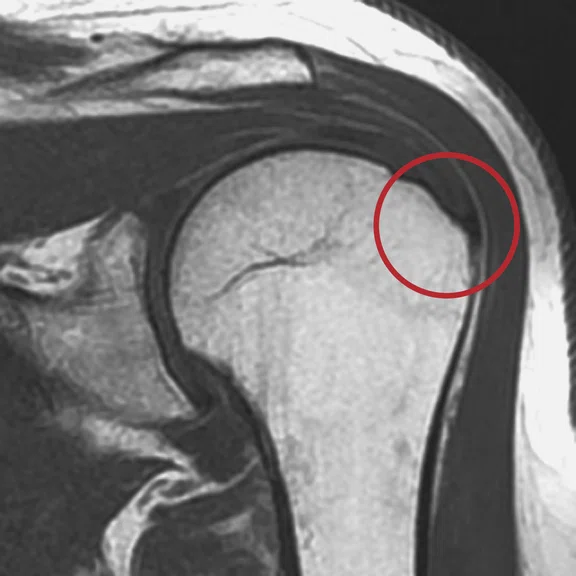
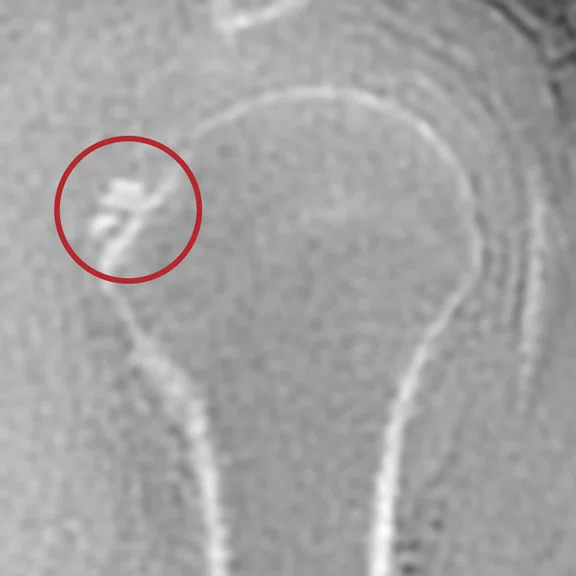
Functional impairment in a patient with known calcifying tendinopathy. Note the small calcification in the supraspinatus tendon visible with ZTE and invisible on the standard sequences.
Discussion
As demonstrated by these cases, the ZTE sequence can depict structures and pathologies of different types generally unseen on standard MR.
"Our experience has convinced us that ZTE brings added value to the MR exam of bone and may, in many cases, eliminate the need for a complementary CT or X-ray exam after the MR acquisition."
Eric Lévêque
However, several limitations to the ZTE technique should be considered. The first is spatial resolution to obtain an acceptable SNR since we are comparing with CT rather than standard MR. Scanning at 3.0T with higher element coils greatly reduces this resolution gap with CT.
The other limitation concerns the lack of contrast between some normal tissues and pathological calcifications. ZTE depicts with low signal (white on the grayscale-inverted images) structures with very short T2 such as tendons, ligaments and fibrocartilage. Small calcifications within these structures may be very difficult to detect as they appear as white spots on a white background (always in inverted grayscale).
There is also the issue, as with both an MR sequence and a CT scan, of the presence of metal, typically in MR-Conditional implants. Fortunately, ZTE makes signal voids smaller and less prevalent than in standard MR, so that the ZTE images often retain diagnostic value despite the presence of paramagnetic metal.
Finally, the presence of air and its consequent lack of signal can be hard to distinguish from a calcium deposit. For instance, an intra-disc air bubble would produce the same image as a calcification. Any MR sequence, including ZTE, would fall short differentiating between the two.
Conclusion
As demonstrated with the cases presented, the ZTE sequence is a valuable diagnostic aid in osteoarticular MR because it can depict bone and calcified structures unlike other MR techniques. If ZTE images appear similar today to what CT images looked like before the advent of multi-detector row systems, we can expect that future progress of MR technology will continue to improve the quality, speed and resolution of these images. ZTE has certainly the potential of becoming a routine imaging tool, enabling MR to provide an exhaustive osteoarticular exam.
Acknowledgements
The author gratefully acknowledges the assistance of the following colleagues: Dr. Nathalie Chemla, Dr. Bassam Hamzé, Dr. Jean Mani, Dr. Quentin Monzani, Dr. Jean-François Naouri and, Dr. Patrick Younes (Sport Clinic, IRM Center Jardin des Plantes, Geoffroy Saint Hilaire Clinic, Paris V), and Dr. Bertrand Bordet (Clinique du Parc, Lyon).


